Investigating case data visually on the ESPA analysis center
Analysis Center
The ESPA analysis center allows you to investigate the case data visually, generate analysis evidence, view the analysis results and create advanced analysis reports.
This section of the Help describes how to use the ESPA analysis center screen to investigate the case data.
With the ESPA analysis center, simply because a view is attached to a particular area of the screen by default, does not mean it has to stay there. You can float a view by clicking the view and dragging it down until it floats. Once a view is floating you can attach it to a particular part of the screen, this is known as docking. To float, move and dock a view, click in the view title and float it, then drag it to the region where you want to dock it, and drop it in the region. If your workspace is large, for example if you are using multiple monitors, this analysis center also provides the flexibility to open the different views in separate browser windows.
All the topics in this section require your account to be configured with the ESPA analysis center screen.
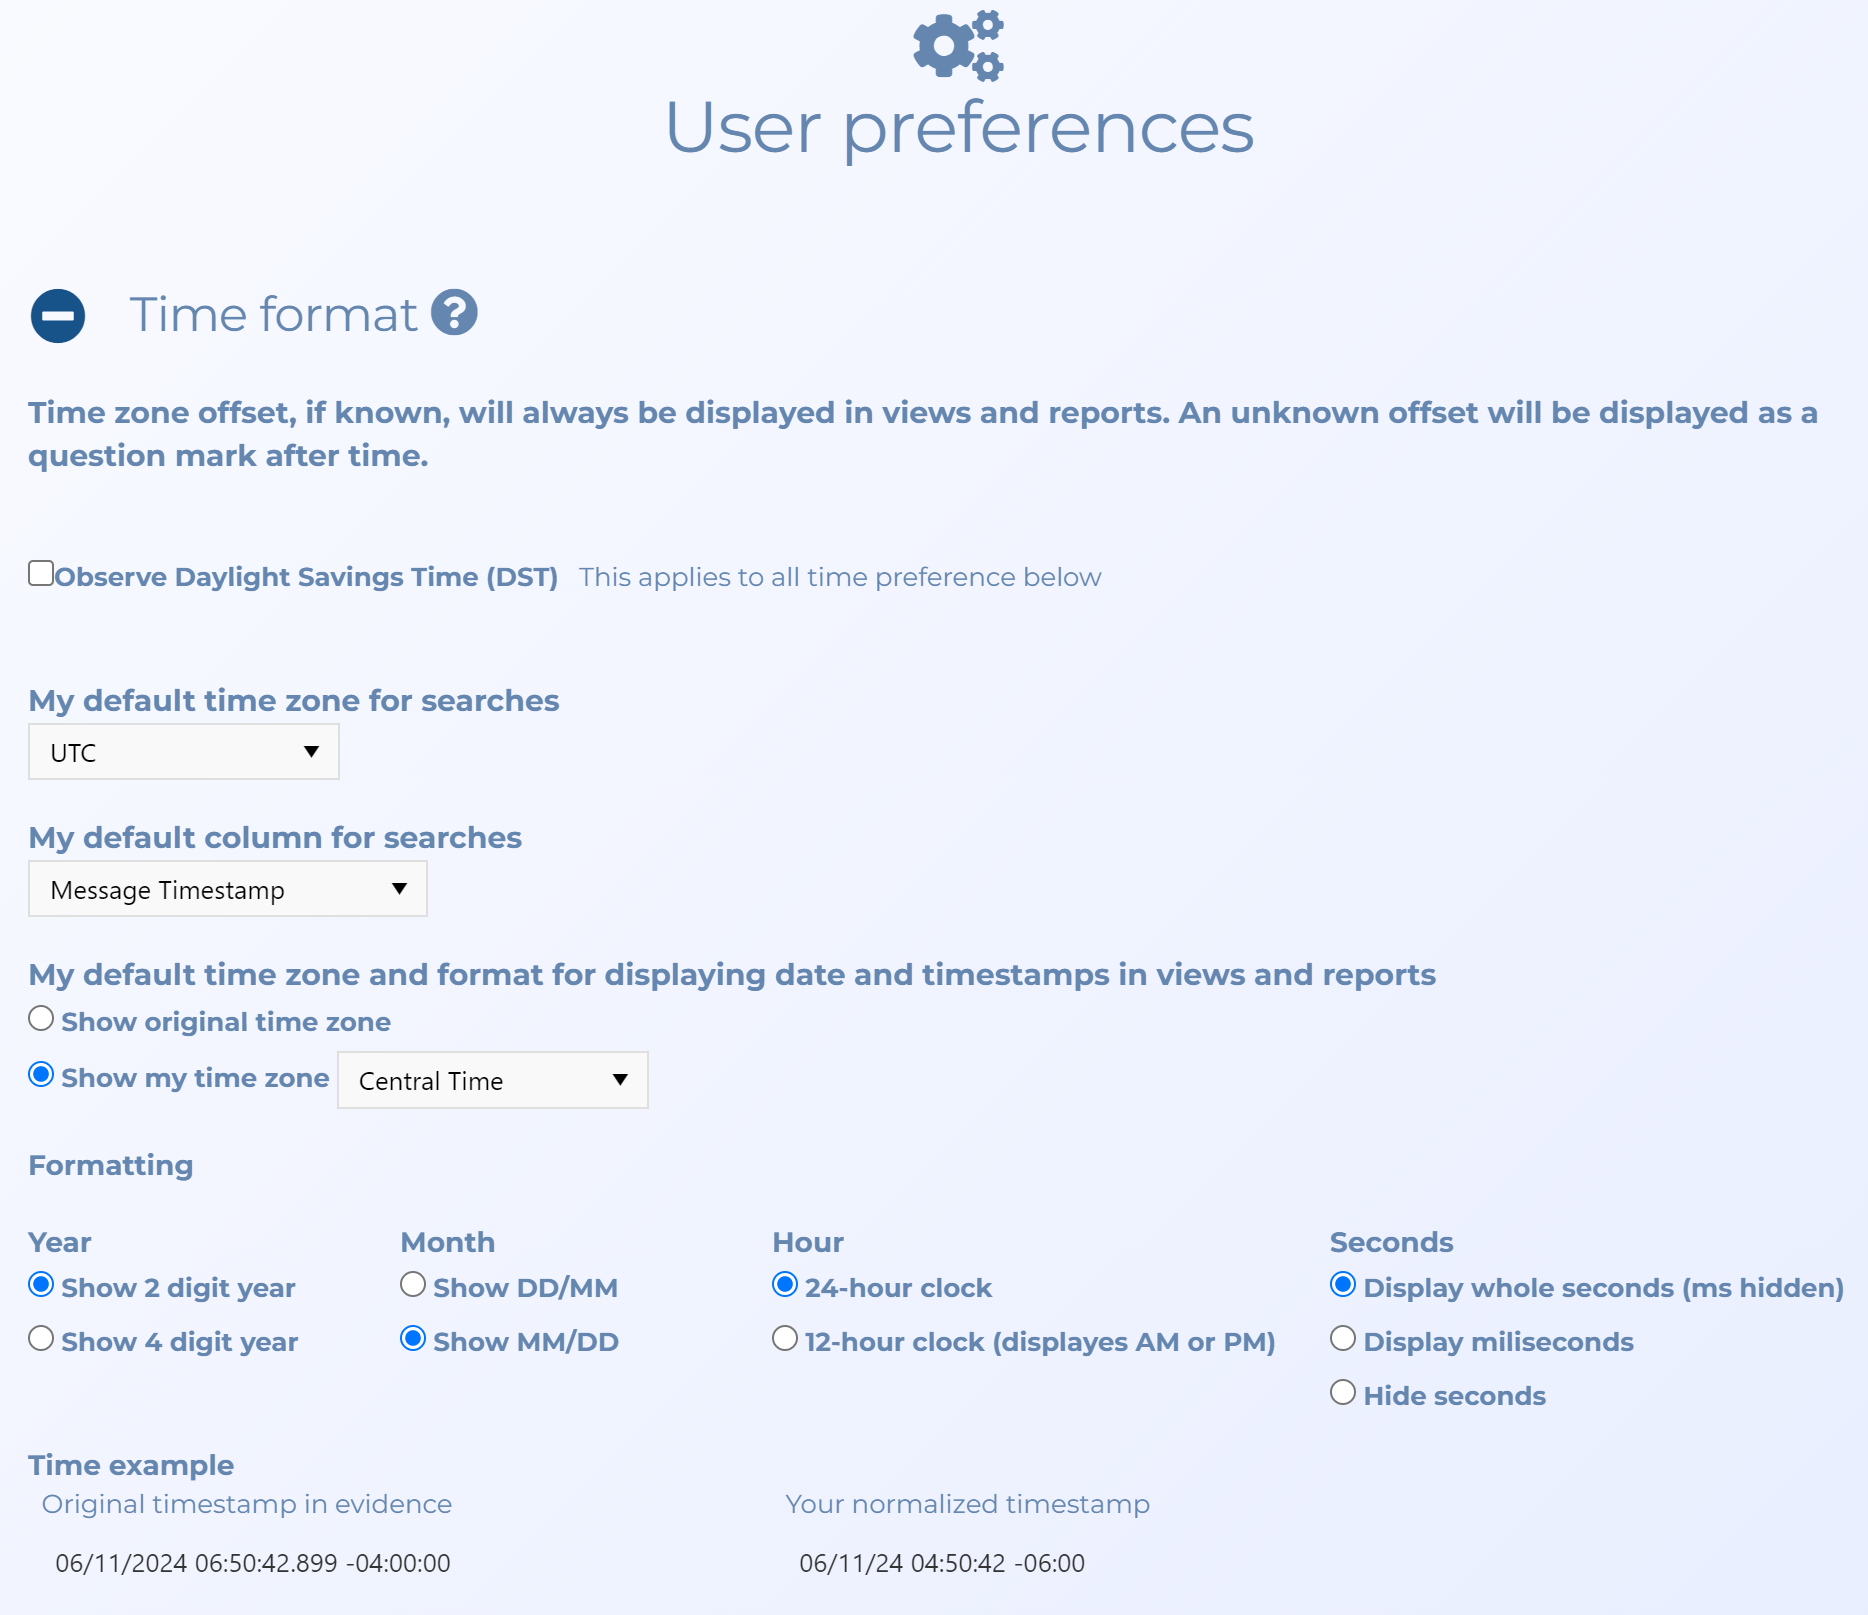
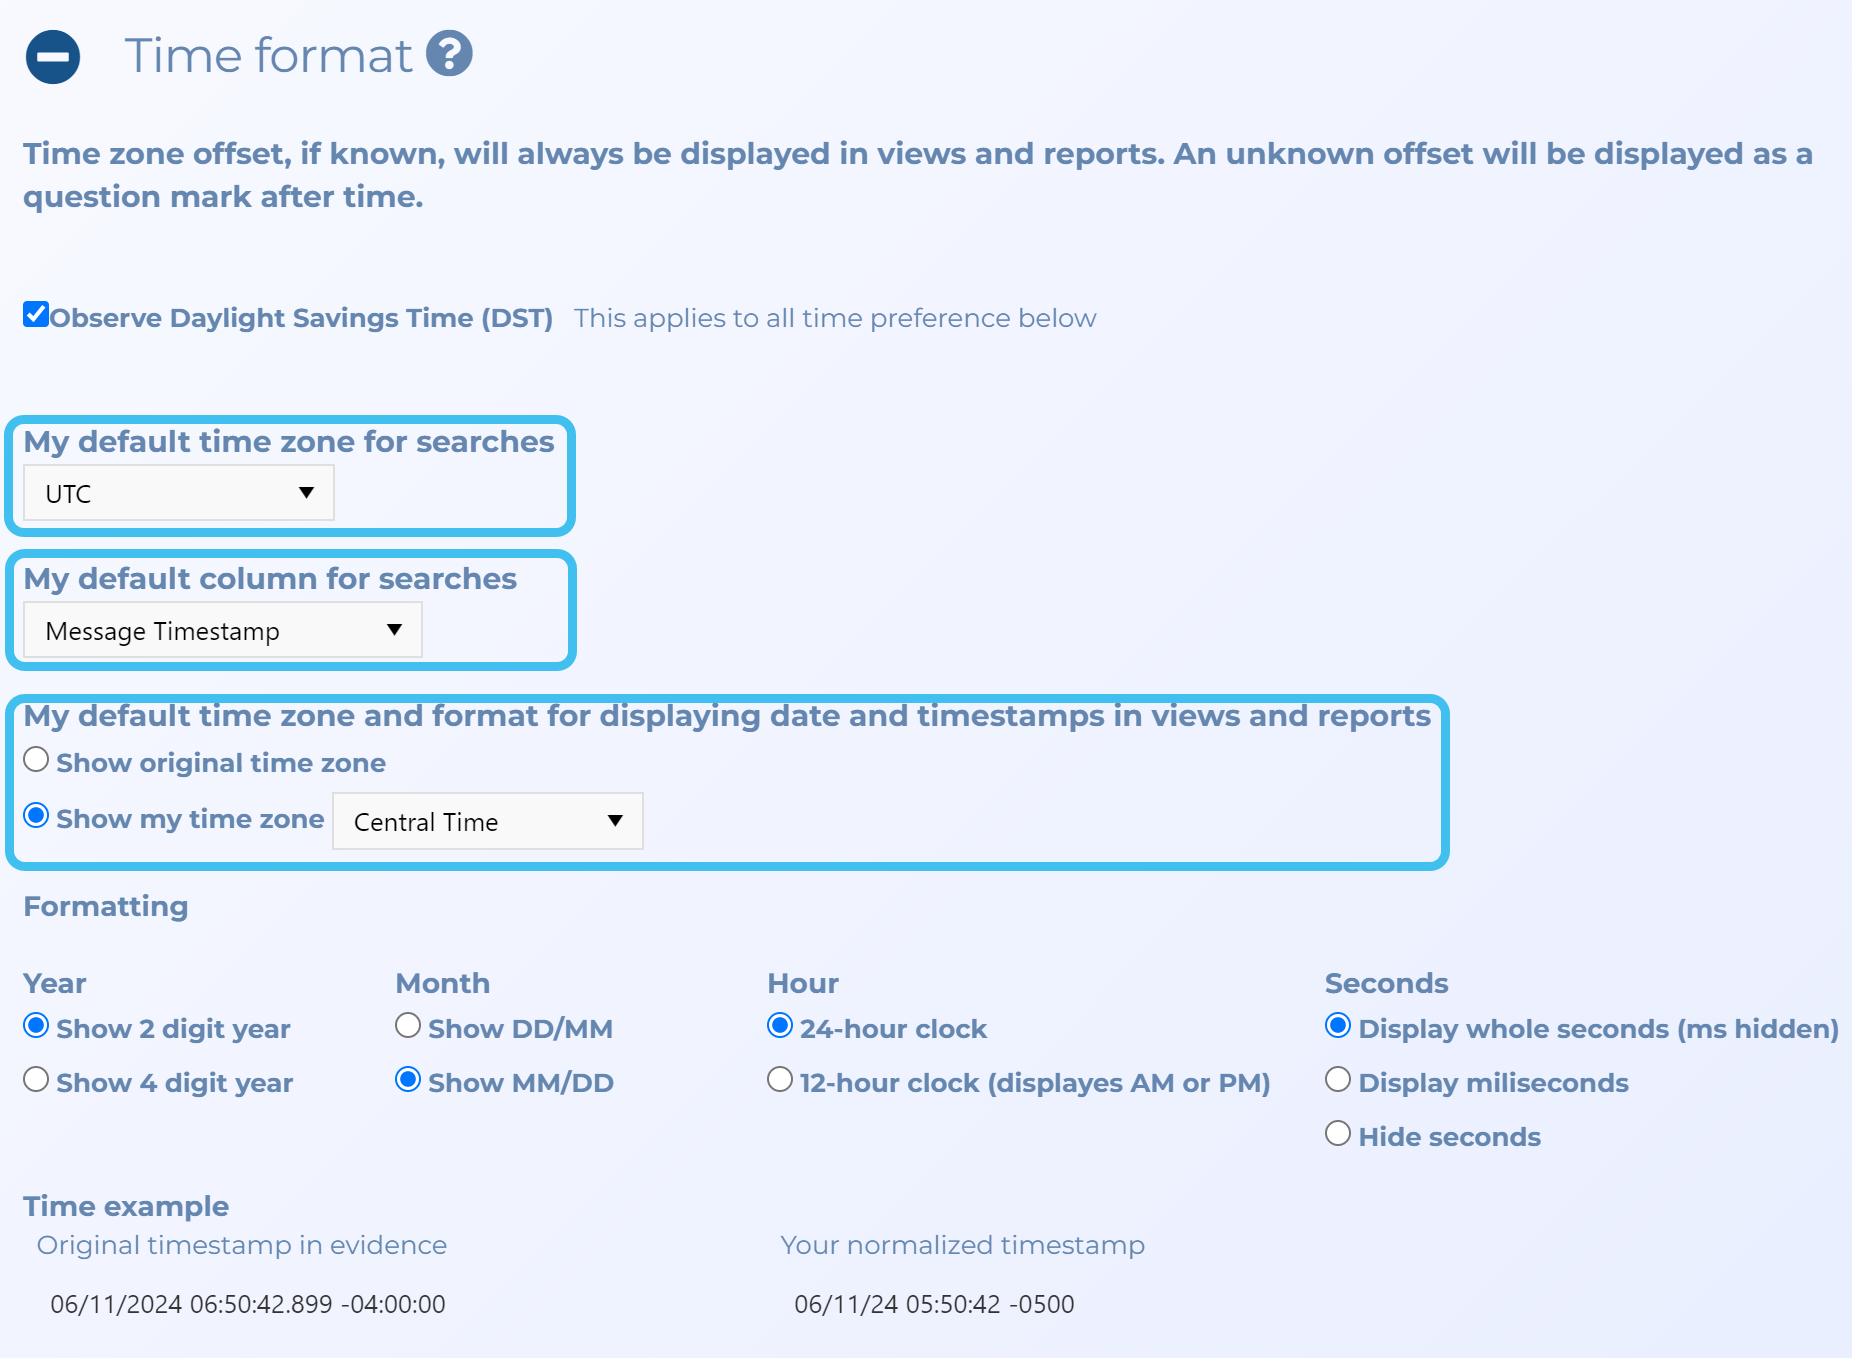
In most instances you will want Observe Daylight Savings Time (DST) selected. You should also verify that you have your preferred settings for My default time zone for searches, My default column for searches and My default time zone and format for displaying date and timestamps in views and reports.
To set the time format you want displayed, select from the available options for the year, month, hour and seconds. The example displayed in Your normalized timestamp displays the current option timestamp you have selected.
This topic details how to use the Frequent numbers call analysis on the ESPA analysis center to create a call frequency report. You can also create a frequent number IQ packet report and frequent numbers are also displayed on the Sentinel screen.
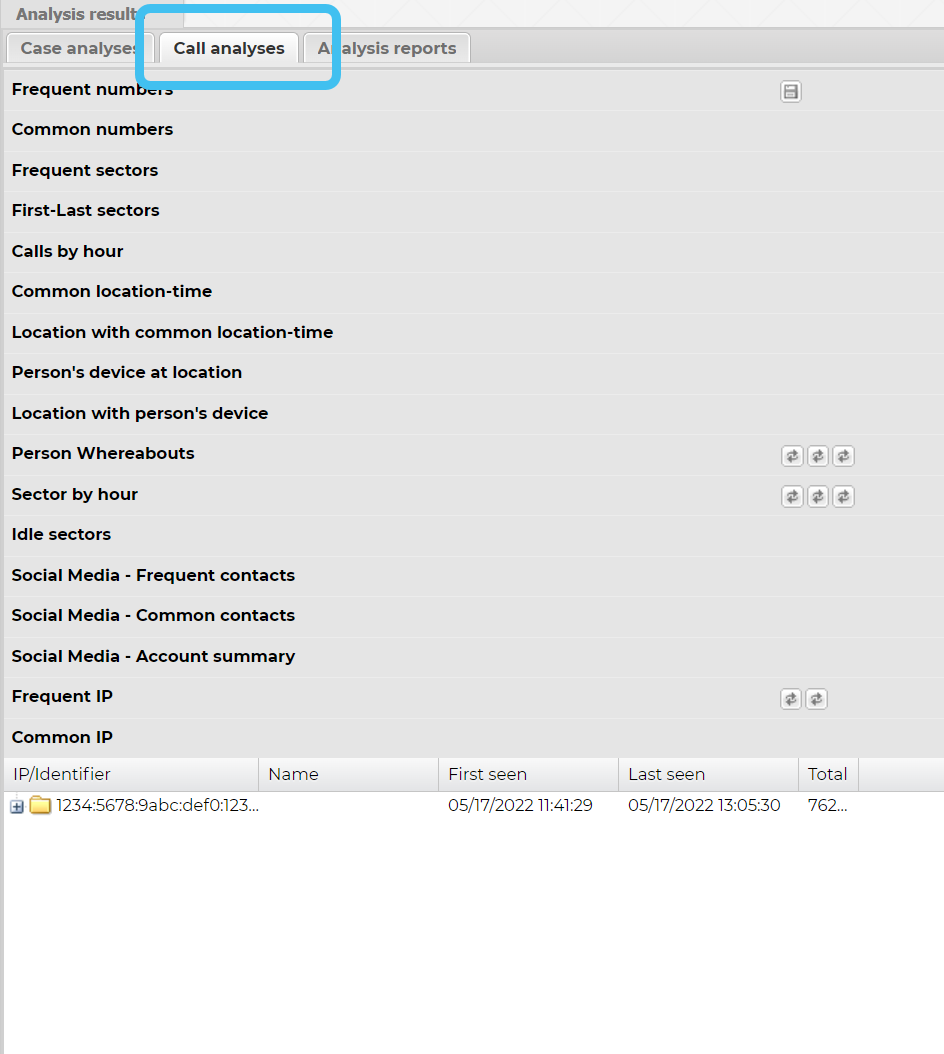
In the Case management view ensure Call analyses is selected.
Click Frequent numbers to expand the list. Note, a before the analysis name indicates that the analysis has been run. If is displayed, you must click it to run the analysis first.
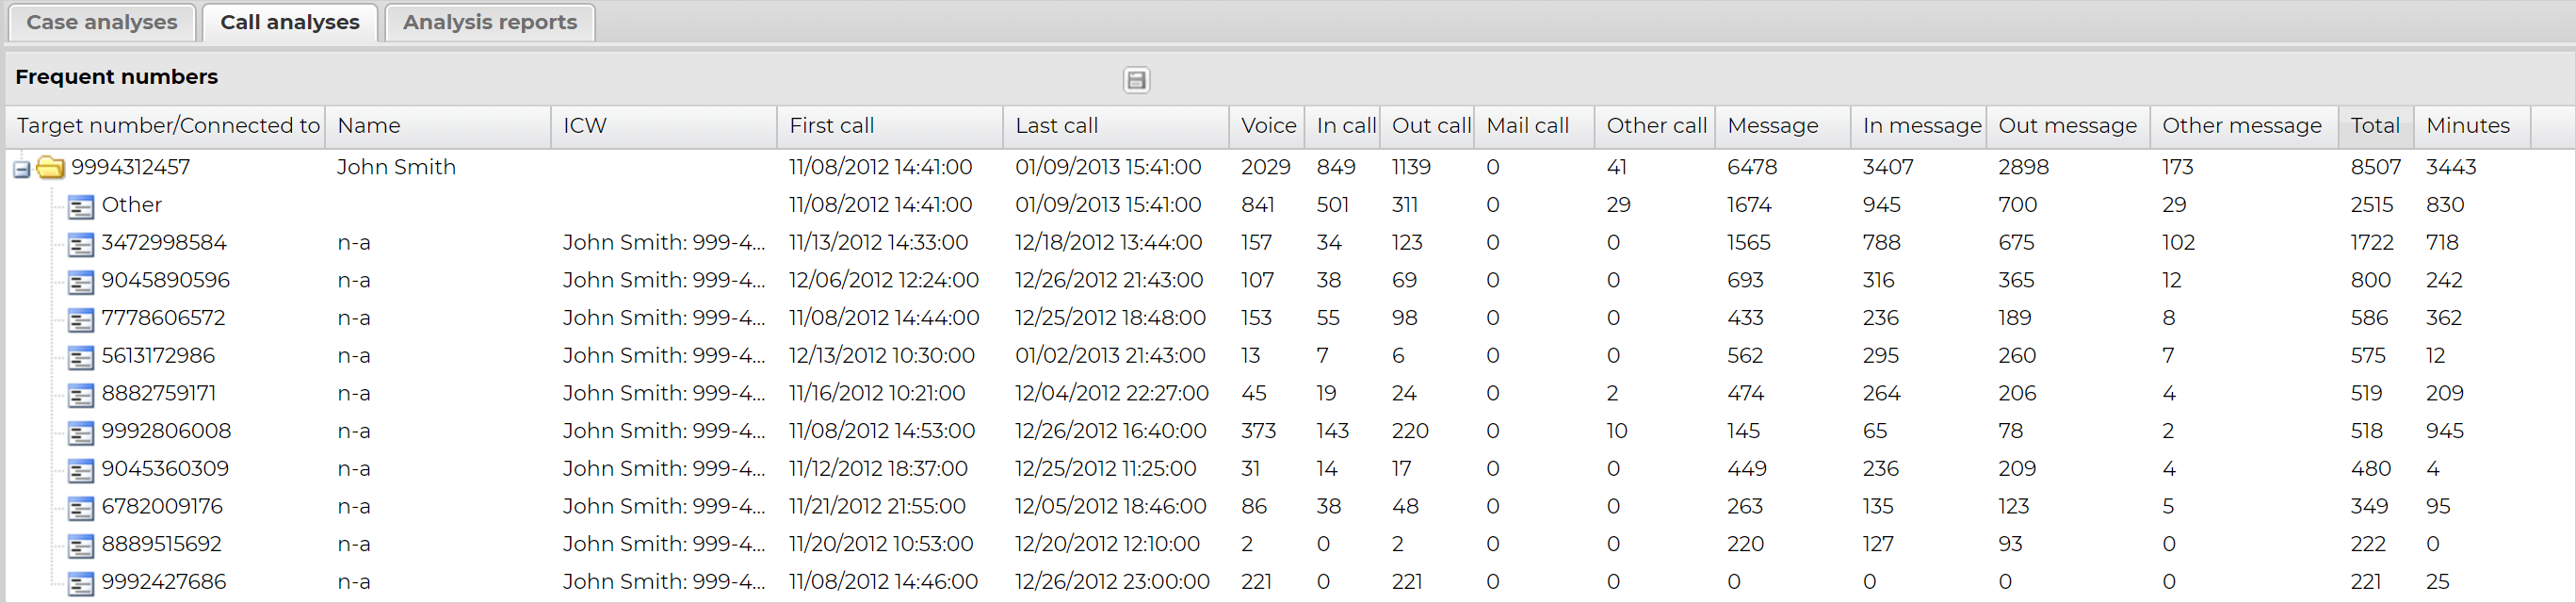
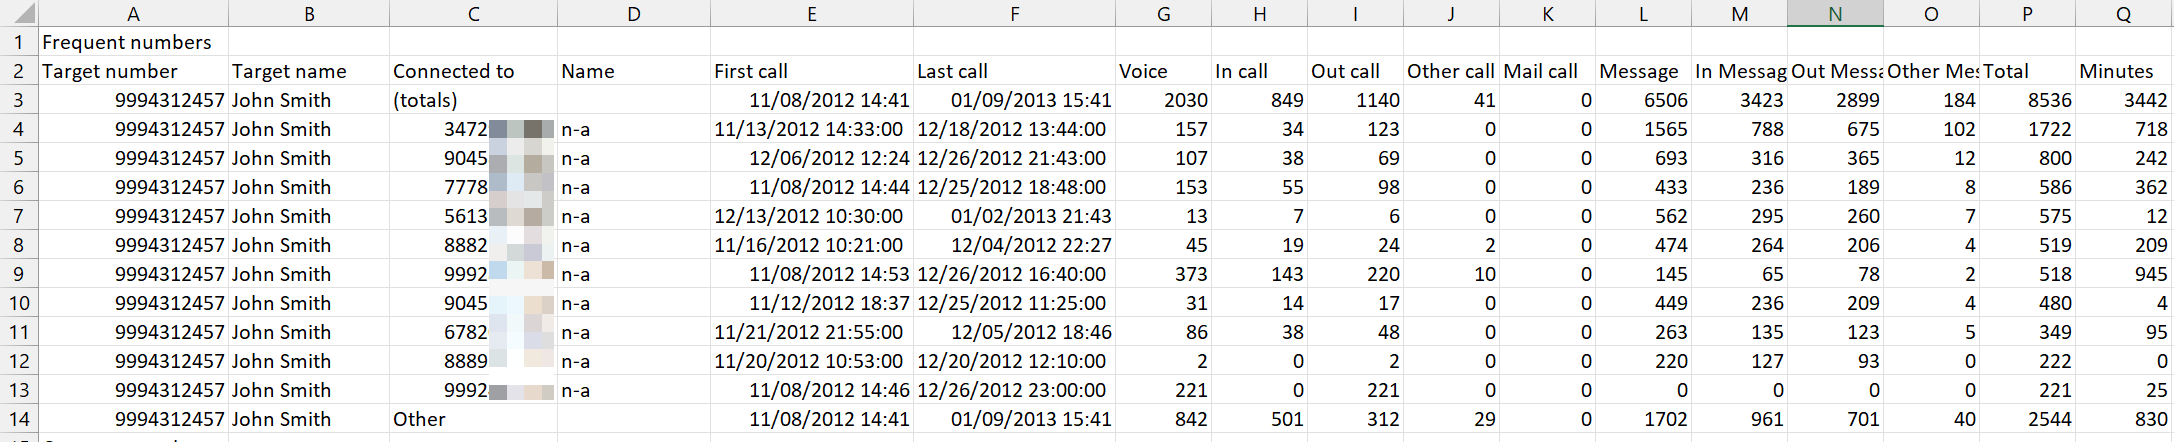
Click beside a target phone number to display the details of the frequently called phone numbers. This allows you to view the top ten most frequently called numbers and the call data. The ICW (in contact with) column allows you to quickly determine if an associate of your target is also an associate of other targets in your OSS-ESPA account. If they are then this column contains a colon-separated list of the other target names or phone numbers.
NOTE: The ICW analysis is not run automatically. If you want to ensure the data in the ICW column is up to date then to view the last time the analysis was run, or to rerun it, open the case's People and devices screen, then in People click to open the Associate settings where the date and time of the last analysis is displayed. Click Run analysis if required.
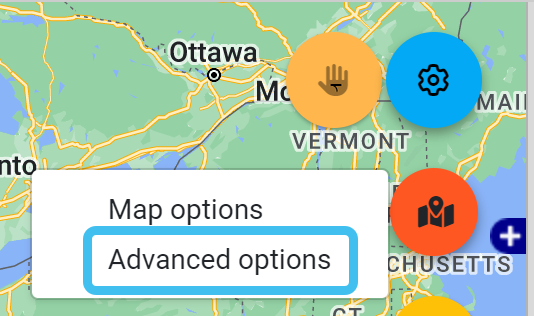
Optionally, if required you can change the number of results displayed from the default of ten by using the Advanced options dialog box. To do this, hover over on the top-right of the map, click and select Advanced options. On the Advanced options dialog box click the Analysis tab. You can either change Items to calculate from 10 or select Check all items to display them all. Using Associate settings you can also define what associate information is displayed in the analysis. You must click Refresh to update any changes on the Call analyses tab.
To run the export either:
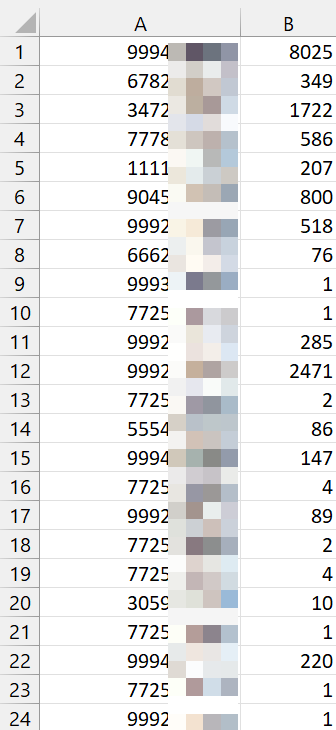
right-click on the map or select then select Export call analysis to csv. You can also select Export phone numbers which exports a csv file with just the unique numbers and the total frequency count.
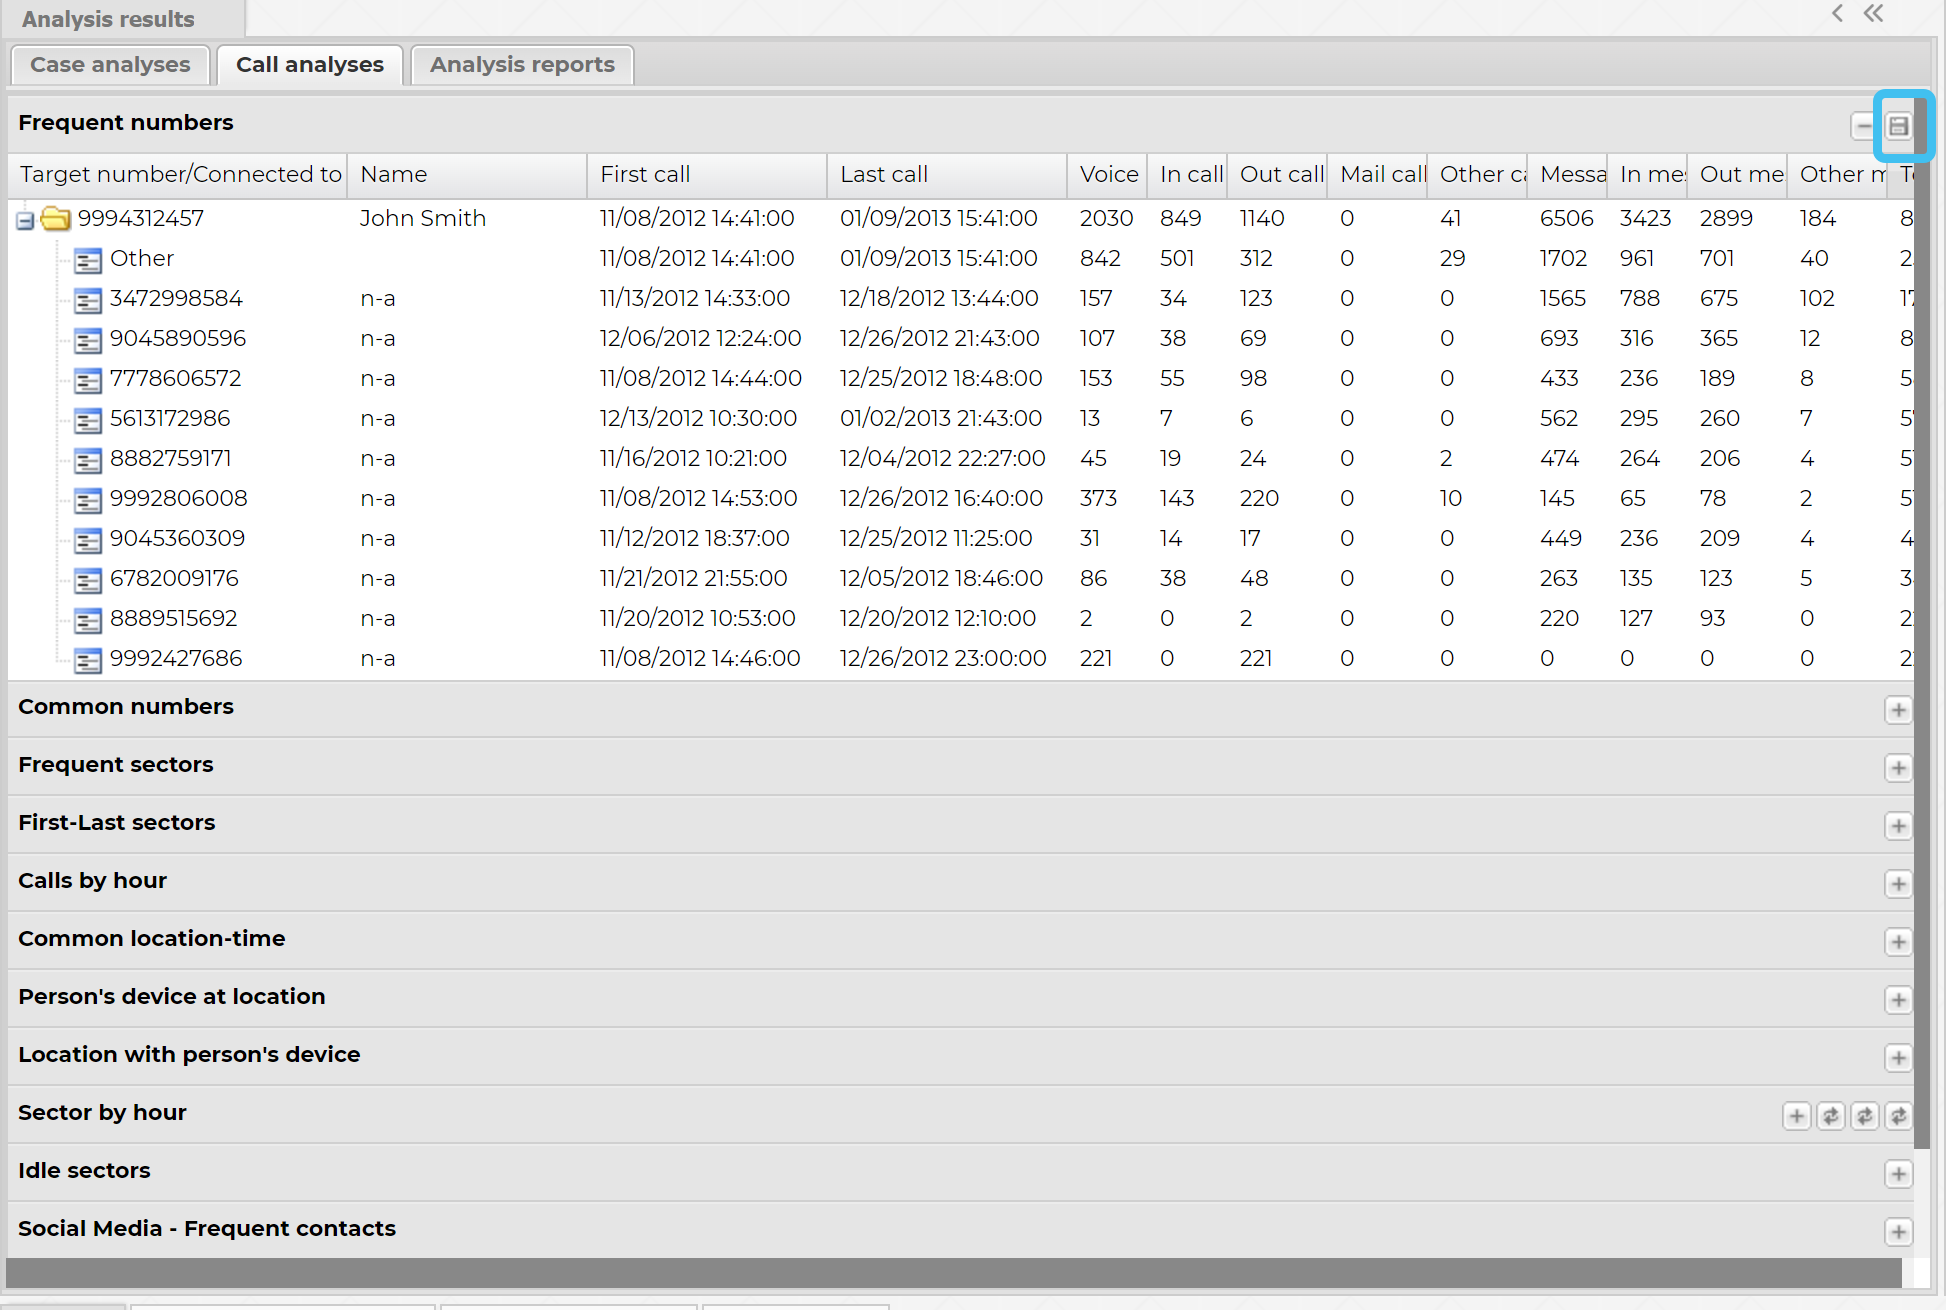
expand the Call analysis tab, then click .
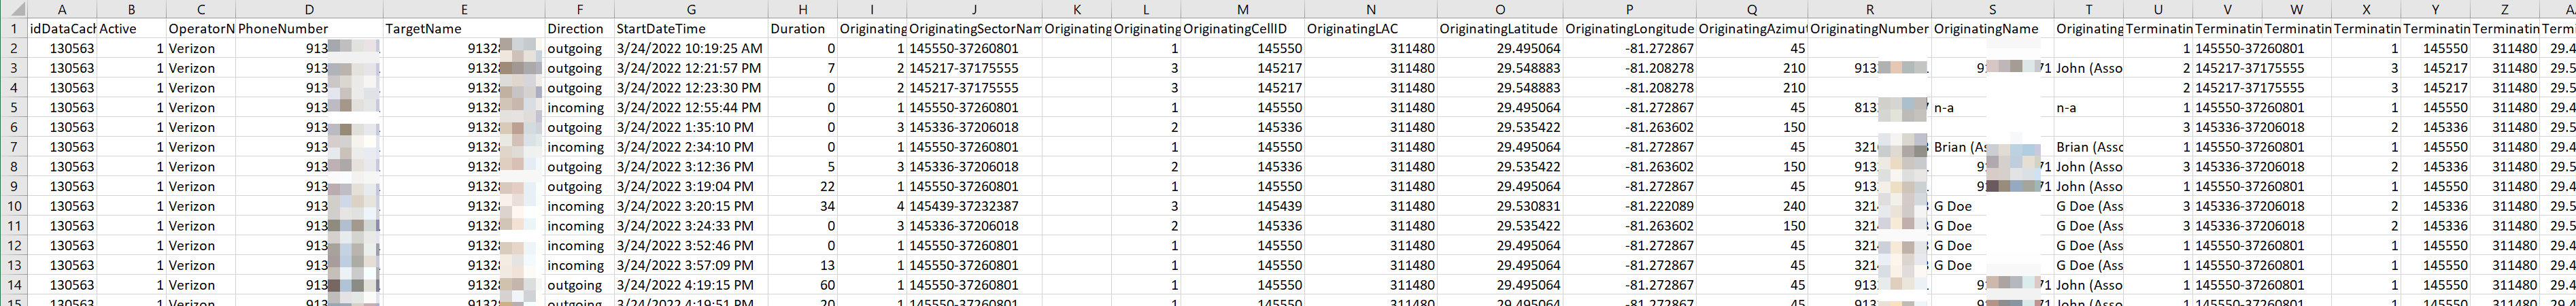
An example csv for an Export call analysis to csv:
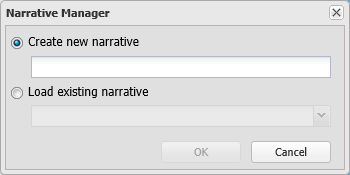
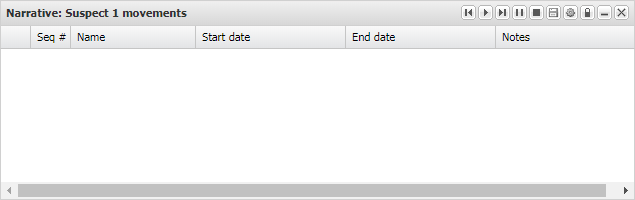
Select Create new narrative, enter the narrative name then click OK. The Narrative dialog box opens.
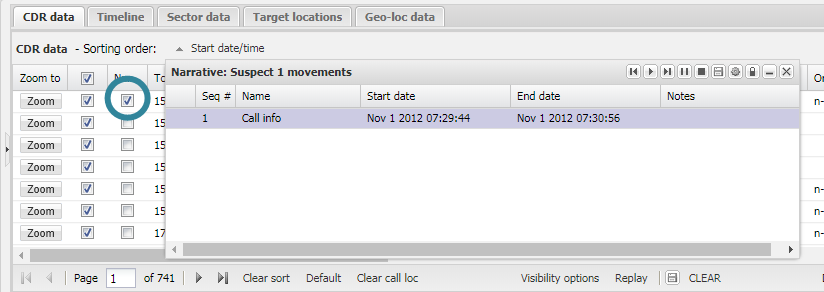
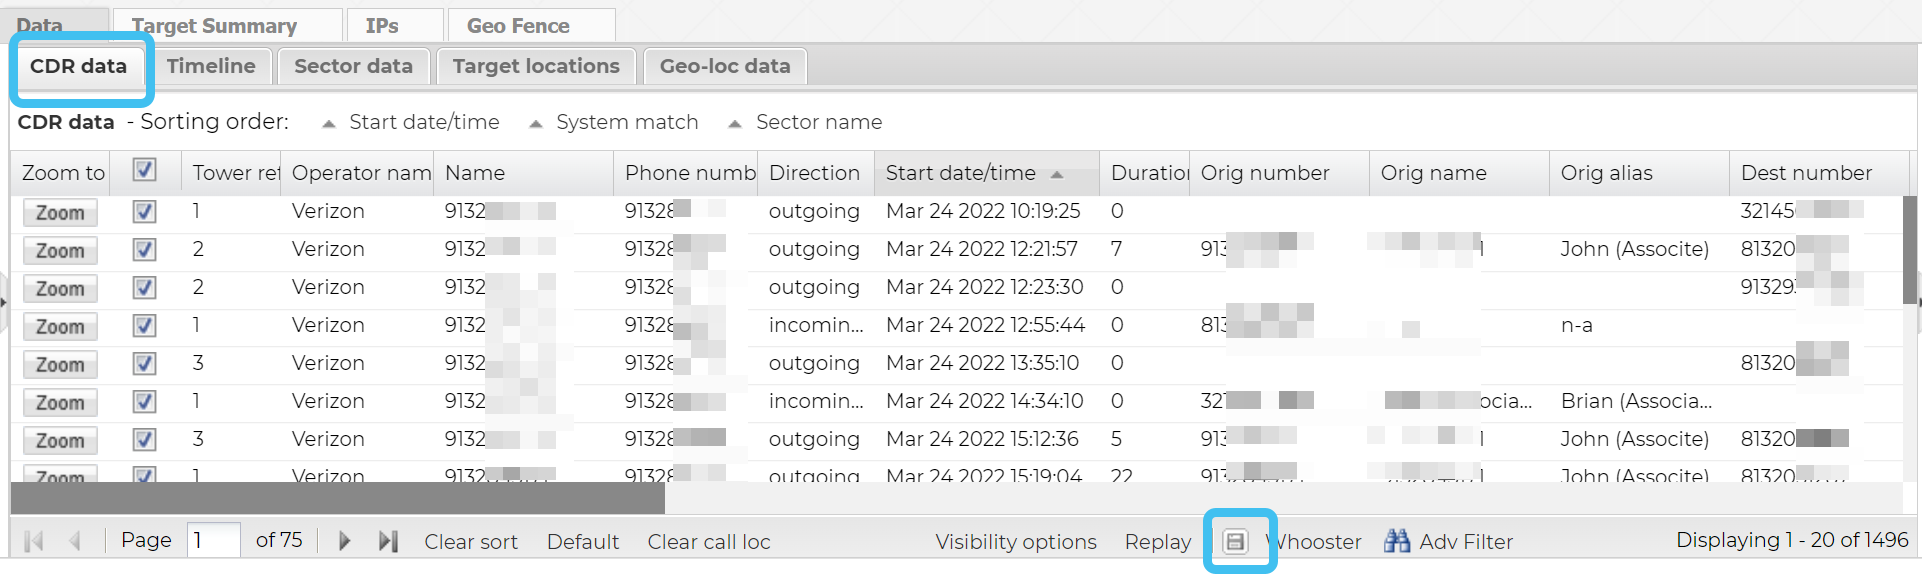
When the Narrative dialog box is open a Nar column is displayed on the following Data view tabs: CDR data, Timeline, Sector data, Target locations and Geo-loc data. To add an event from these tabs to the Narrative dialog box simply select the event in the Nar column.
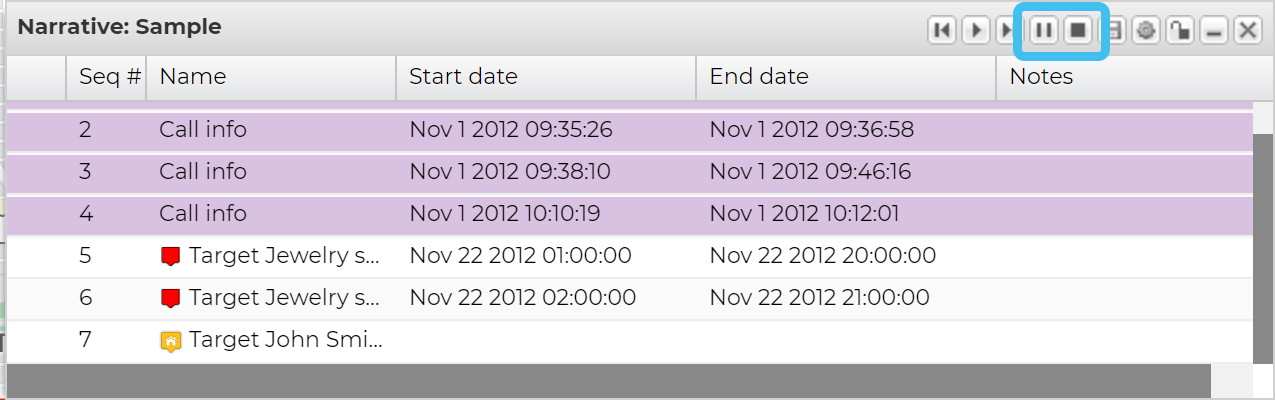
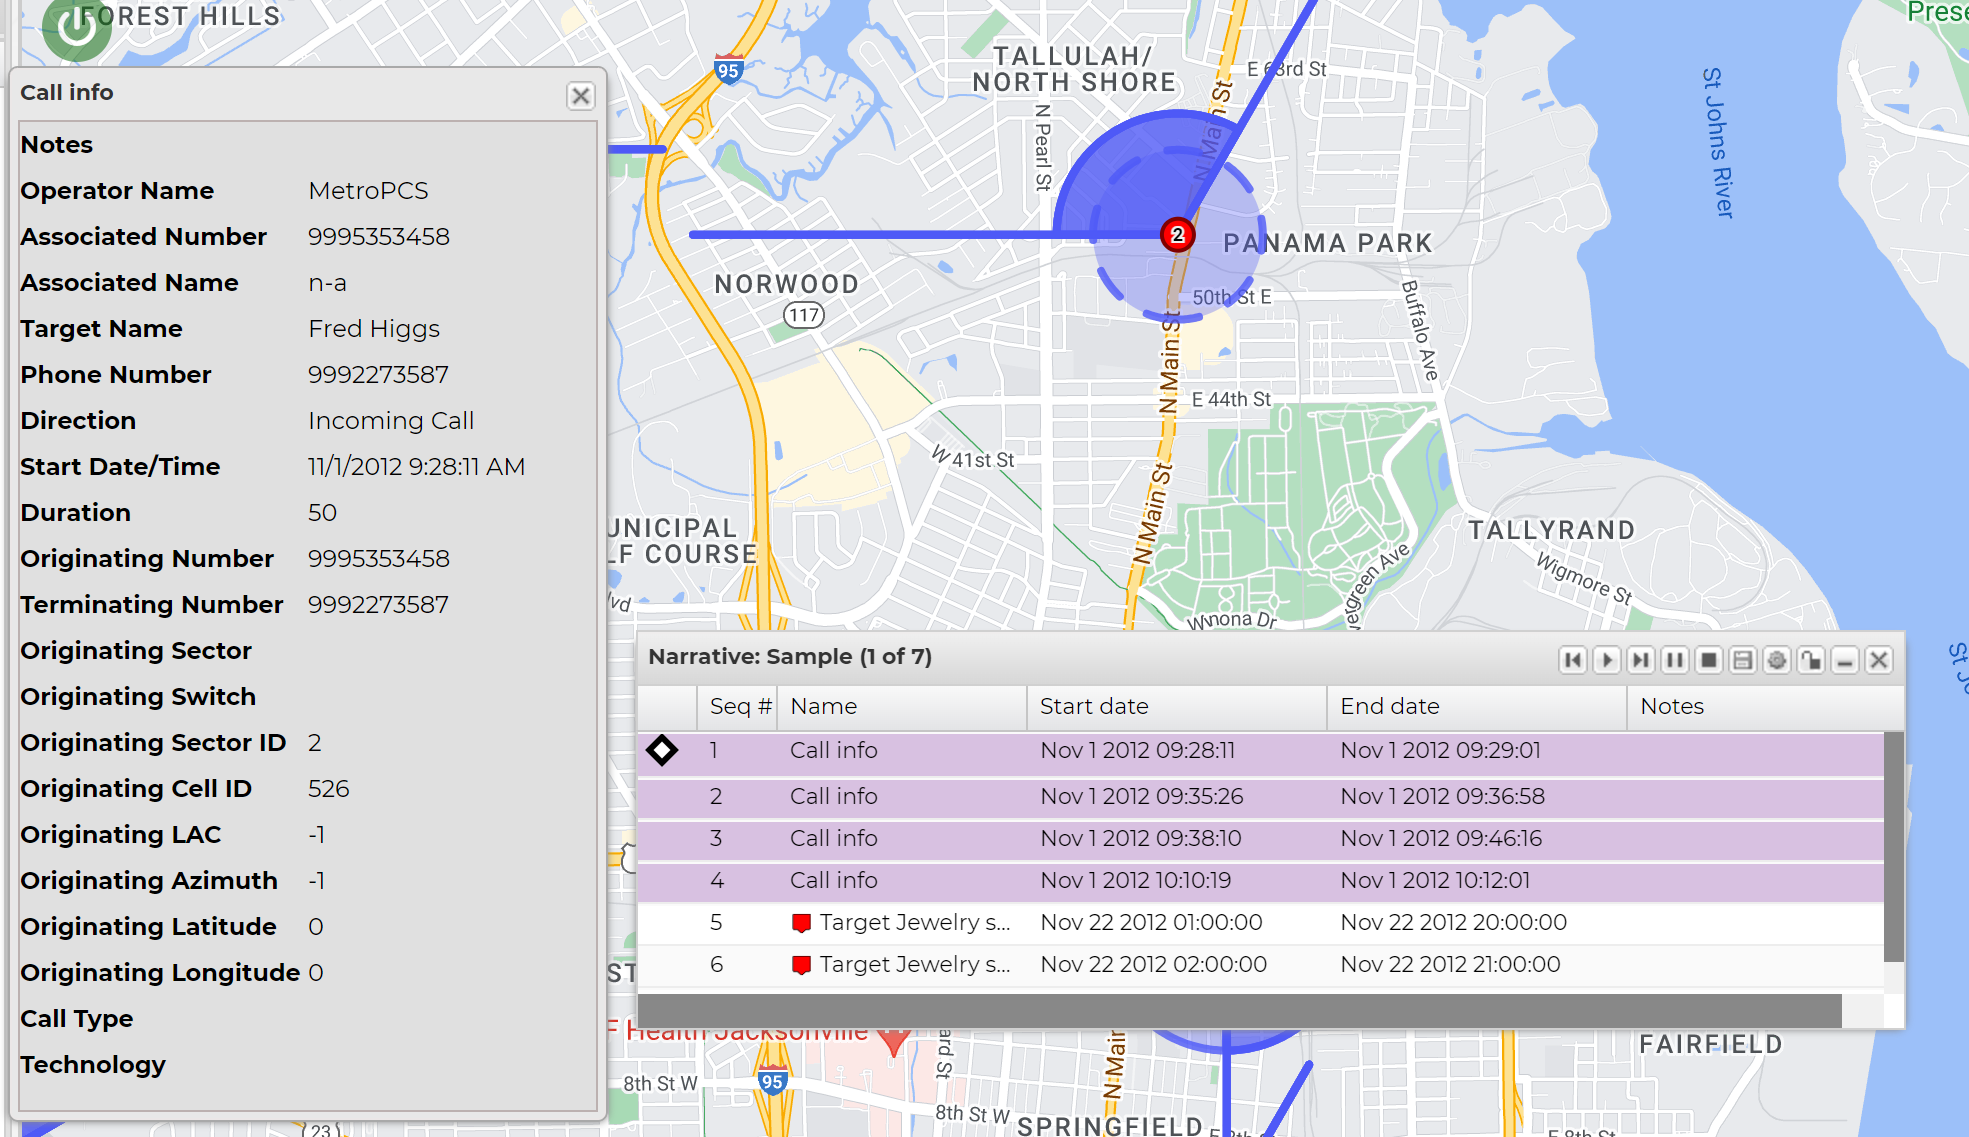
Click to start the automatic replay of the events. The narrative details for each event are then displayed on the map one by one. You can tell which event is being played as it is displayed in bold text.
You can pause or stop the replay at any time by clicking and respectively.
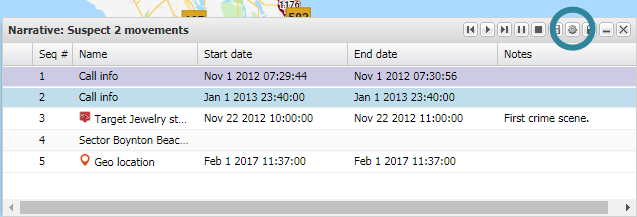
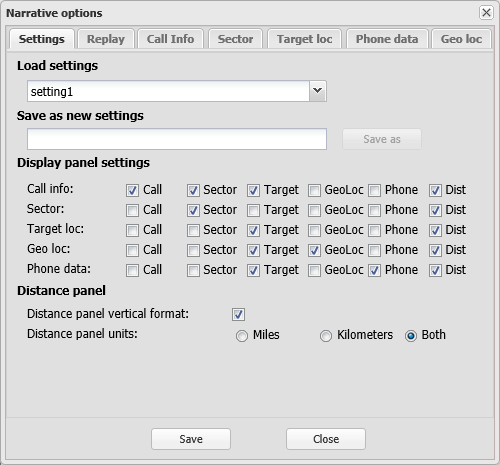
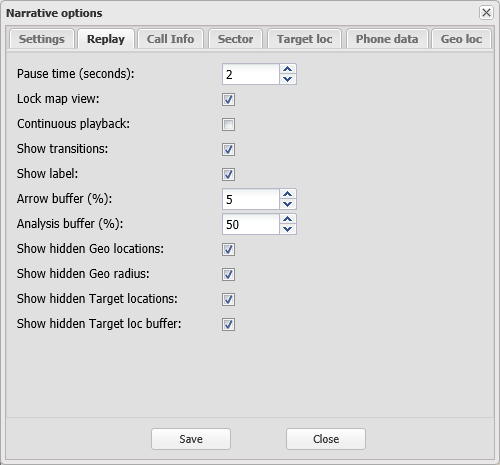
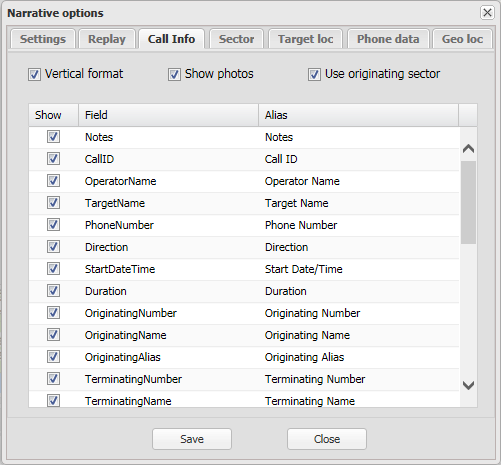
If required you can configure the narrative options. To do this, on the Narrative dialog box click .
The Narrative options dialog box opens.
The following graphic shows an example of the narrative playing.
Creating and analyzing a historical analysis case example
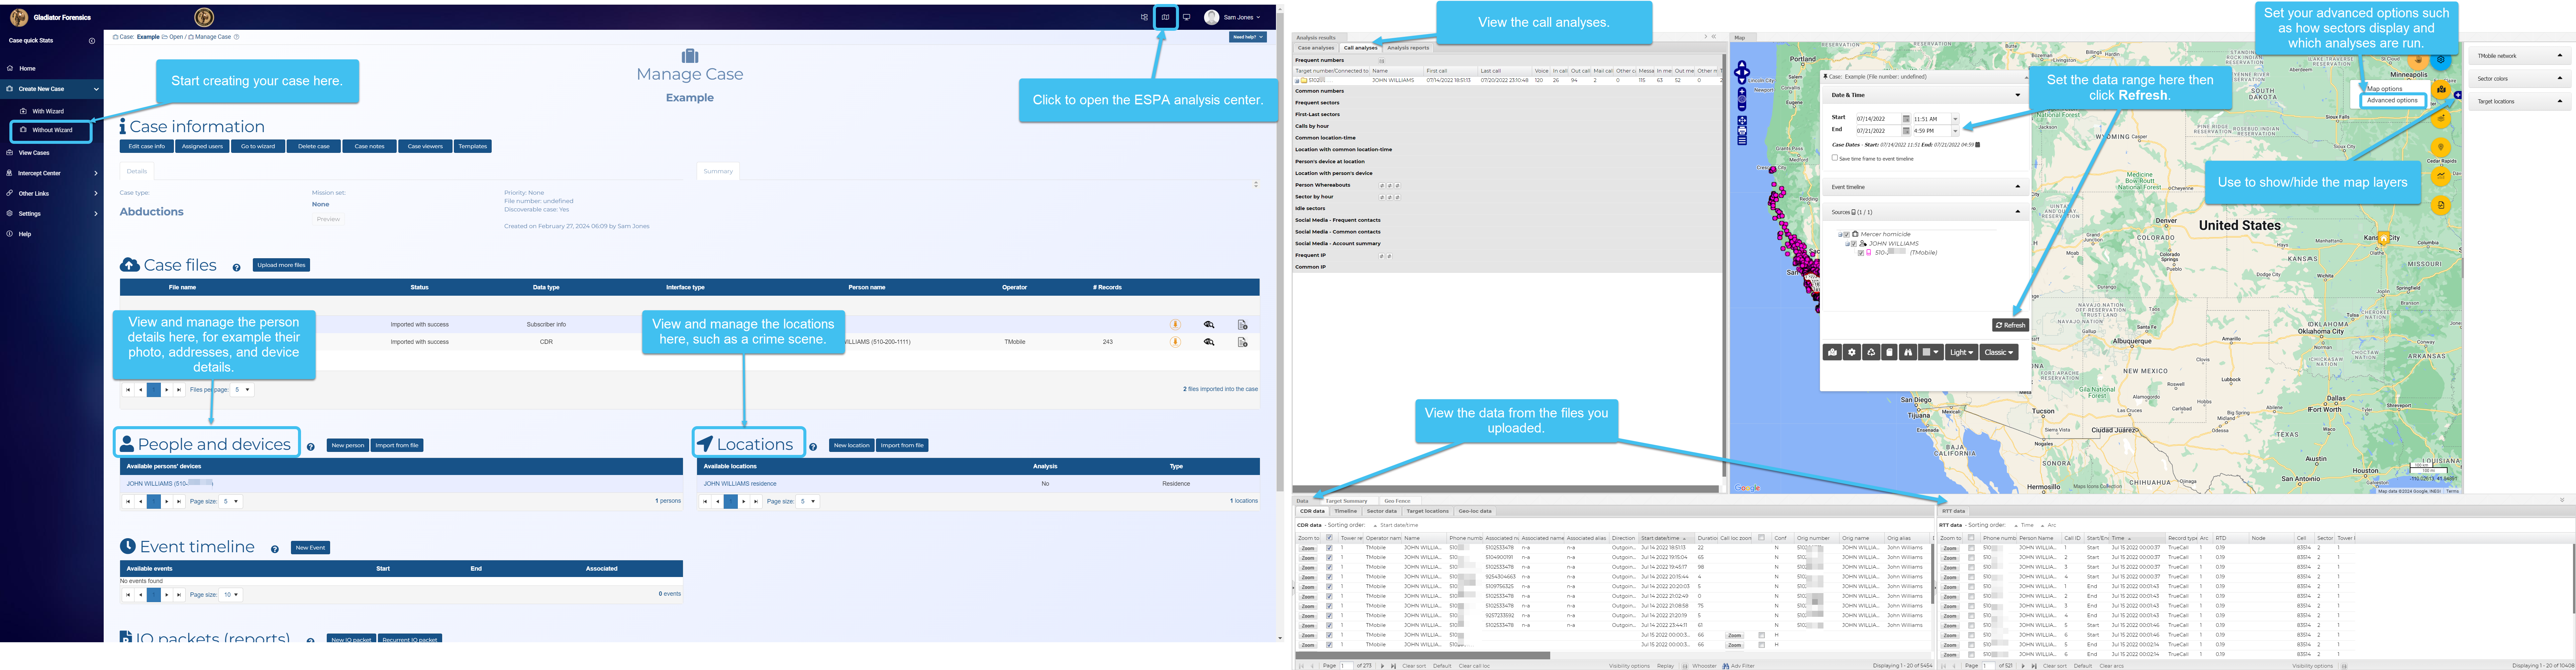
This topic is intended as a getting started example of how to create a case and view it on the ESPA analysis center and is a good place to start if you are just getting started using OSS-ESPA for a historical analysis.
To create a case, from the main menu click Create new case, Without wizard then complete the required case details. You can then upload your files and ensure the correct persons and locations are in your case. To analyze your case open the ESPA analysis center by clicking , select the required data range then click Refresh. You can now use the Data view, Case management view and the Map view to analyze the case. For further information click the link below.
You can also click here for a short video showing how to create and analyze a historical case.
How do I create and analyze geo-fence and tower dump cases?
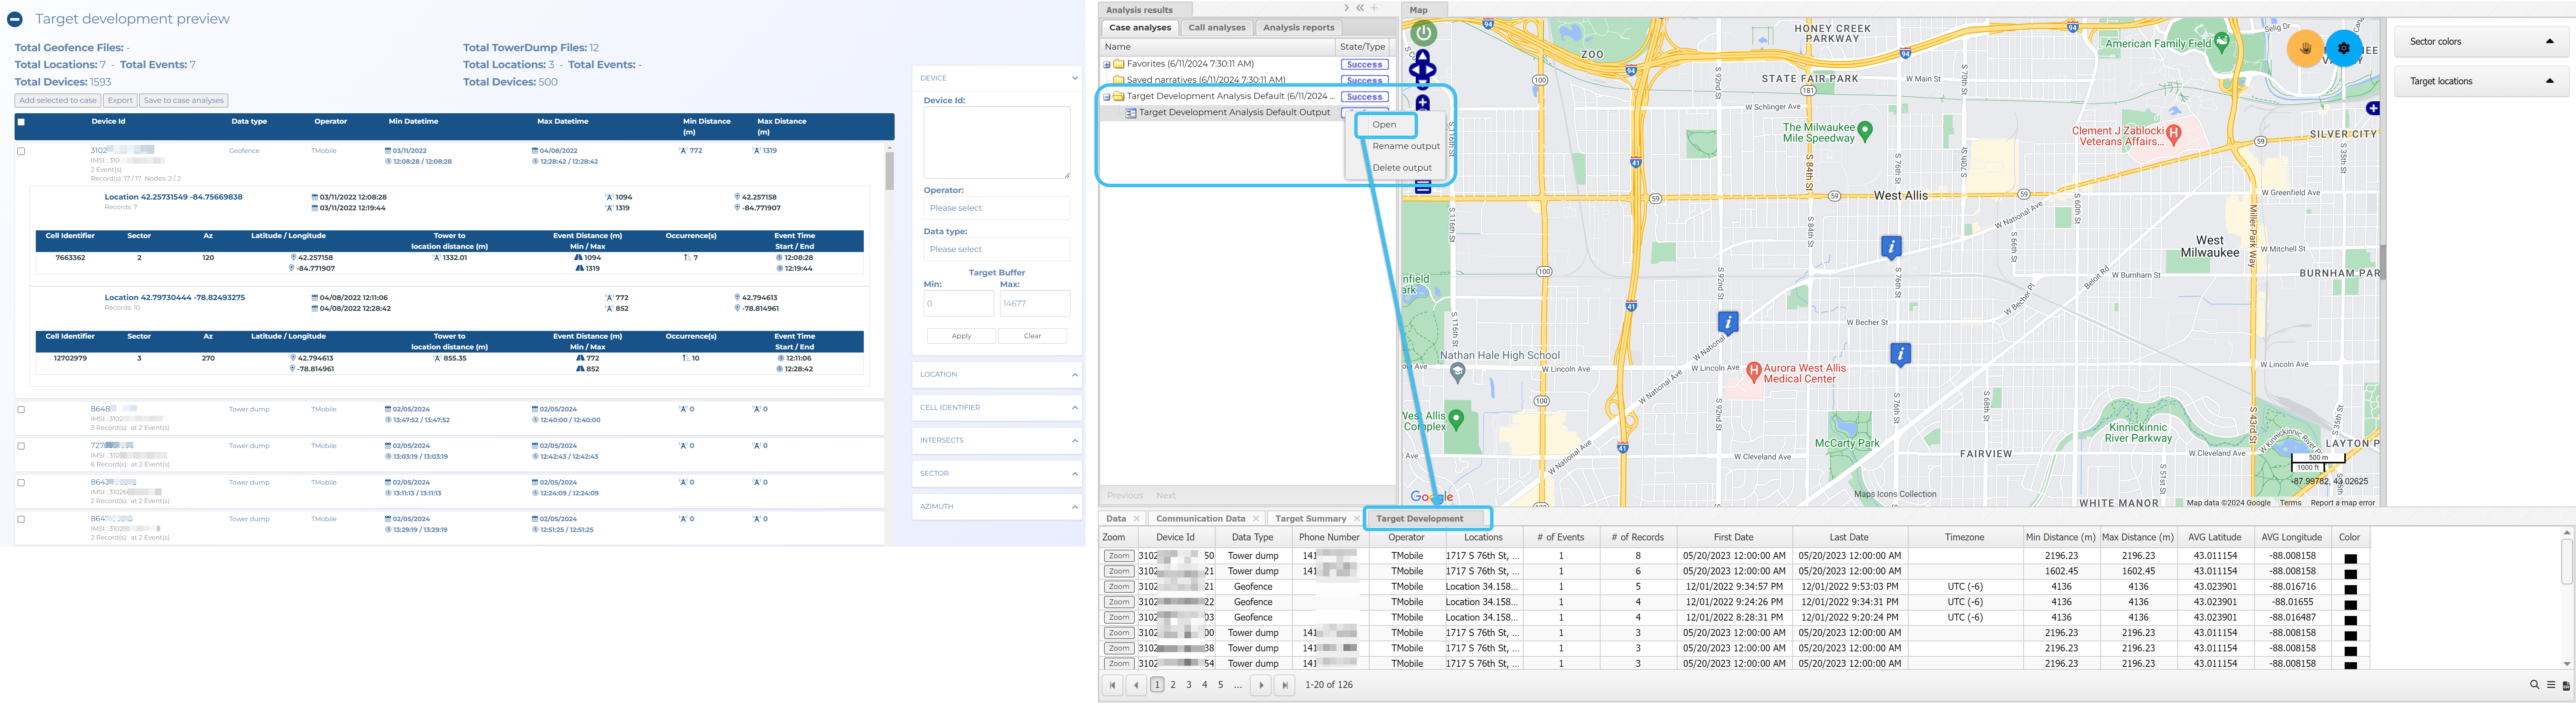
Creating and analyzing geofence and tower dump cases
You can create and analyze geofence and tower dump files using the Manage file screen's Target development preview tab and the Target development view on the ESPA analysis center.
../Managing Cases in IQ/iqCreatingAndAnalyzingGeoFenceCases.htm#microcontent1
How do I cross reference CDR cell site location data with the associated tower list?
Cross referencing CDR cell site location data with the associated tower list
This topic describes how to cross reference cell site location data with the associated data in the tower list.
The following example uses a T-Mobile CDR file but the process is the same for all operators.
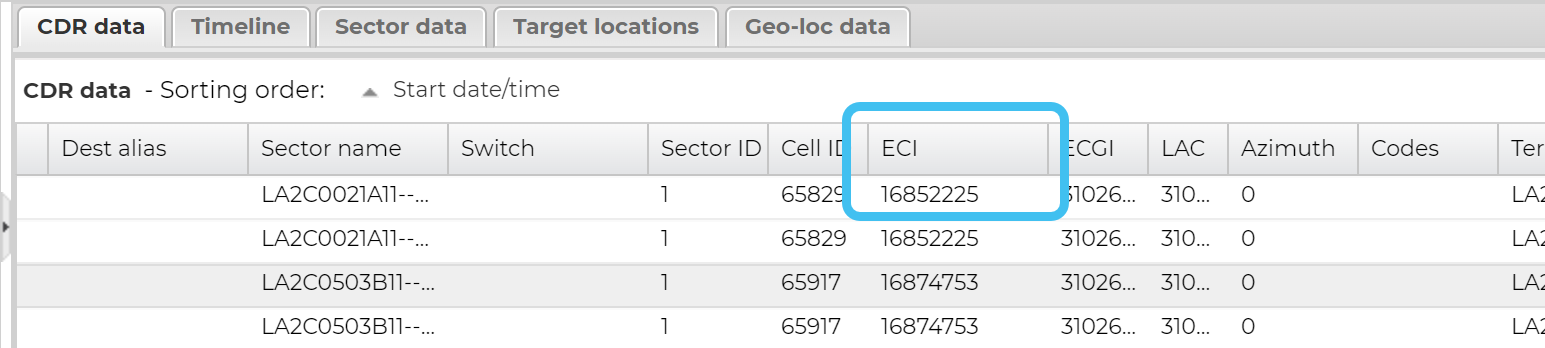
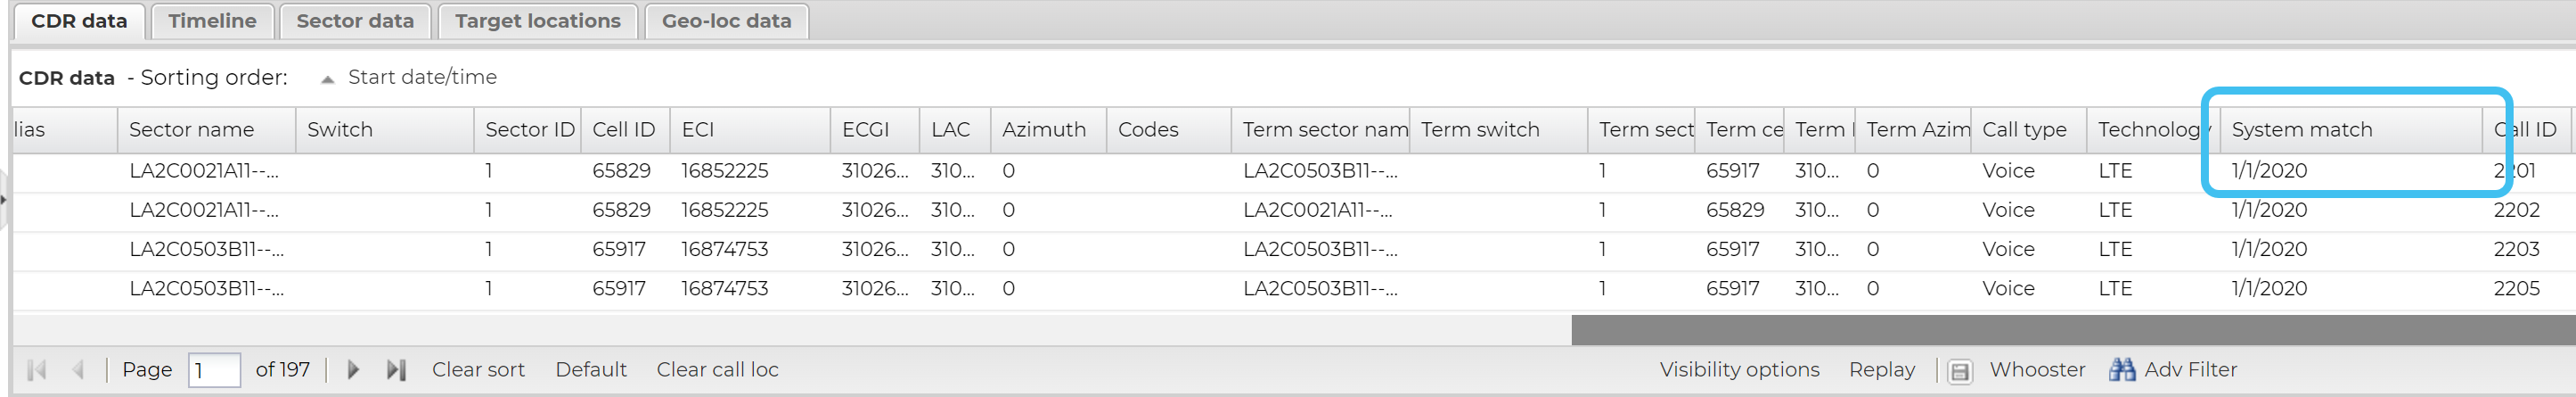
On the CDR data tab's ECI column, note the ECI (E-UTRAN Cell Identifier) value for the call of interest. The ECI is what is used to uniquely identify a cell.
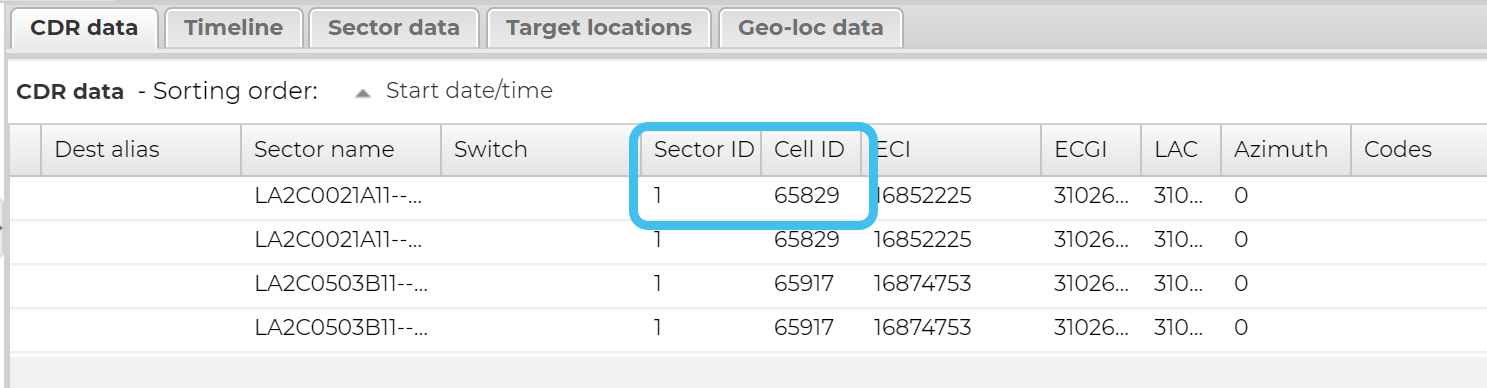
In the above example the ECI is displayed in the ECI column as 16852225 . However, if there is no value displayed in the ECI column then you can calculate the ECI value using the values displayed in the Cell ID and Sector ID columns using the following calculation:
ECI = (Cell ID x 256) + Sector ID
In the example the Cell ID is 65829, and the Sector ID is 1, so the calculation is:
(65829 x 256) + 1 = 16852225, the same as that shown in this example in the ECI column.
On the CDR data tab's System match column, note the cell tower file used for the correlation. In the following example it is the 1/1/20 T-Mobile cell tower list.
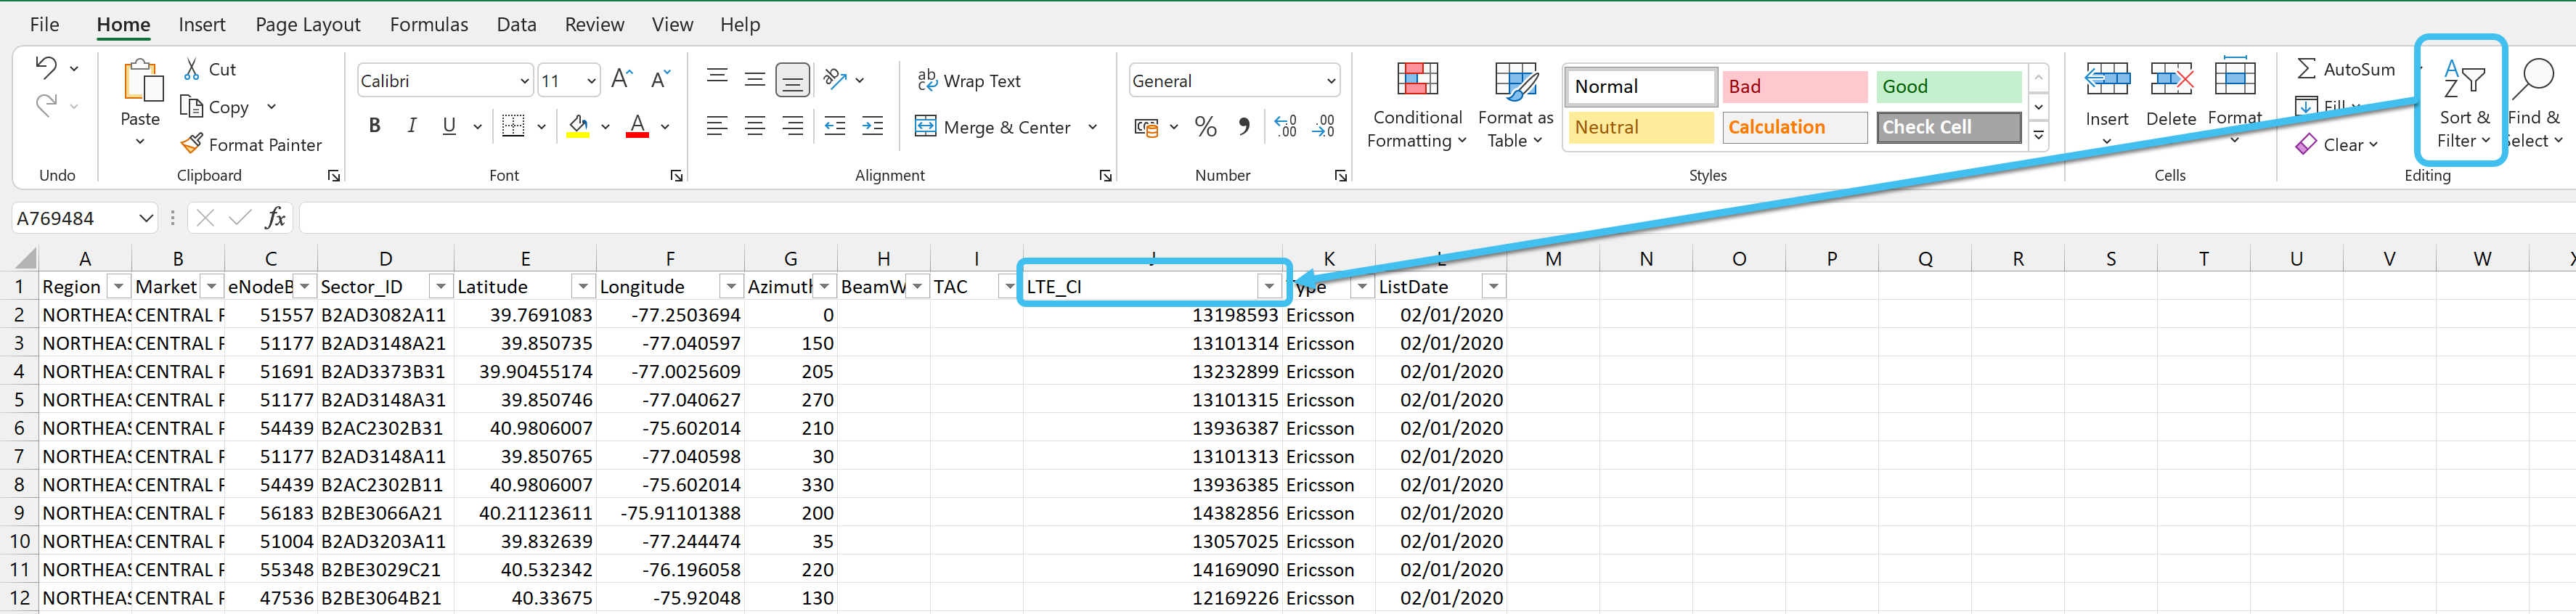
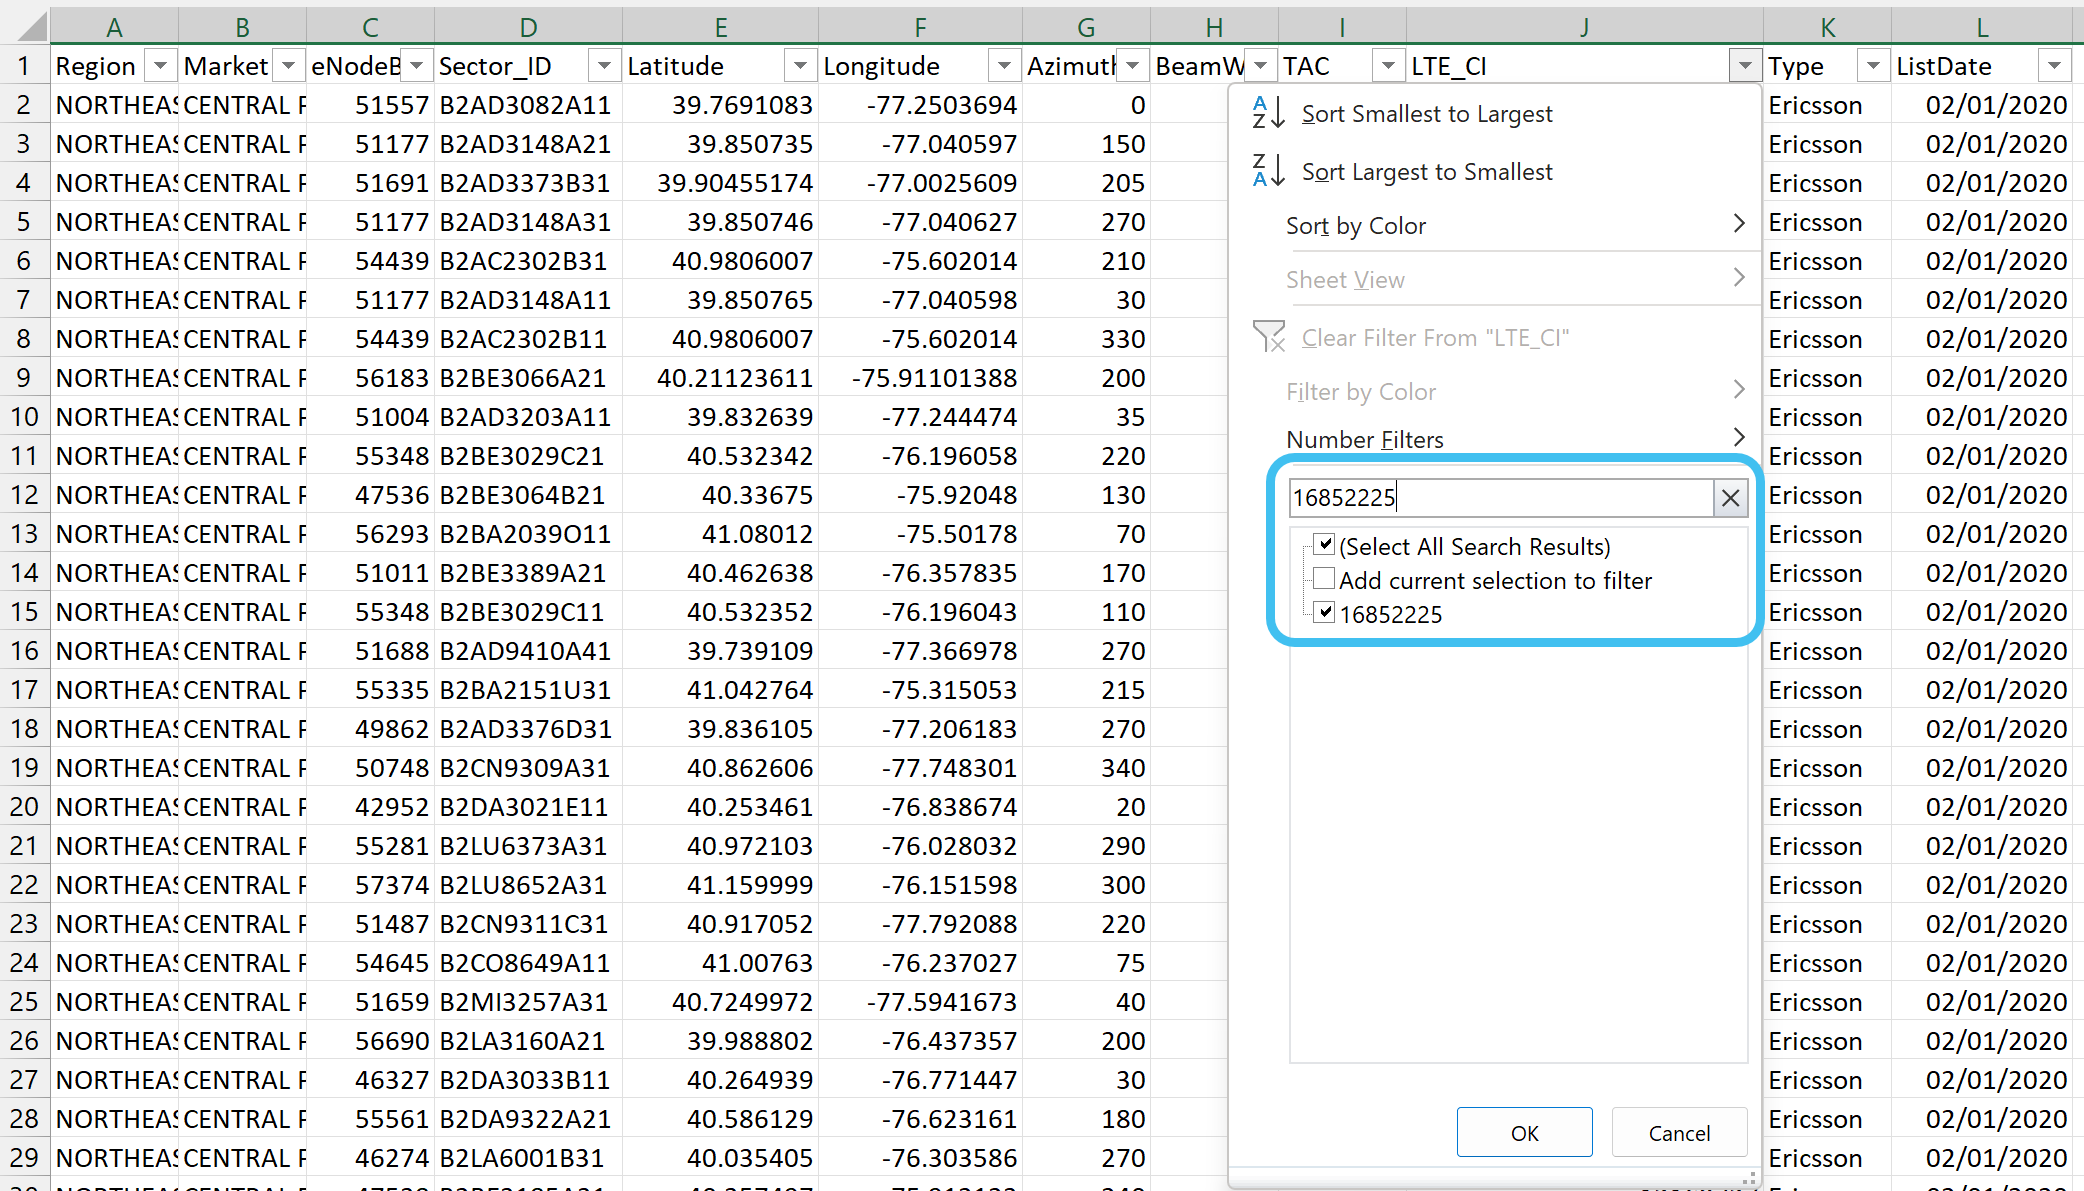
Open the correlating cell tower list in Excel, then apply a filter to the top row.
In the LTE_CI column, search for then filter on the ECI value of interest.
The cell information for the call of interest is displayed.
How do I export to Google Earth and Google Earth Timeline?
Exporting to Google Earth and Google Earth timeline
There are two different Google Earth exports you can select. The Export timeline to Google Earth is more advanced as it exports the currently selected map layers to a KML format that you can then use in Google Earth. The same layers are exported as with Export map to Google Earth, however this export places the data into a timeline folder which allows you to adjust the timeline slider in Google Earth to display all the activity during a specific time-frame.
You can also click here for a short video showing how to export to Google Earth.
On the ESPA analysis center screen, select the data your are interested in.
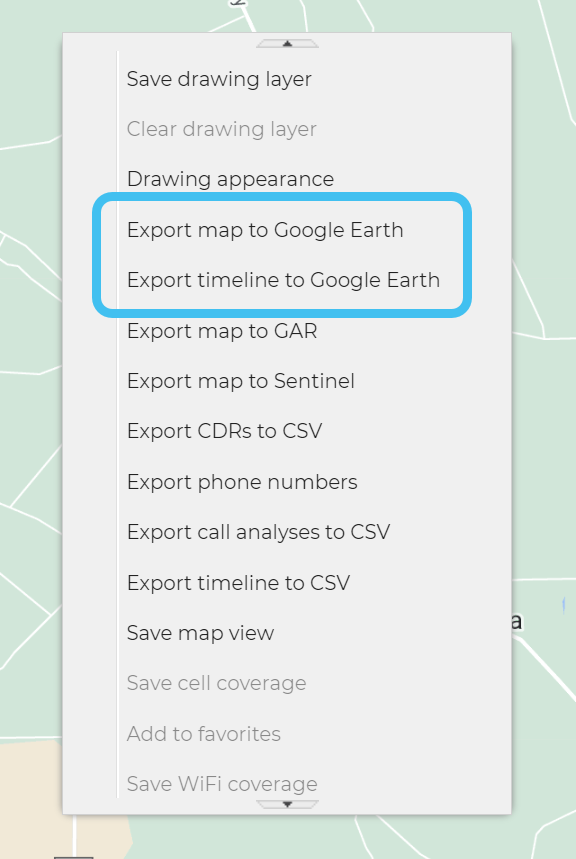
To run the export, either right-click on the map or select then select either Export map to Google Earth or Export timeline to Google Earth.
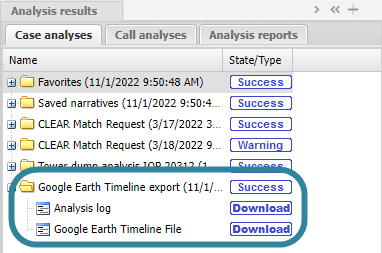
Once the export is complete it is available to download from the Case anaylses tab. Alternatively, you will also receive an email notification when it is complete with a link to download the exported file.
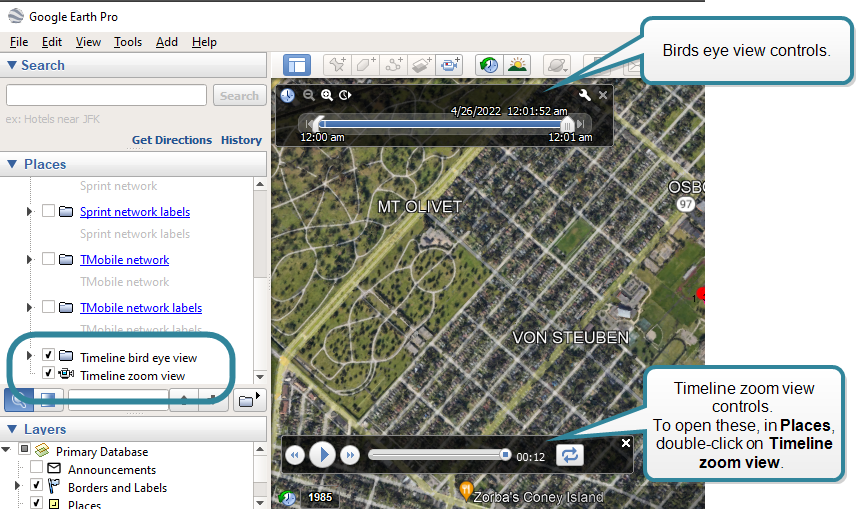
It can then be imported and analyzed using Google Earth.
On the main menu click View cases. The screen that opens depends on your setting of View cases. If it is set to:
Advanced view, then the Advanced view cases screen opens.
If your case is listed on the Favorite & recent cases tab, click the case name to open the Manage case screen.
If it is not listed on the Favorite & recent cases tab, then click the Cases tab. Use the search filters to help locate your case. You can also click to open the FILTERS group which allows you to set your own default filter defining what is displayed on this tab, for example you may wish to set it to cases that you created which are currently open.
If your case is listed under My recent cases click it to open the Manage case screen.
If it is not listed under My recent cases then select your case from the table, using the search filters to help locate it if required. Note, by default the search is set to only display cases that you created; if you are not the original creator but an assignee then ensure you set Case filter to Assigned cases before clicking Search.
Tree view, then the View i-cases screen opens.
Click at the top-right of the screen to open either the View Cases or Advanced view cases screen and follow the above description.
On the Manage case screen click People and devices.
The People and devices screen opens.
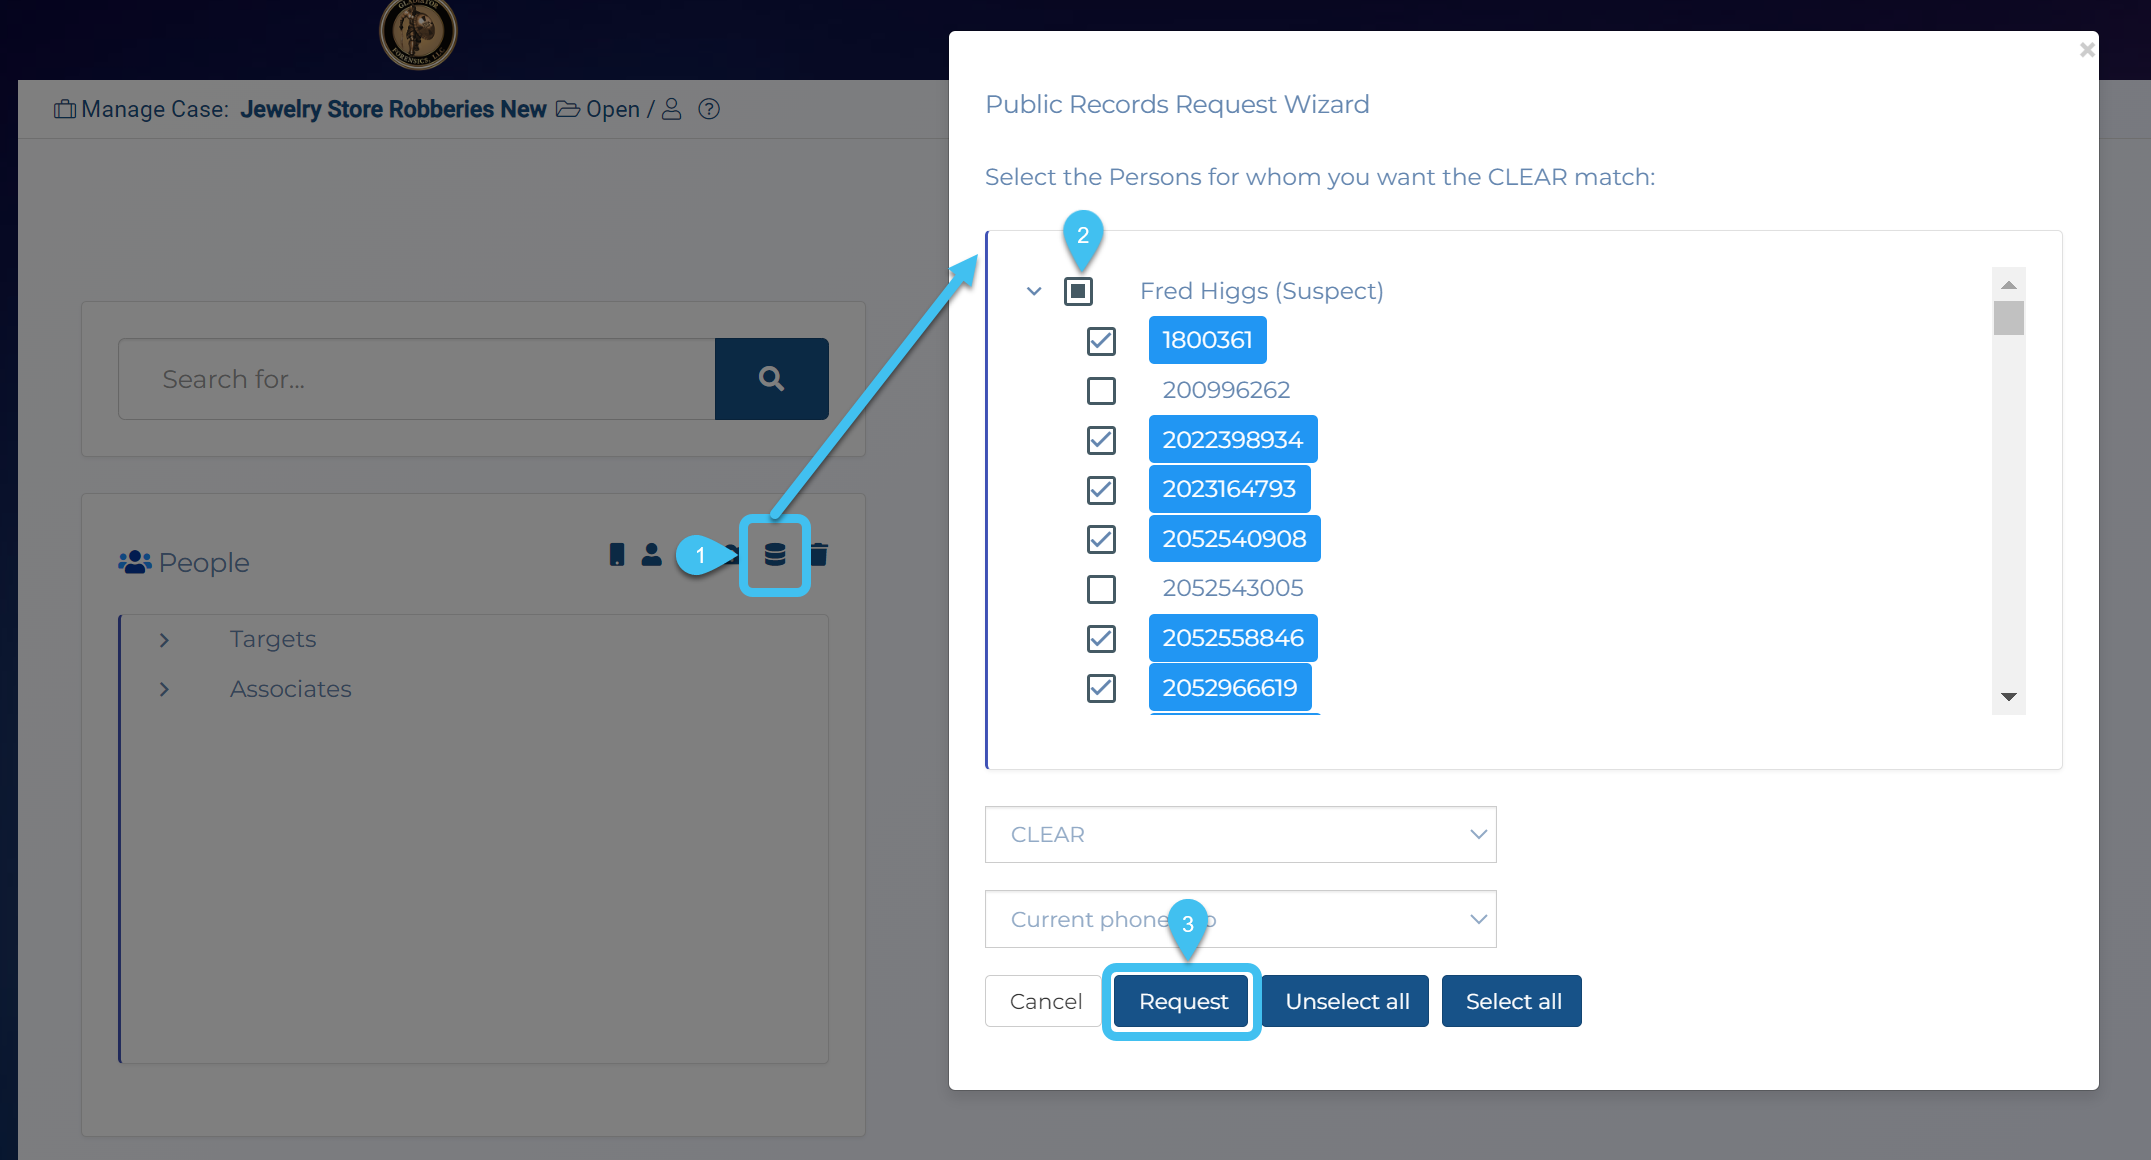
Click , then in the Public Records Request Wizard dialog box select the check-boxes next to the names you want to do a CLEAR or Whooster match on then click Request.
When the CLEAR or Whooster match request is queuing or running it will display a notification alarm; once complete there will be no notification alarm and its status will be updated with in the Case files section of the Manage case screen. The length of time for the CLEAR or Whooster match request to complete is dependent on a number of factors including the number of phone numbers being matched however you will also receive an email when it completes.
Click Back to return to the Manage case screen.
There are two methods of importing public records into OSS-ESPA:
The preferred method for public records that are from Thomson Reuters CLEAR or Whooster, is for you to use the CLEAR or Whooster request feature which is available from multiple locations in OSS-ESPA as detailed in the following procedures. Using this method OSS-ESPA automatically exports the phone numbers you are interested in directly to Thomson Reuters CLEAR or Whooster then automatically imports the public record data into OSS-ESPA. You will receive an email when the CLEAR or Whooster request is complete and the data is available for you to use in OSS-ESPA. In order to use the CLEAR request feature your administrator must first provide Gladiator Forensics with your organization's CLEAR certificate which you can obtain from your Thomson Reuters CLEAR representative. Gladiator Forensics will then apply your CLEAR certificate to your OSS-ESPA account. Your administrator must also enter your organization's User ID and Password for CLEAR, or API key for Whooster.
The alternative method can be used for public records from other applications or files you have created. This method is a manual process. Using the ESPA analysis center screen, OSS-ESPA allows you to generate a .csv file containing phone numbers of interest. This list is then imported into a public record tool which generates a public record file in .csv format. You can then upload the public record file to OSS-ESPA.
NOTE: You can also use this feature to import .csv files you've created yourself which contain names, phone numbers and other data. For further information refer to Manage files screen.
Once uploaded the records are available to view and use in People and devices and on the Public records tab.
The Show phones with public records setting on People and devices allows you to filter the associate records so that you only display those which have public records. You can then click on the associate's name, then click on to view the public records details, and click on to use their name from the public records. Note, that currently the name is used throughout OSS-ESPA with the exception of the ESPA analysis center that currently the names selected on the Public records tab.
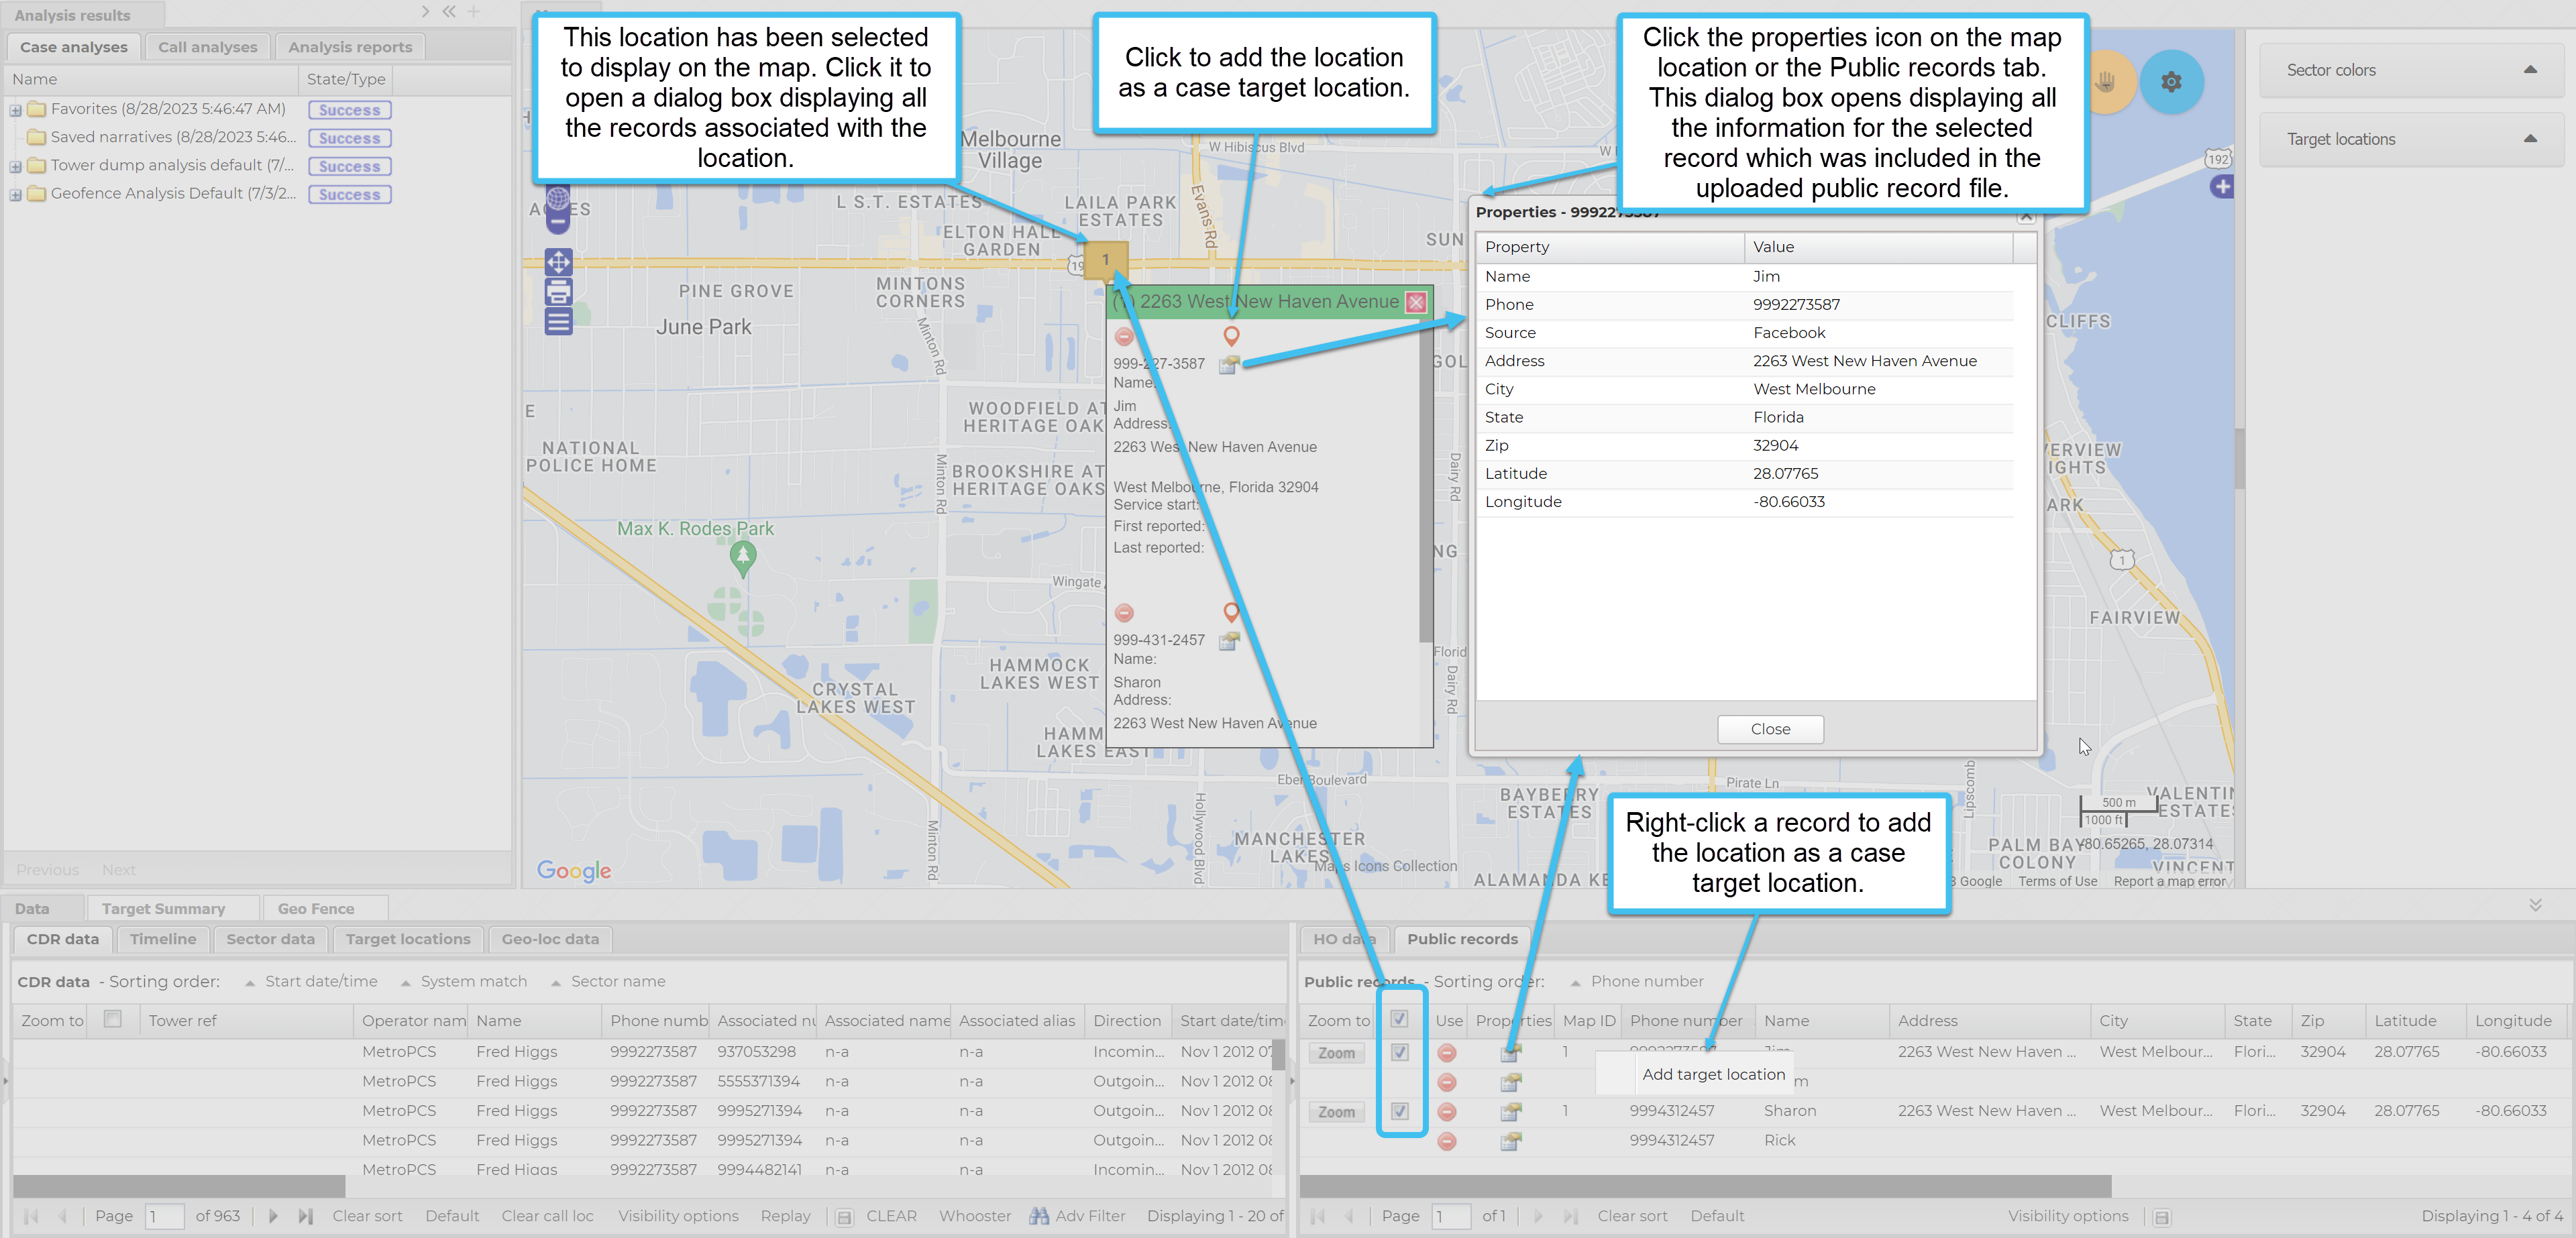
Once uploaded the records are available on the ESPA analysis center screen for you to use in your investigation. The records are displayed on the Public records tab and on the map. You can select on an individual basis which records you want to use in your case. When you select to use a record the name associated with that record is then automatically displayed on the CDR data tab, the Timeline tab and the Call analysis tab.
The following graphics provide overviews of how public record data is used on the ESPA analysis center screen.
This graphic displays how and where the names are displayed on the ESPA analysis center.
This graphic displays how the location markers and location properties are displayed on theESPA analysis center. If required you can add the location to your case from both the map and the Public records tab as shown in the graphic.
If you have an account which includes IQ packets then the public record data is included in your IQ packet's common and frequent analyses results.
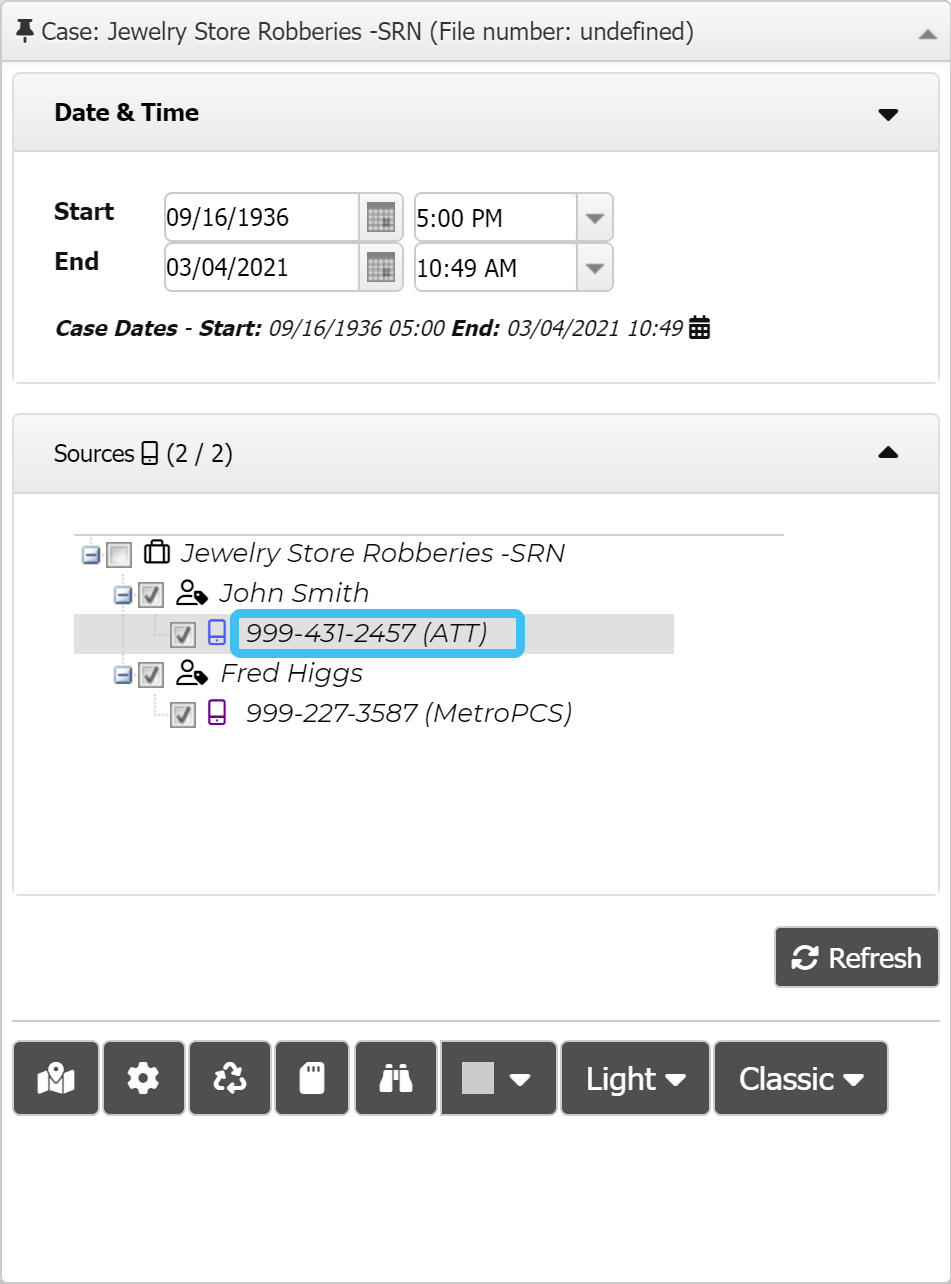
You can make timezone adjustments on a selected phone number's CDR files, phone data files and geo-location files, and on a selected vehicle's geo-location files.
You can also click here for a short video showing how to make a timezone adjustment.
On the ESPA analysis center's Input and settings view, left-click the phone number you want to make an adjustment on.
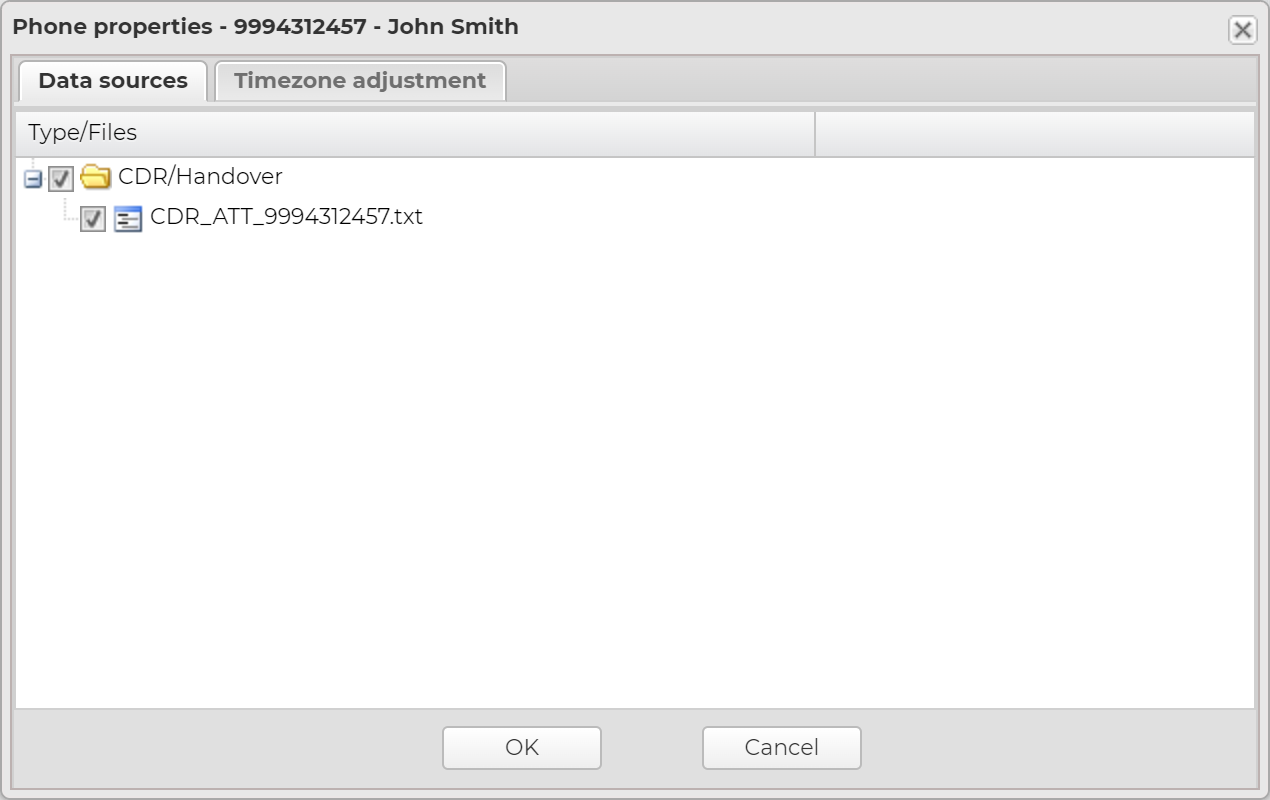
Select the file you want to make on adjustment to.
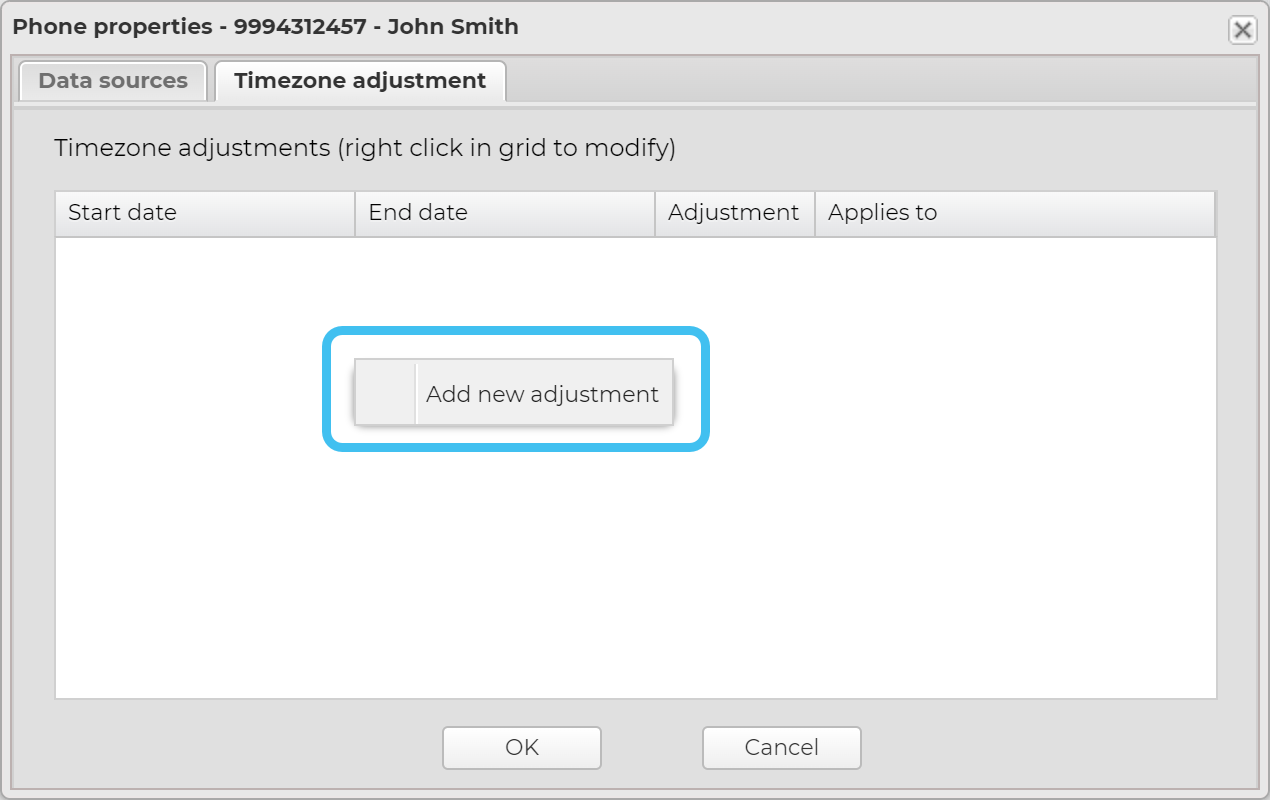
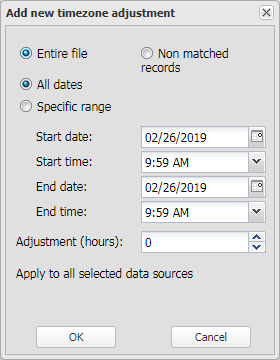
Click the Timezone adjustment tab, then right-click inside the window and select Add new adjustment.
A icon alongside the phone number indicates that a manual timezone adjustment is applied.
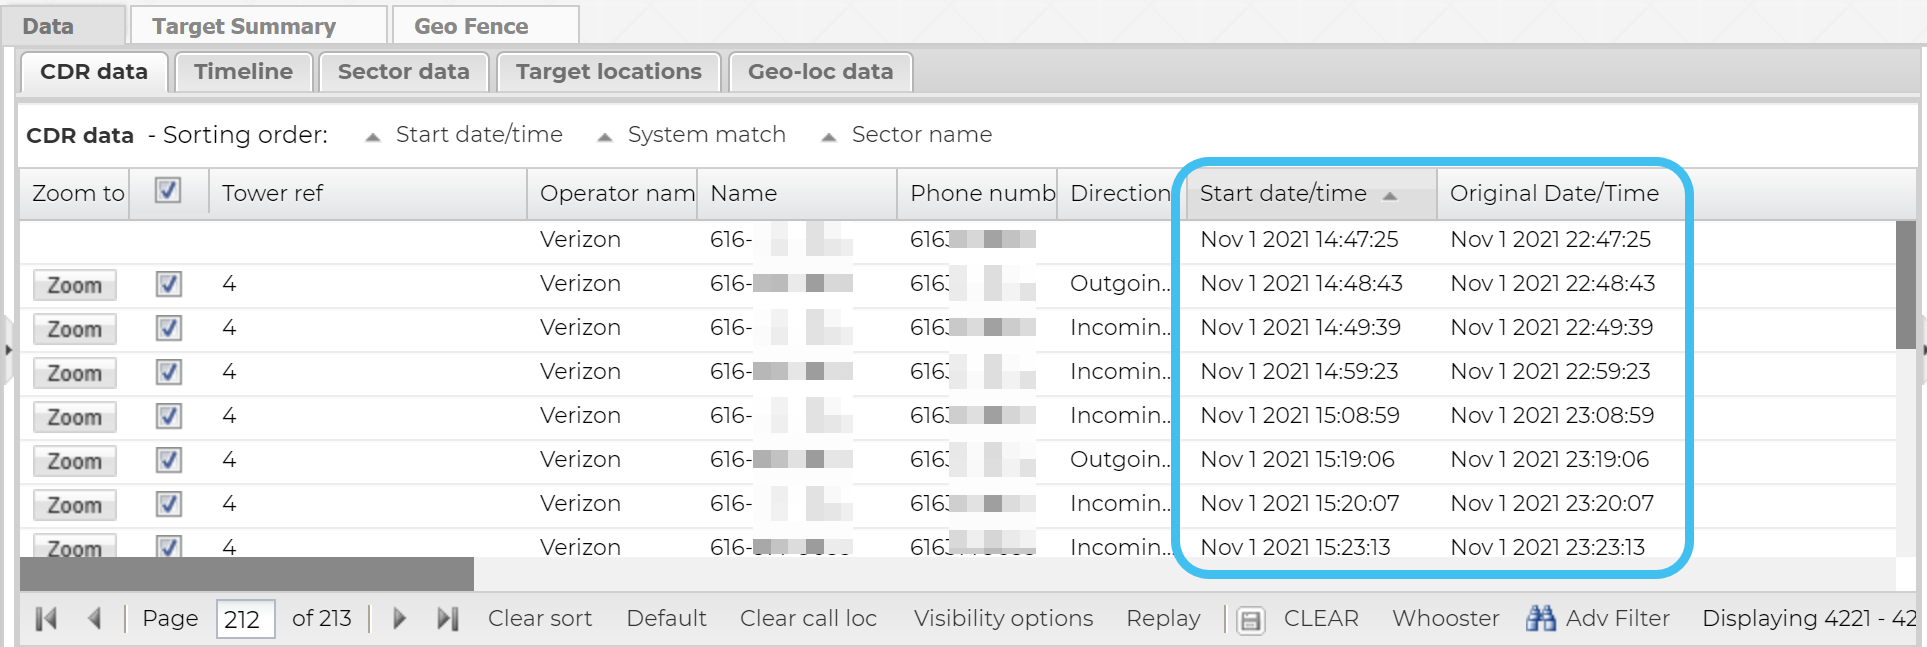
There are two date/time columns on the tab, Start date/time and Original date/time. The Start date/time column displays the date/time using the local time of the tower and also includes any manual timezone adjustments you have applied, but if the location information for the call record could not be found in the cell tower data file and you have not applied a manual timezone adjustment then the UTC time is displayed. The Original date/time always displays the time in the imported CDR file.
How do I run a precision location analysis (arc analysis)?
How to run a precision location analysis to prepare evidence
With your case open on the ESPA analysis center configure the screen for the geo-location data and TA data you want to run an analysis on. You can do this by either:
setting the map's boundaries to include all the geo-location data and TA data you want to analyze, or
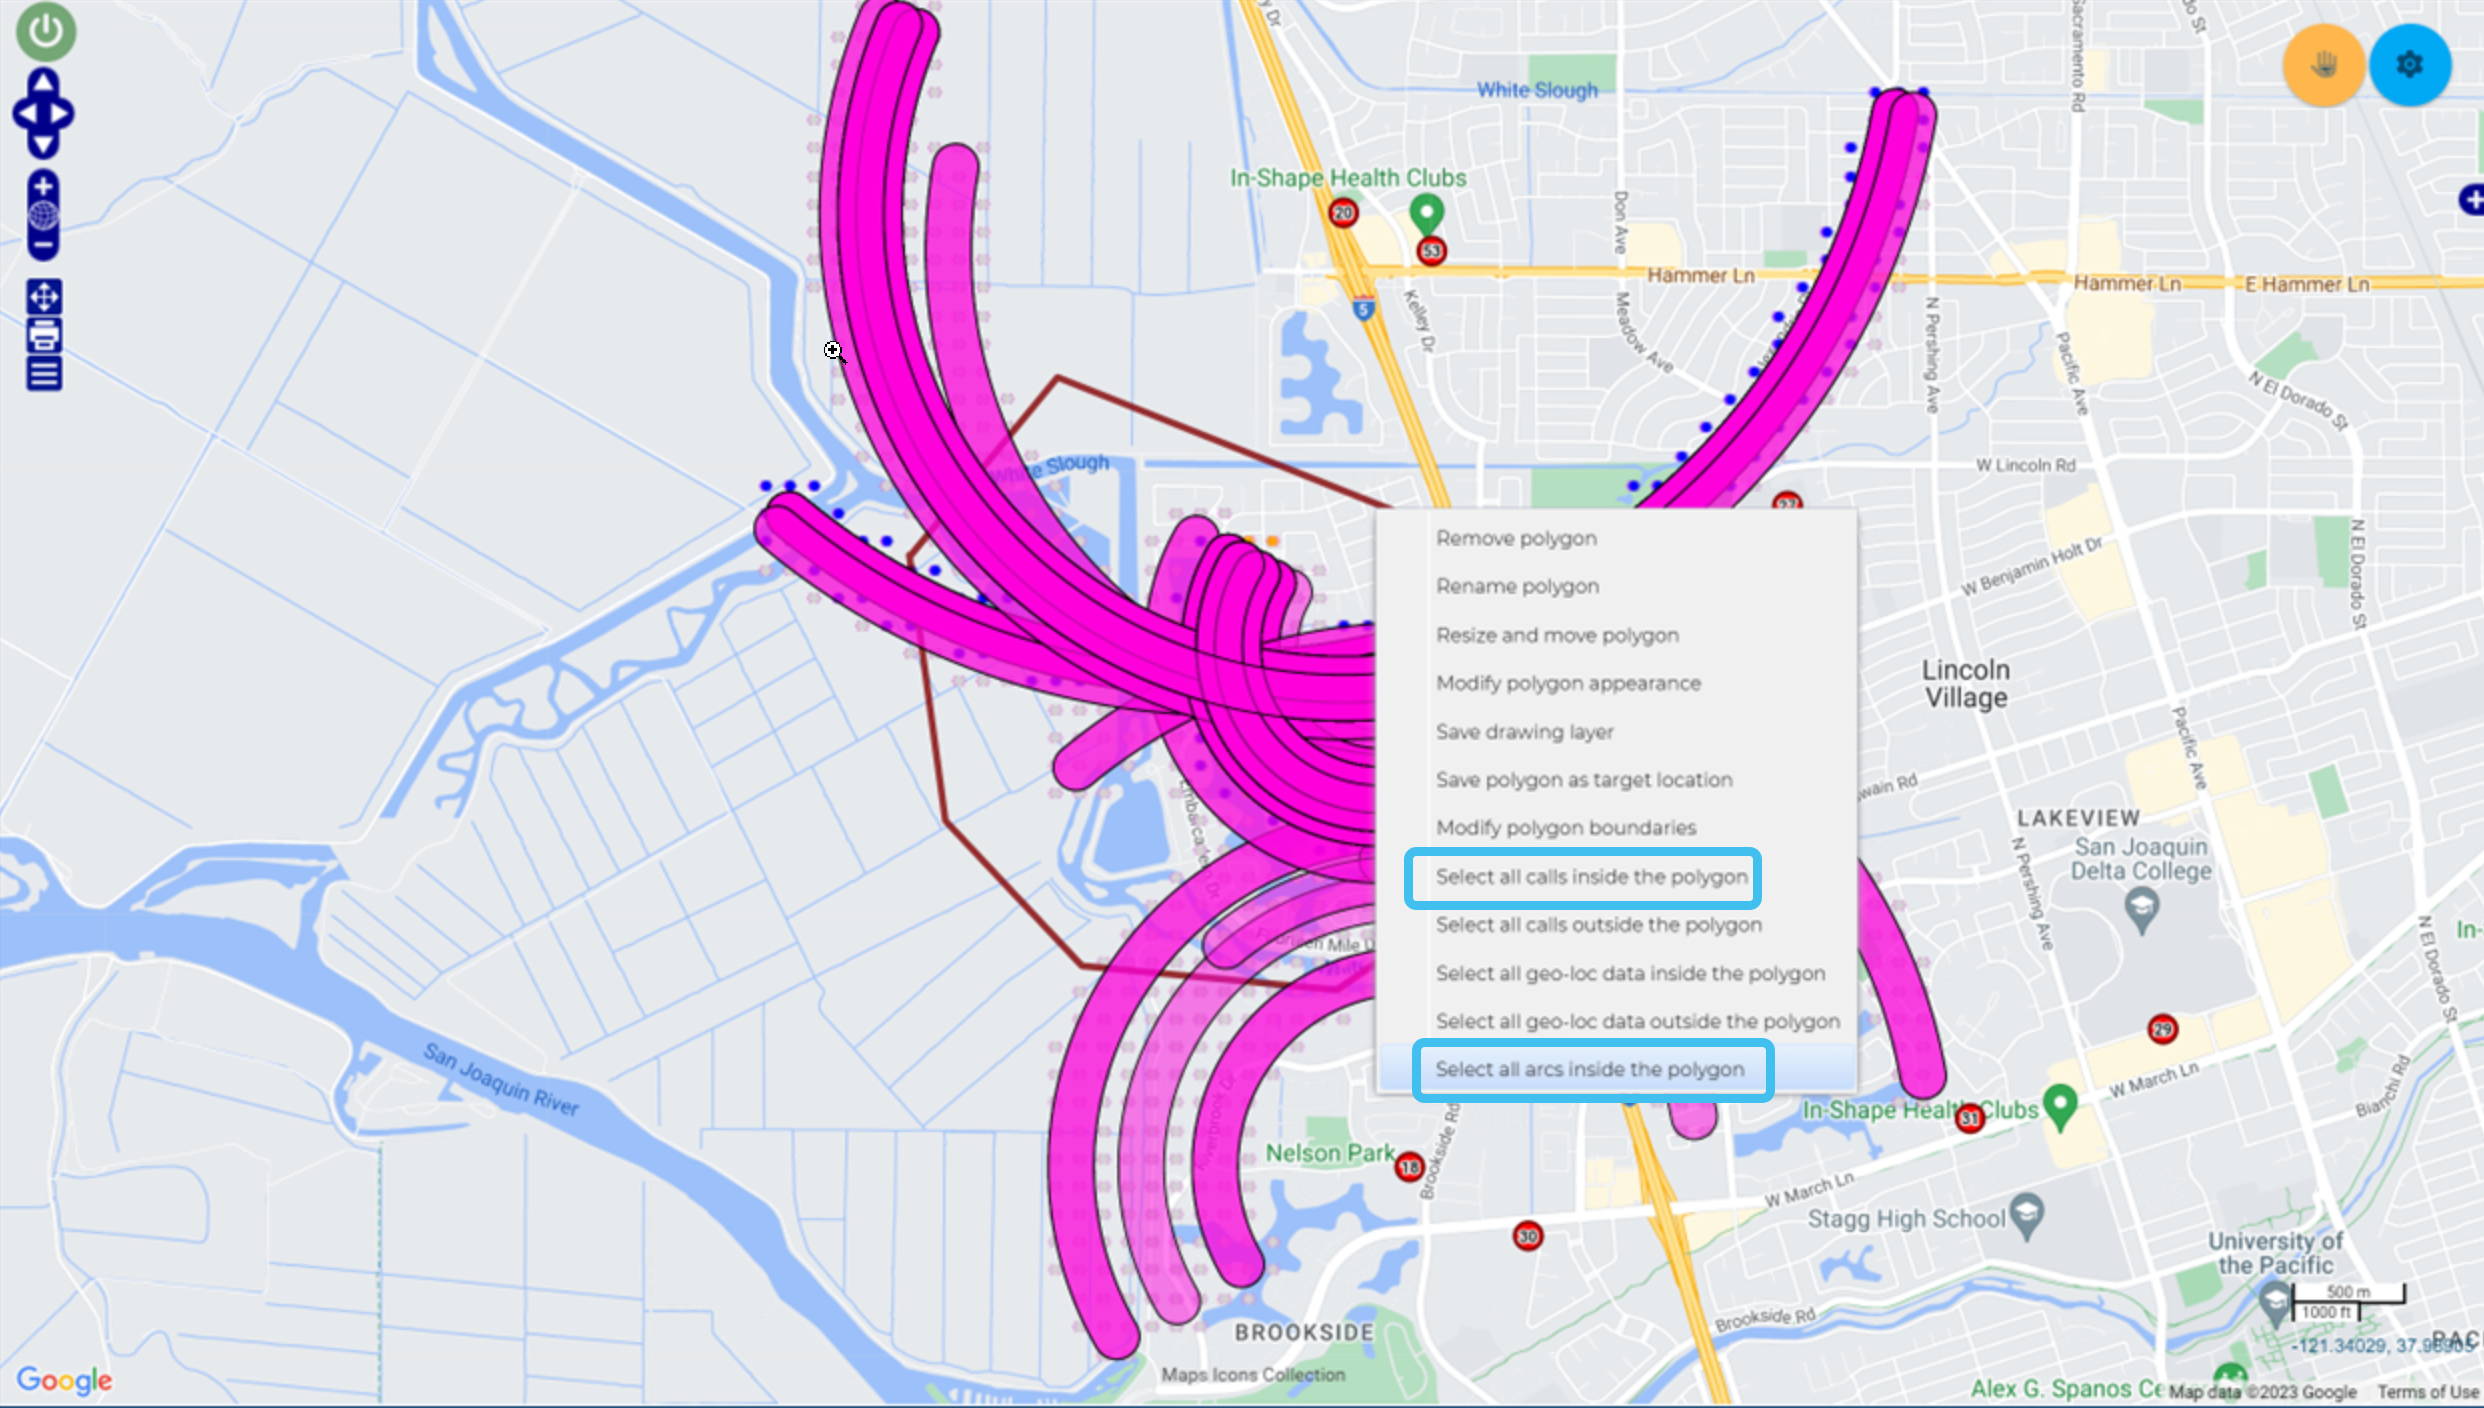
by selecting the geo-location data and TA data you want to analyze. You can do this by either selecting the data using the check-boxes on the Geo-loc data and TA data tabs or by using the map. To select the data on the map, you can either right-click a sector then from the pop-up menu click Select all arcs from this sector, or draw a polygon around the data then right-click the polygon and from the pop-up menu click Select all calls inside the polygon and Select all arcs inside the polygon.
Hover over on the top-right of the map.
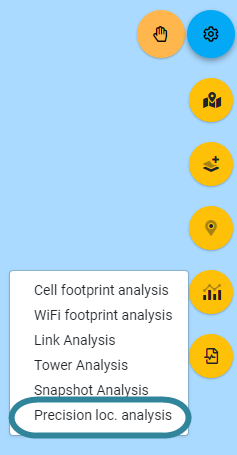
Click then select Precision loc. analysis from the menu.
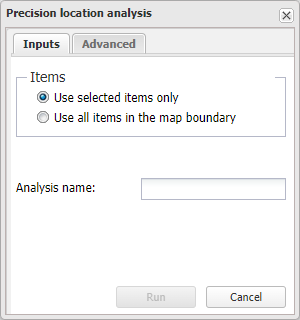
The Precision location analysis dialog box opens.
On the Inputs tab:
In Items select whether you are using the map boundaries or the selected data to run an analysis on.
In Analysis name, enter a name for your analysis that is useful to you.
On the Advanced tab, select the type of calculation you want used for your analysis. For further information refer to Calculation.
Click Run to start the analysis.
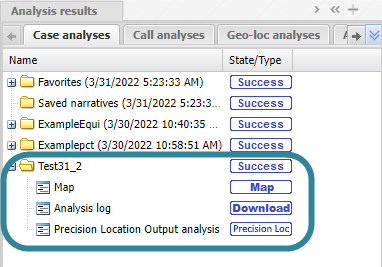
Your analysis report is listed in the Case analyses tab of the Case management view. Once the analysis is completed the state is updated. You can use the analysis results if the state is either Success or Warning.
When your analysis is complete you are automatically notified by email and then you can view the analysis results. For further information refer to .
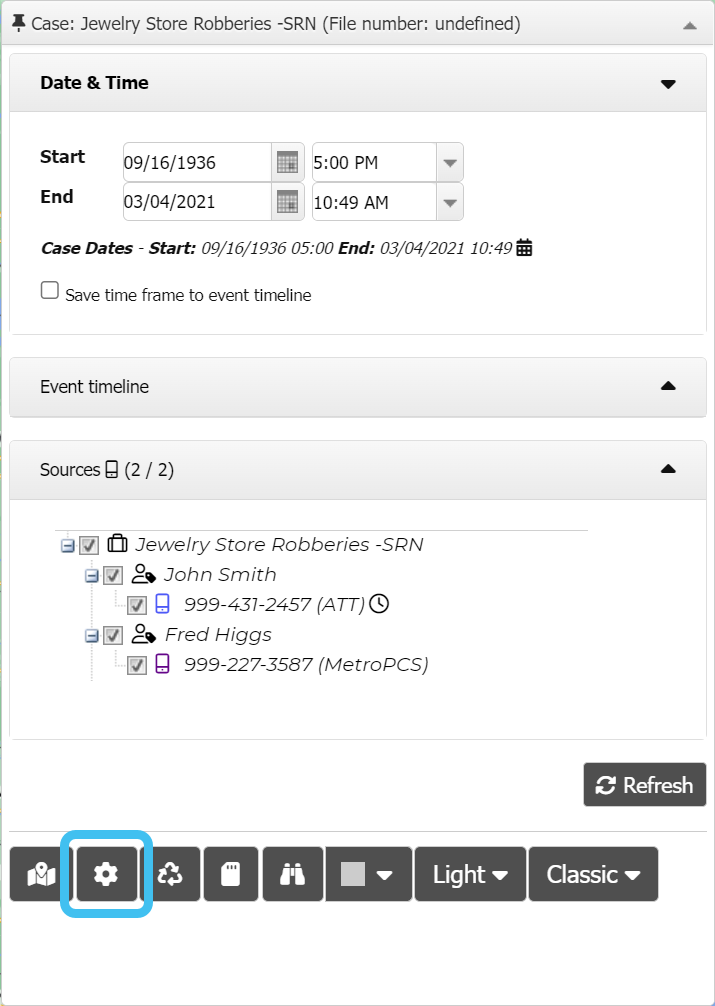
The ESPA analysis center's Advanced options dialog box allows you to configure many features of the ESPA analysis center. Open it by either clicking or . Some of the most commonly used settings, especially those that optimize the performance of the ESPA analysis centerare:
the Map tab's Table view page size, Use data call records, and Surrounding towers unselected by default.
the Display tab's Call information columns.
the Analysis tab's Target summary settings and Analysis to run on refresh.
 Investigating case data visually on the ESPA analysis center
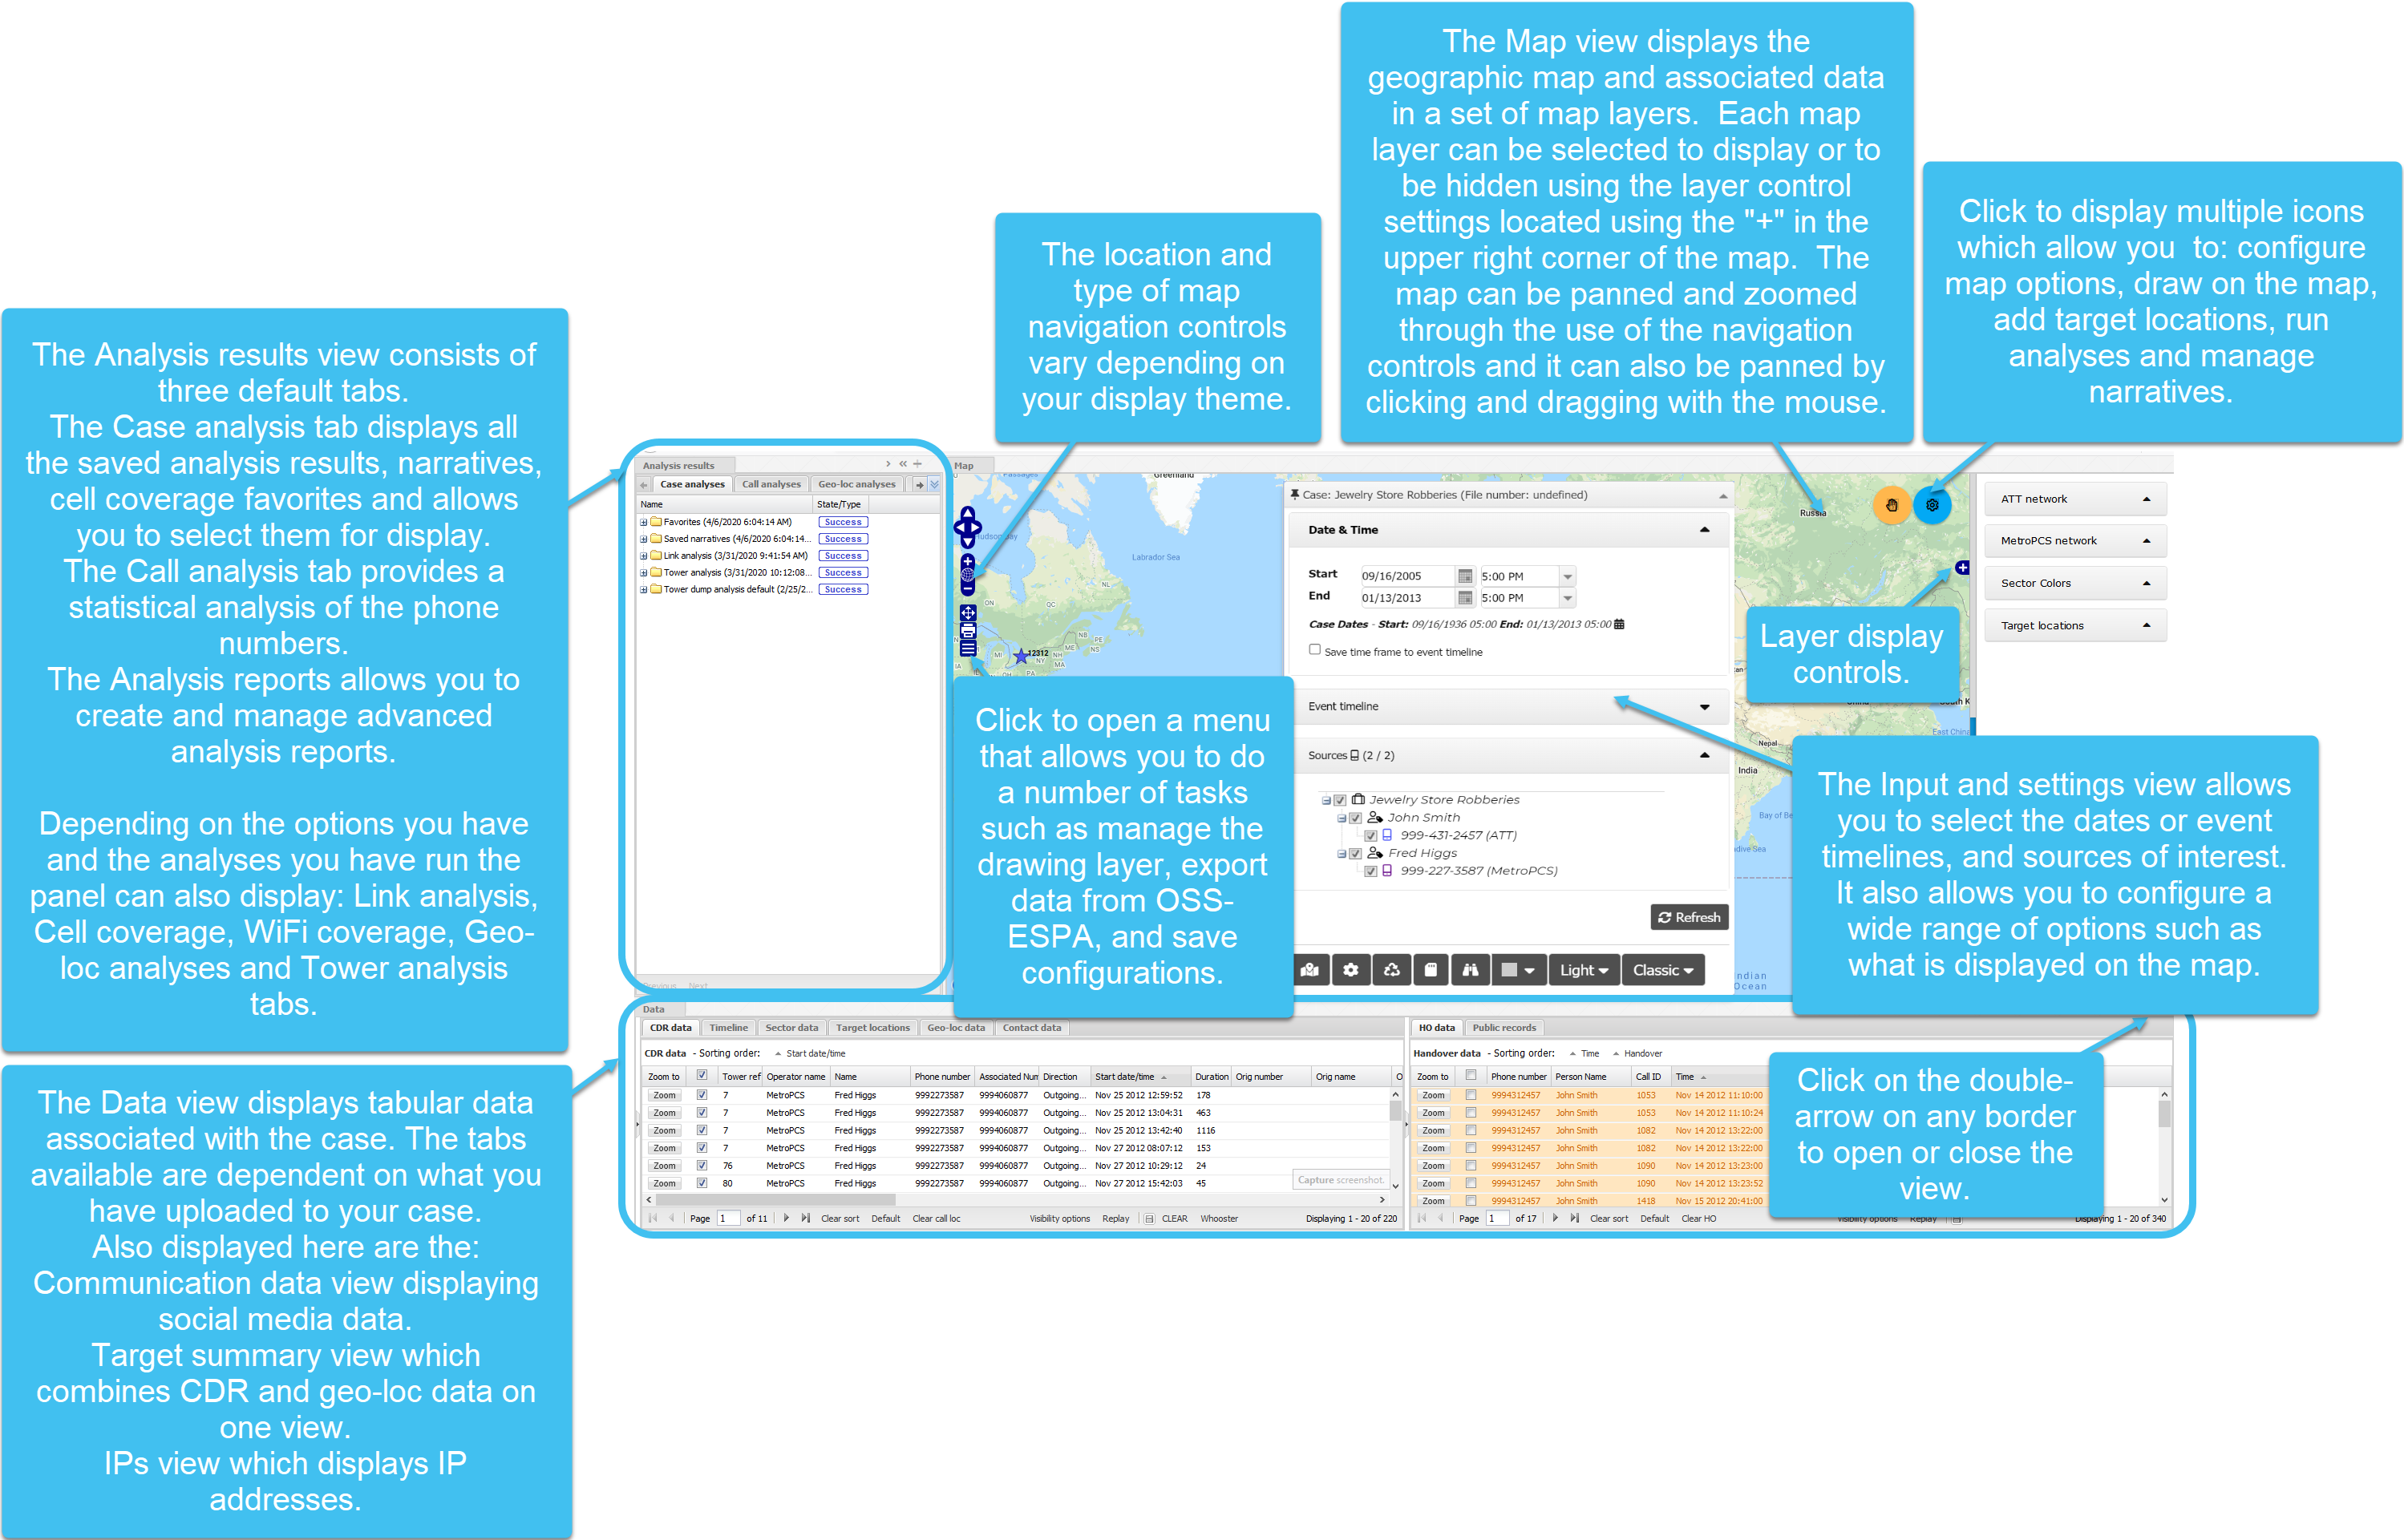


 before the analysis name indicates that the analysis has been run. If
  is displayed, you must click it to run the analysis first.
  beside a target phone number to display the details of the frequently called phone numbers. This allows you to view the top ten most frequently called numbers and the call data. The
  to open the
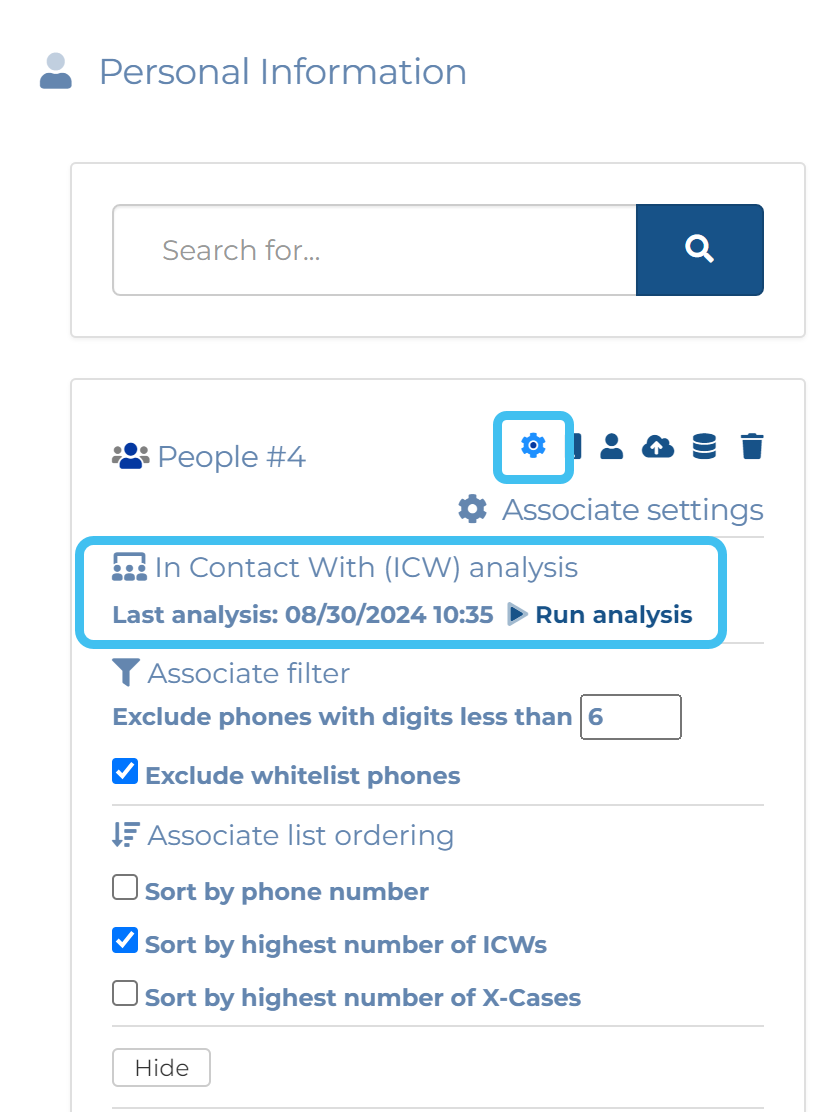

 and select
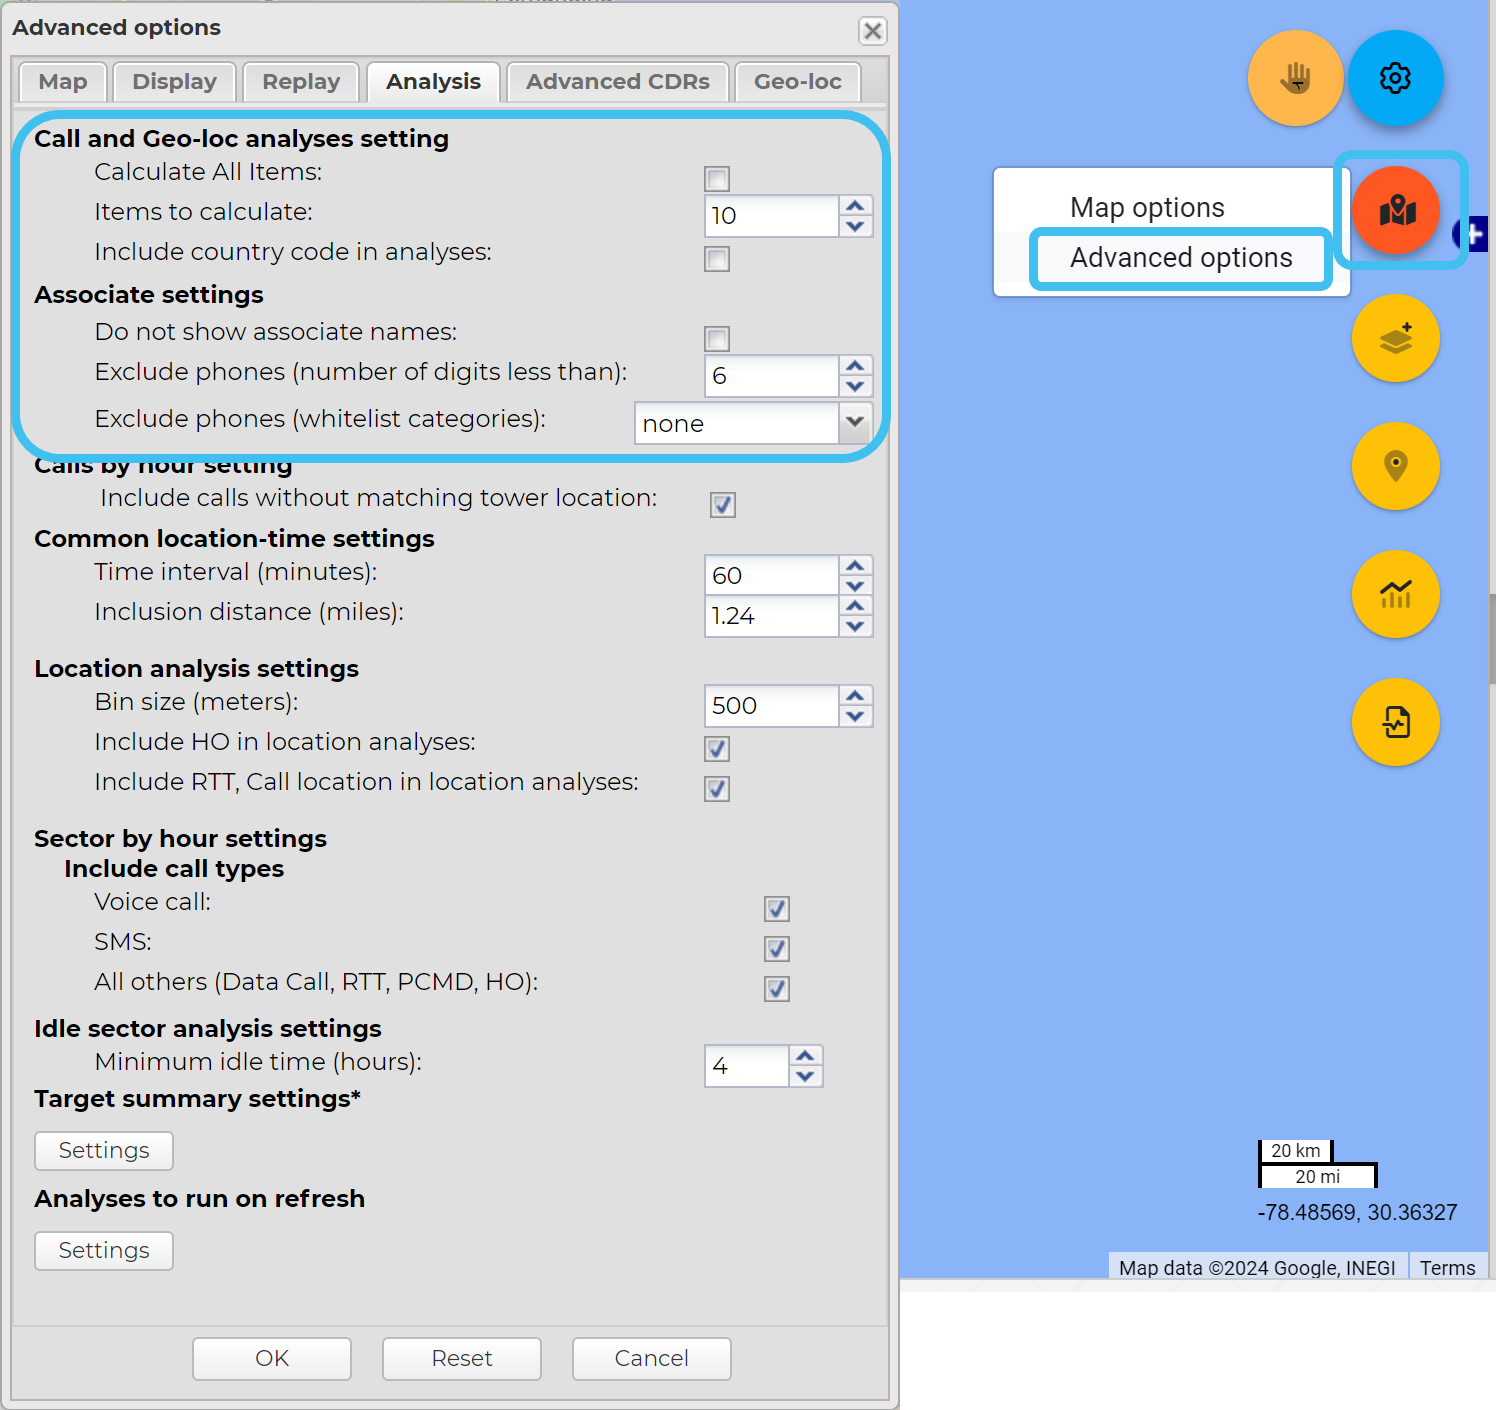
 then select
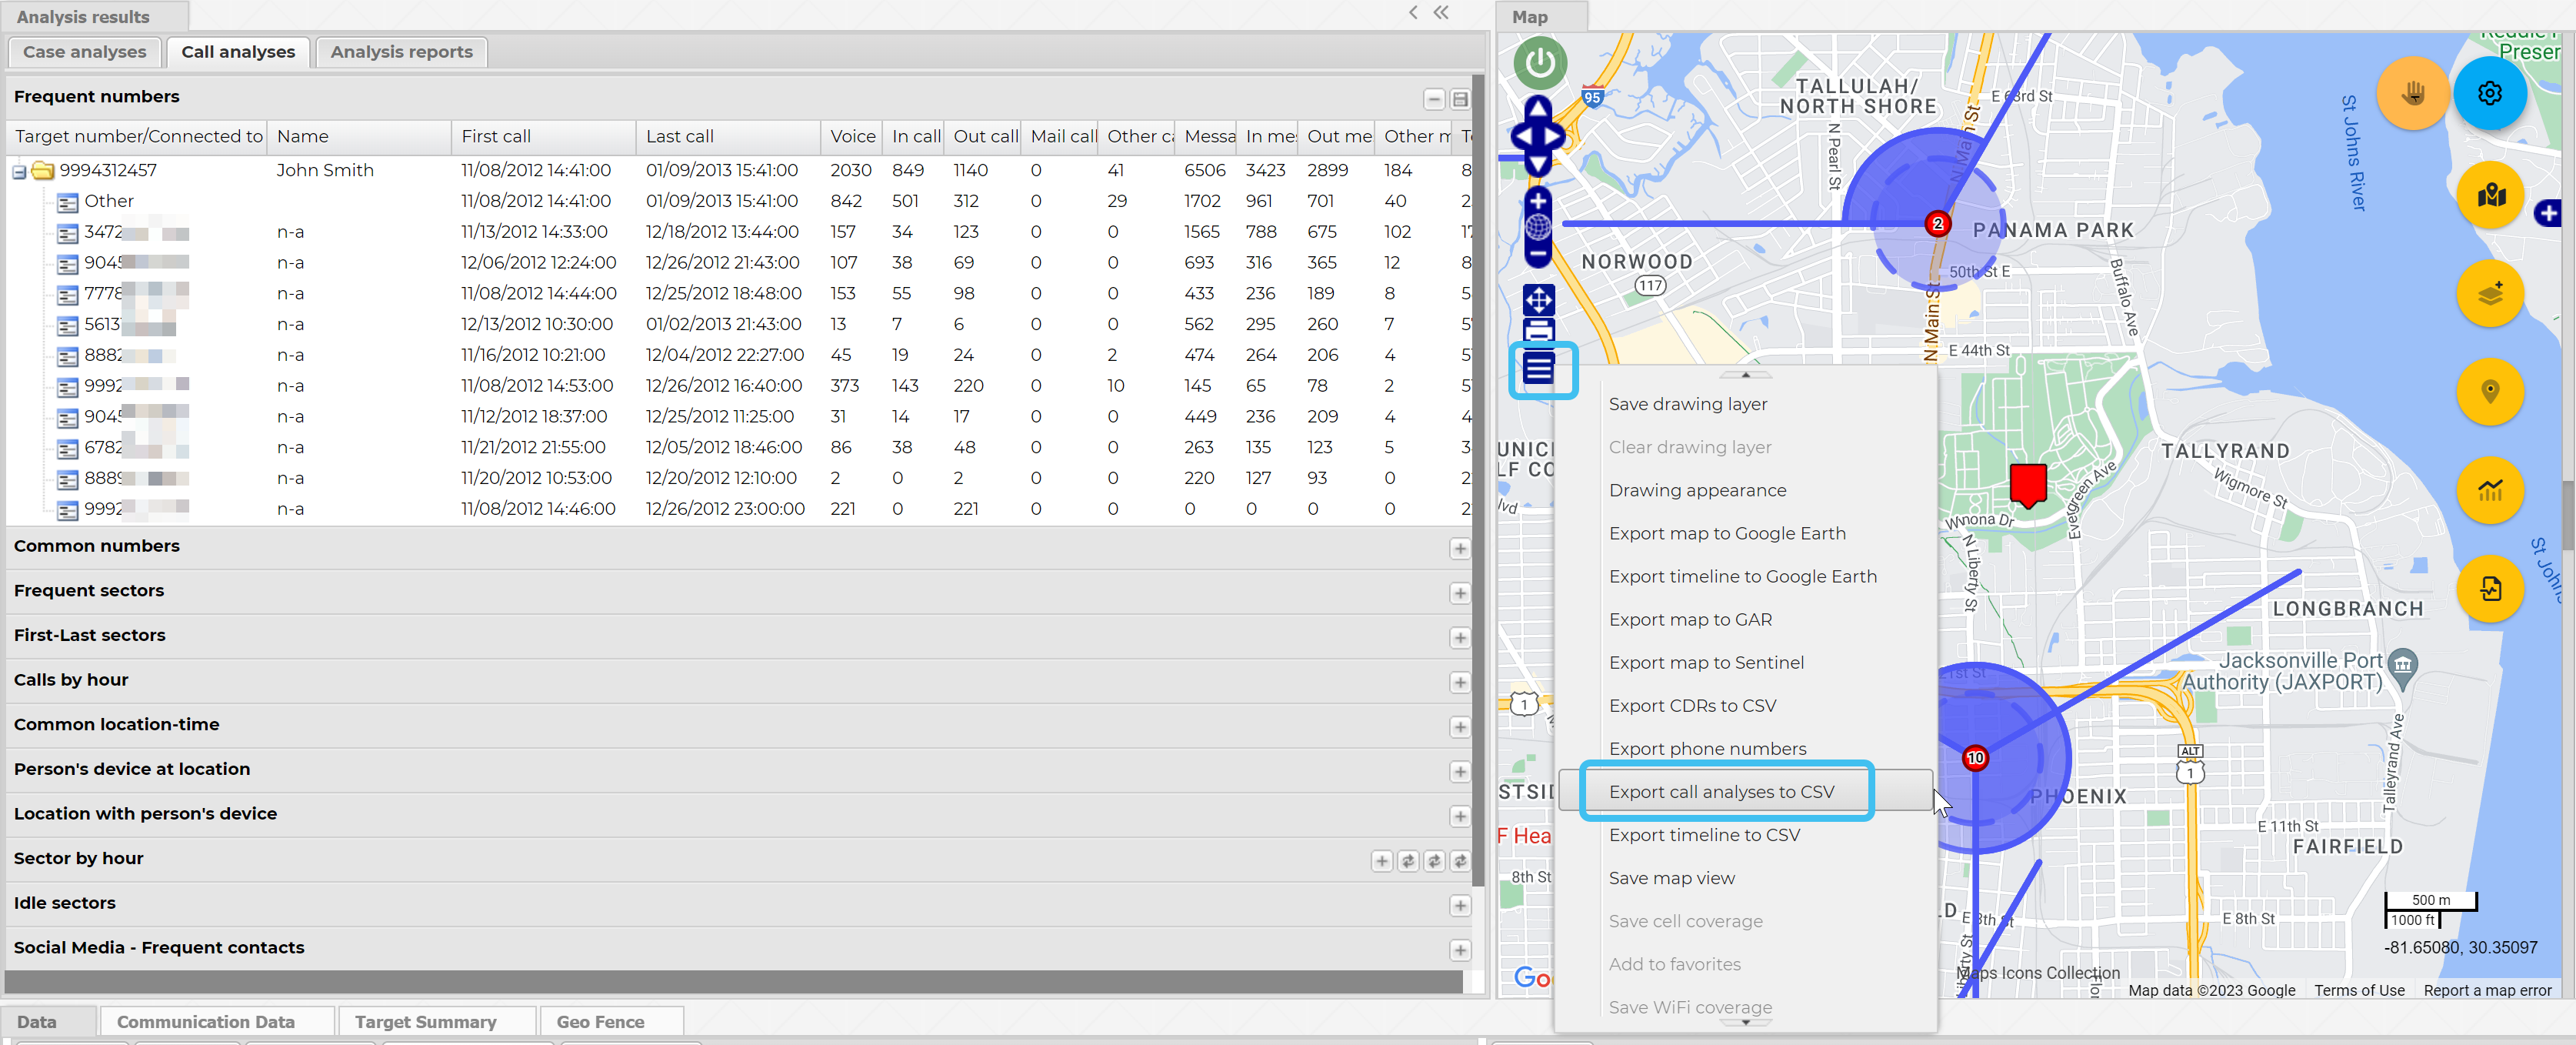
 .
.


 to open the
  at the top-right of the screen to open either the
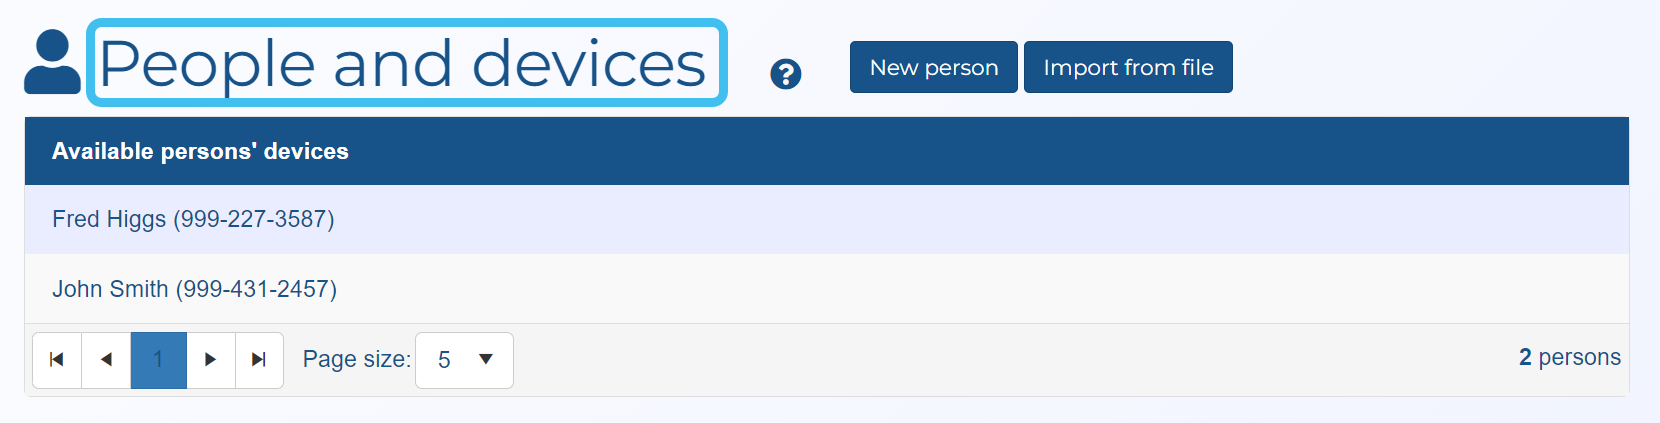

 to view the public records details, and click on
  to use their name from the public records. Note, that currently the name is used throughout
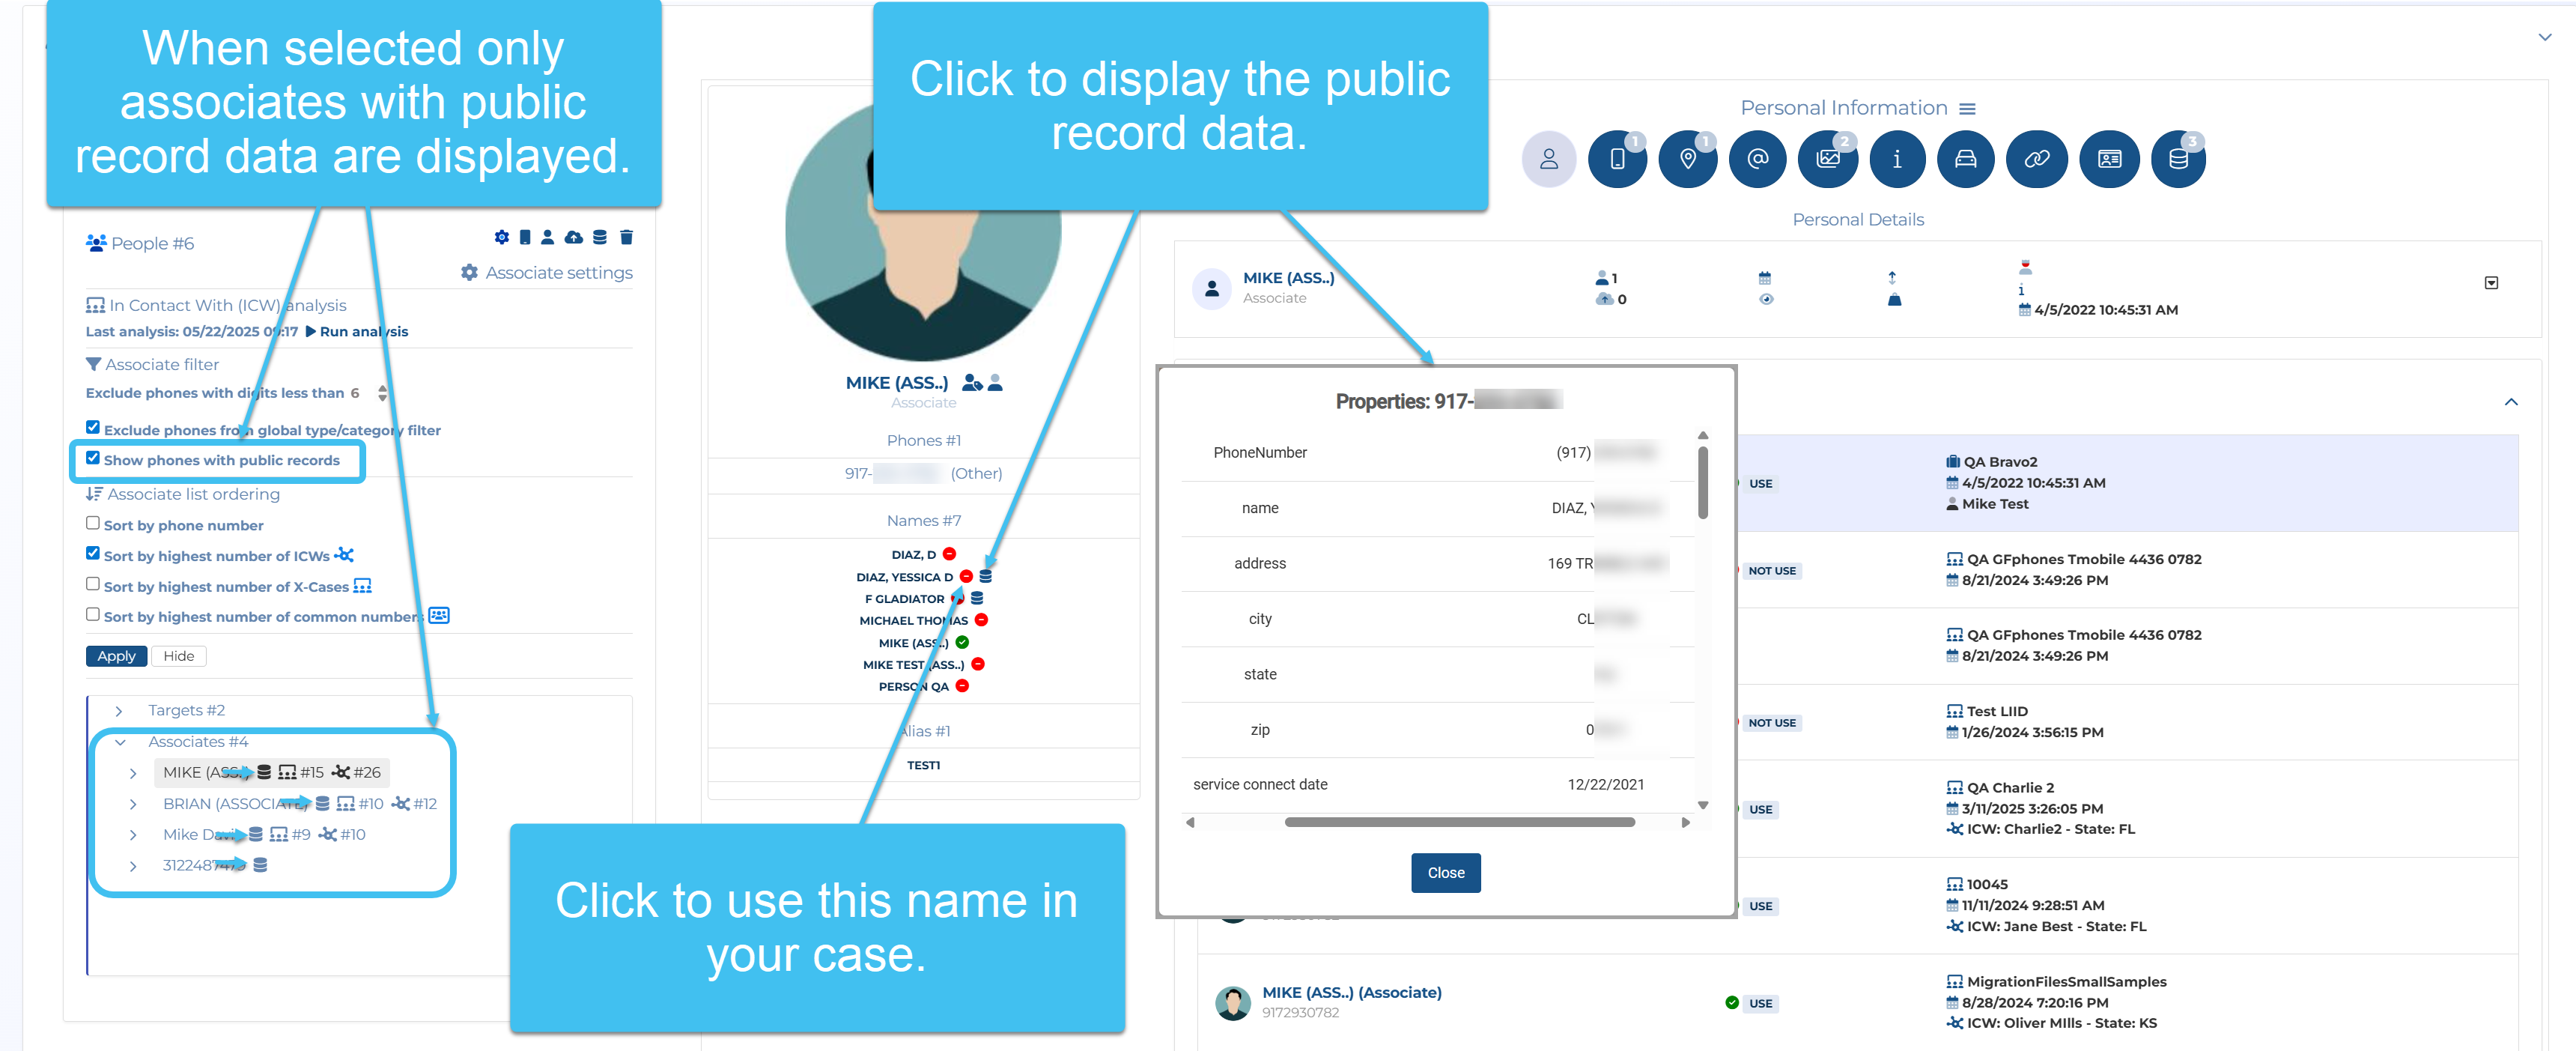

 icon alongside the phone number indicates that a manual timezone adjustment is applied.
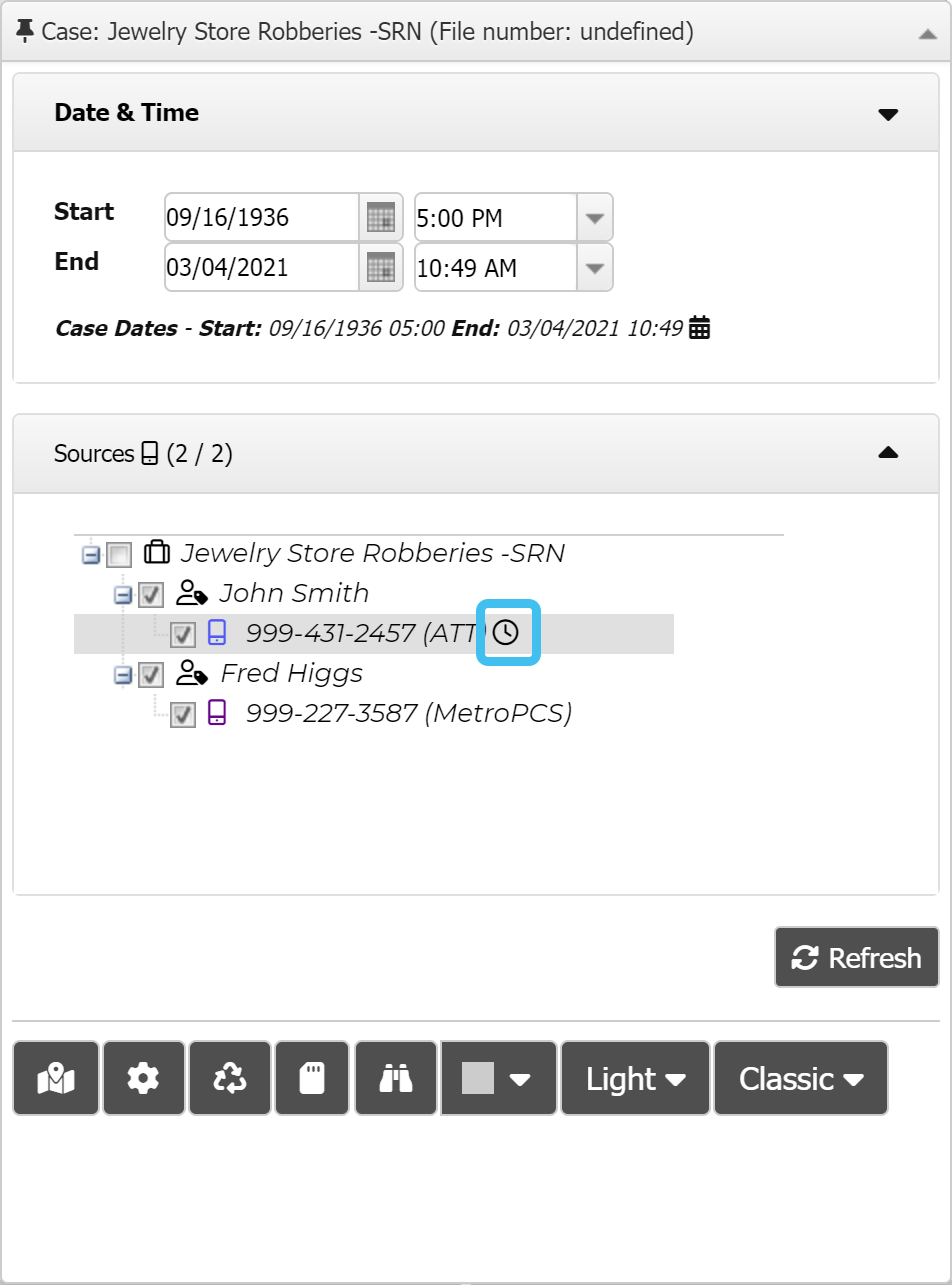
 then select