Map screens
The map screens display the physical locations, with real-time updates of the phones you are monitoring. You can open the map screens using three methods; which you use depends on the task you are performing. If you want to track:
-
all the phones that you are monitoring, then you should open this screen from the Home screen by tapping Sentinel. In the Help this is referred to as the Sentinel map screen.
This method provides you with 1 week of data for every phone you are monitoring, and you can view your own breadcrumb trail on the map.
-
phones on a per case basis then you should open this screen via Cases on the Home screen. In the Help this is referred to as the Analysis Center map screen.
This method provides you with 6 months of data for each phone in the case, and you can view the field unit location and breadcrumb data for all the field units assigned to the case.
-
phones that are part of a mission, then you should open this screen via Missions on the Home screen. In the Help this is referred to as the Sentinel mission map screen.
This method provides OSS-ESPA users with up to 6 months of data for each phone in the mission, and you can view the field unit location and breadcrumb data for all the field units assigned to the mission. Note, guests are limited to the number of hours set by the mission creator and can only view the last location of each field unit.
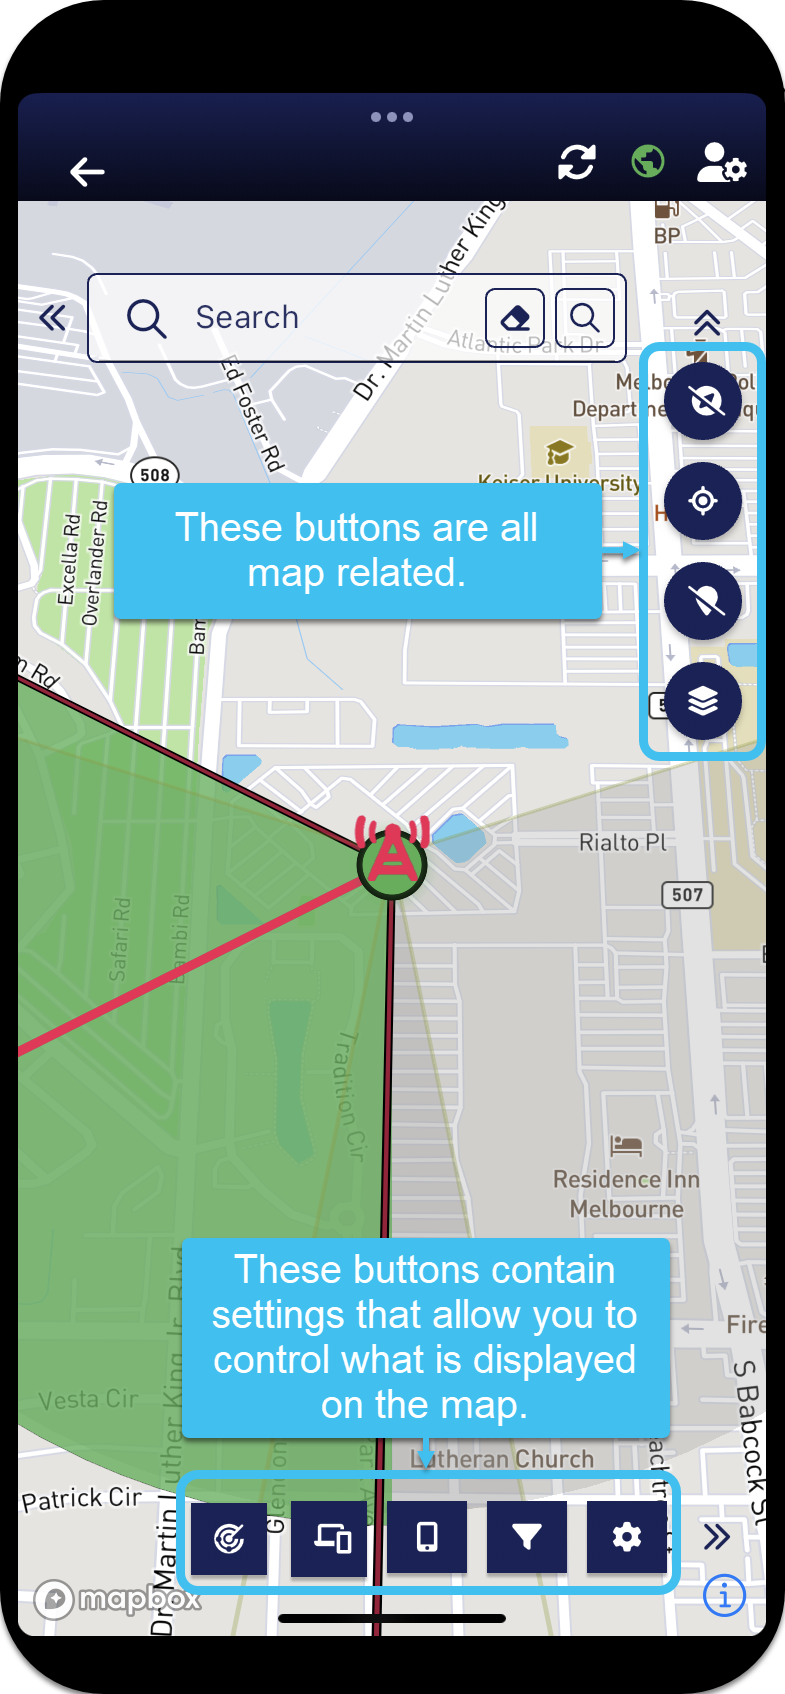
There are two sets of buttons on the map screens:
-
the circular buttons, down the right-hand side of the screen, that you can show or hide by tapping the double arrows, are map related buttons.
-
the square buttons along the bottom blue bar of the screen are for settings that allow you to control what is displayed on the map, for example you can select which phones are displayed and the amount of data. Spinners are displayed alongside
On the map, a phone is identified using the following attributes:
-
the icon style indicates the type of event, either a
 for PRTT events, a
  for GPS ping events and a
  for Smart Track alerts.
 -
the icon color indicates the phone number the event is for. You can customize these colors on the Phones panel.
-
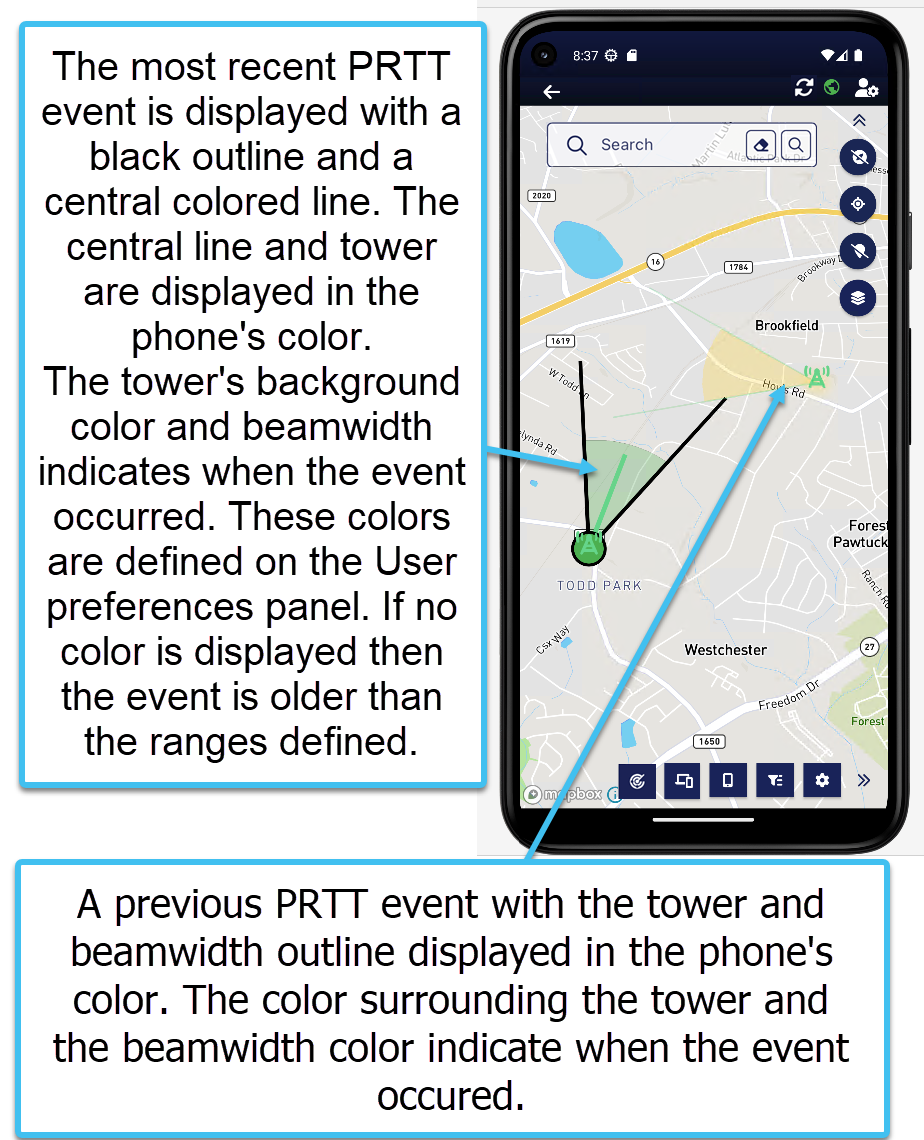
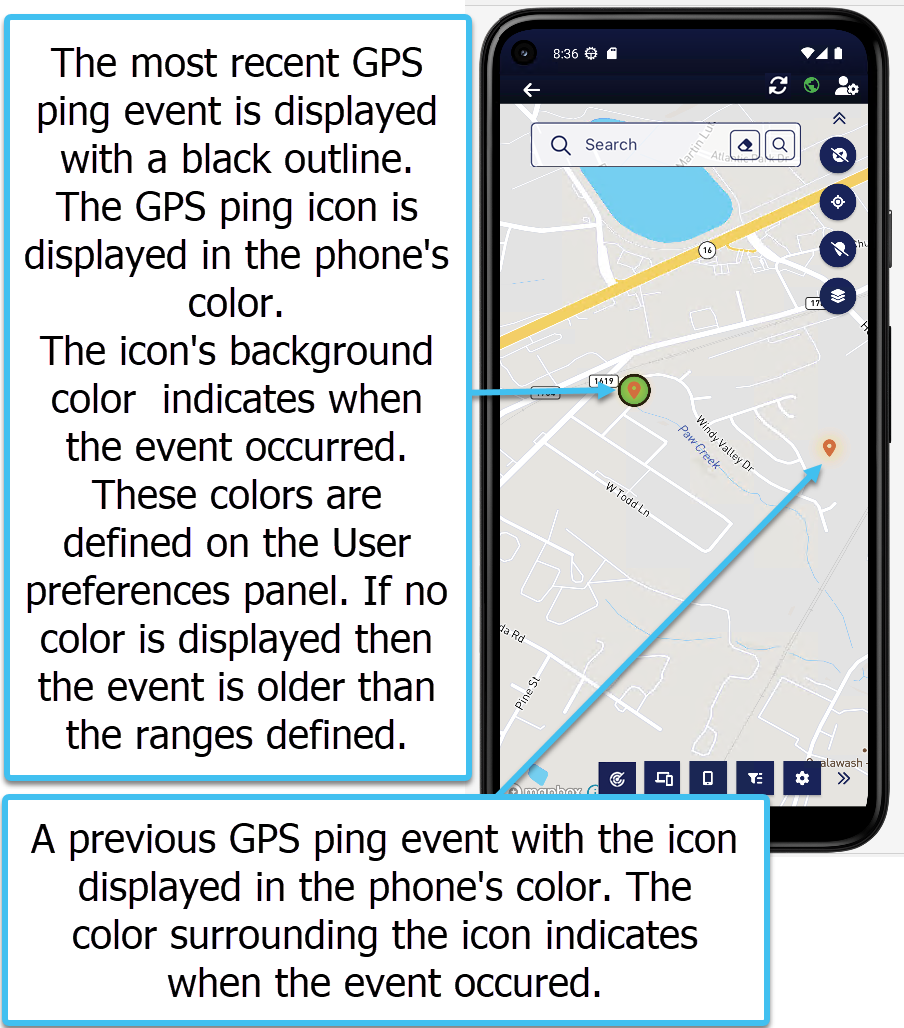
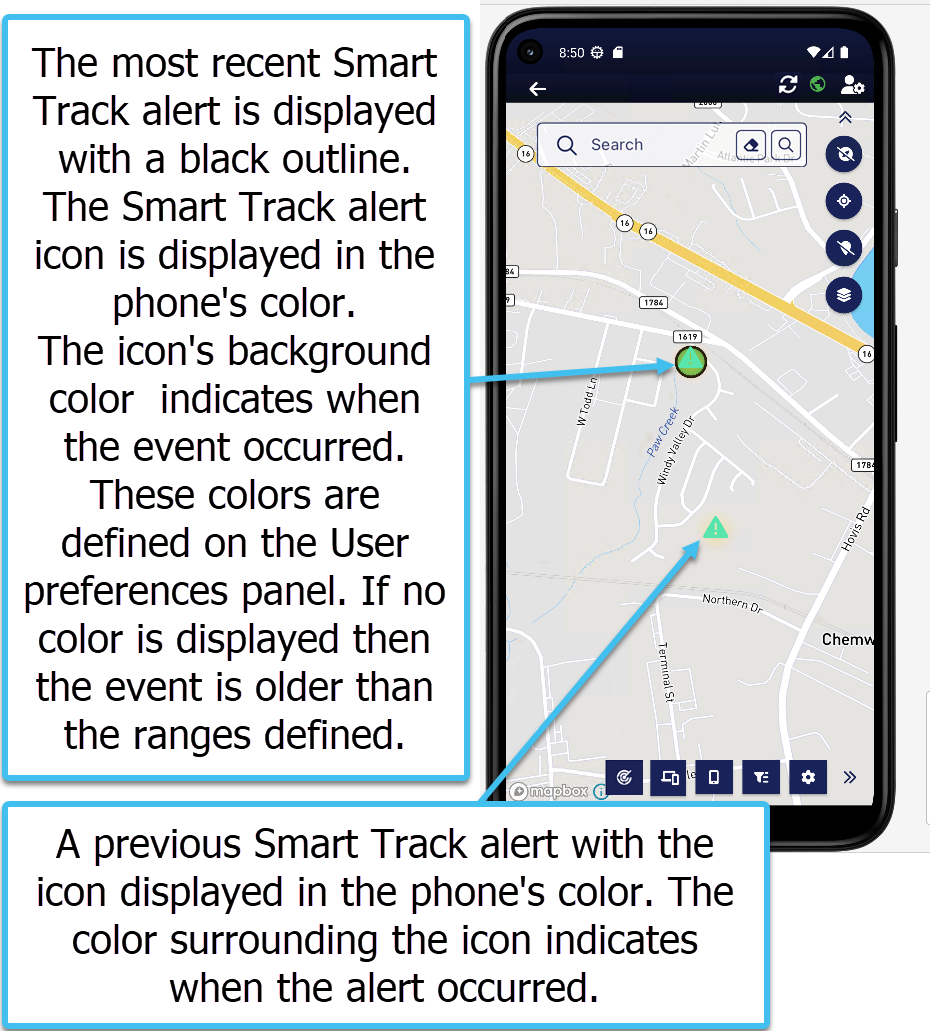
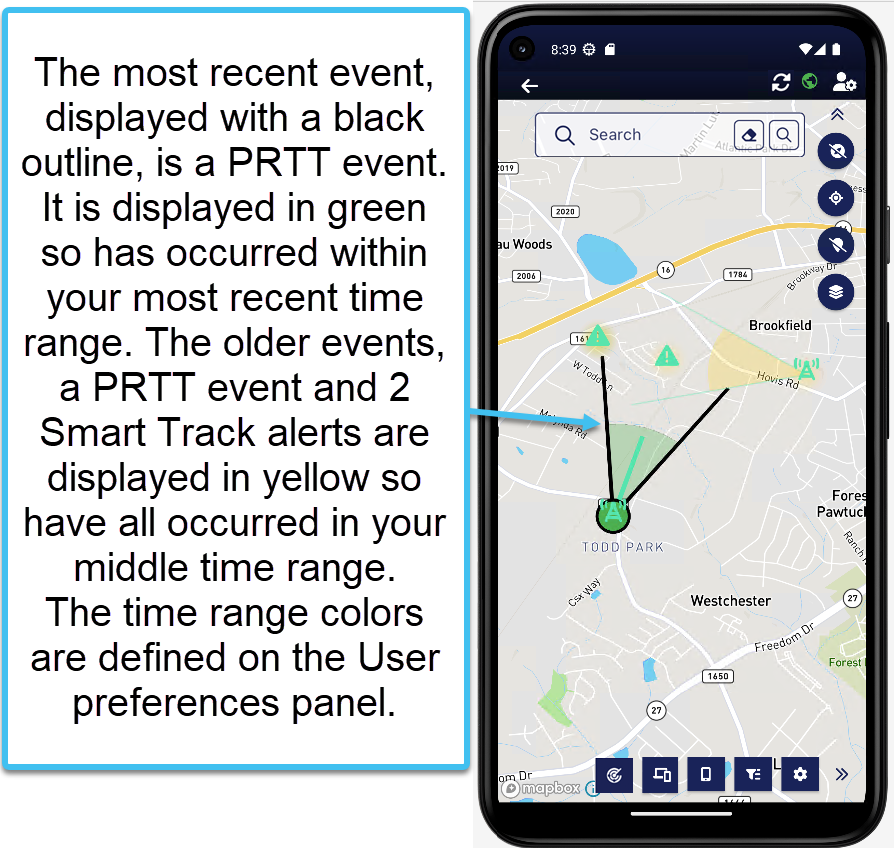
the color surrounding the icon and sector beam (green, yellow, or red) indicates how long ago the event occurred. You can customize these time ranges on the User preferences panel.
-
the most recent event displays with a black outline.
For example:
-
PRTT event:

-
GPS ping:

-
Smart Track alert:

-
The following example displays four events, two PRTT and two Smart Track alerts:

 , data
  , an SMS
  , GPS ping
  or other type
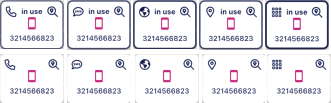
  of communication. You can tap the card to center the location on the map, but note that unless the communication is active, no location marker displays on the map. You can easily tell if the activity is active as the card flashes and displays "in use". Samples of each type of card is shown in the following graphic.
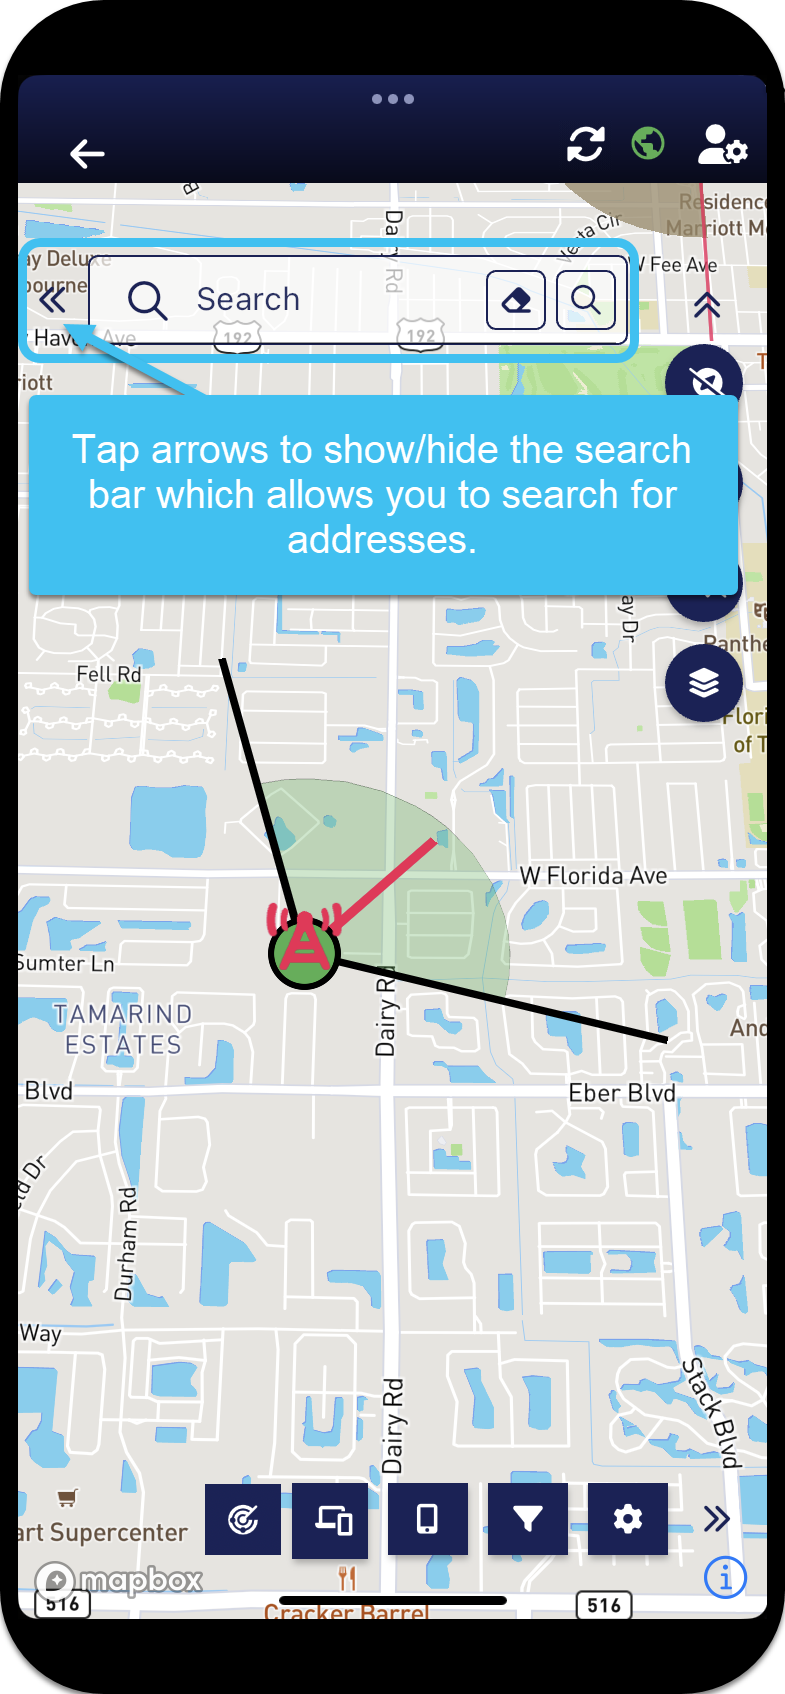
The map also provides a number of methods to help you navigate to a location. The search bar at the top of the screen, which you can show or hide by tapping the double arrows, allows you to search on locations such as street names.
When you select a location from the search bar a  is then added to the map. If you tap on the then you can create a navigation route from your current location to the . You can also tap and hold the map to choose, or tap on any event to create a navigation route.
  on the Phones panel also provides a navigation route to the most recent event for a phone which recalculates the route if an event with a new location occurs. It also provides you with the time of the latest event which gives you an idea of how long ago the event occurred. on the Alerts panel also allows you to navigate to the last triggered Smart Track alerts.
If you require step-by-step procedures on using any of the map's features, refer to Using the G-Scout App.
 Case
Case
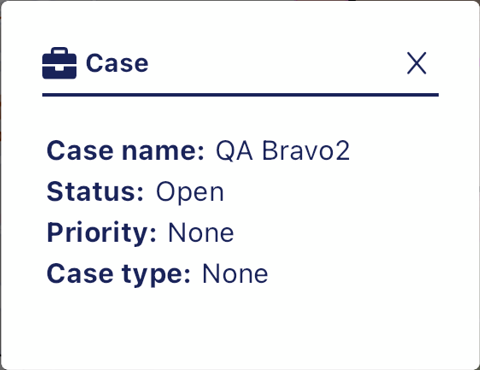
This icon is only displayed on the Analysis Center map screen, that is if you have opened the map from the Home screen via Cases.
Tap to display the details of the case you have open. This includes the case name, status, priority and case type.
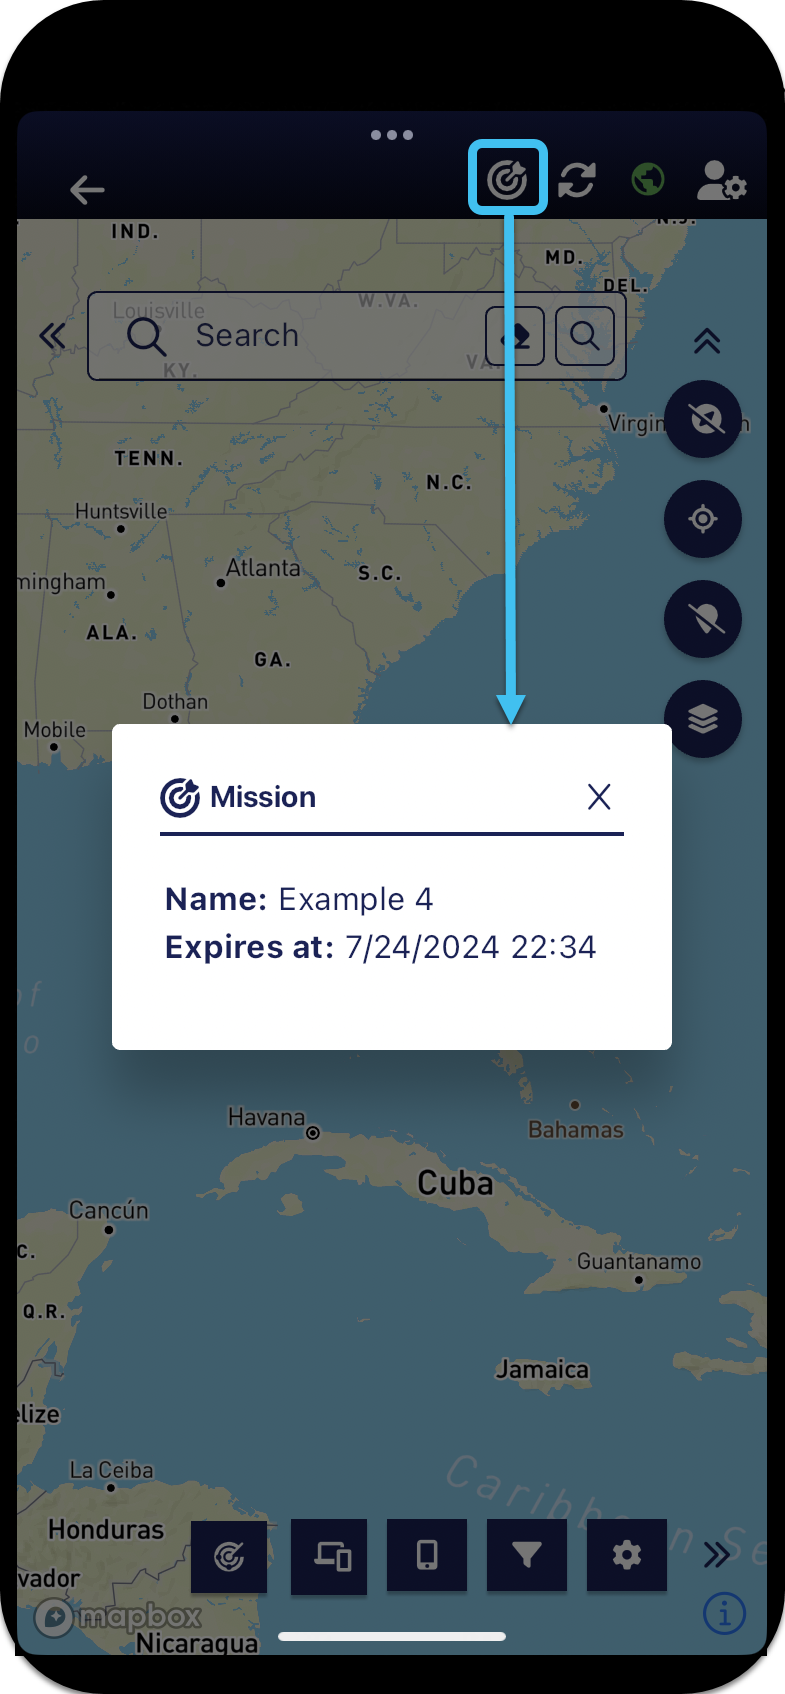
 Mission
This icon is only displayed on the Sentinel mission map, that is if you have opened the map from the Home screen via Missions.
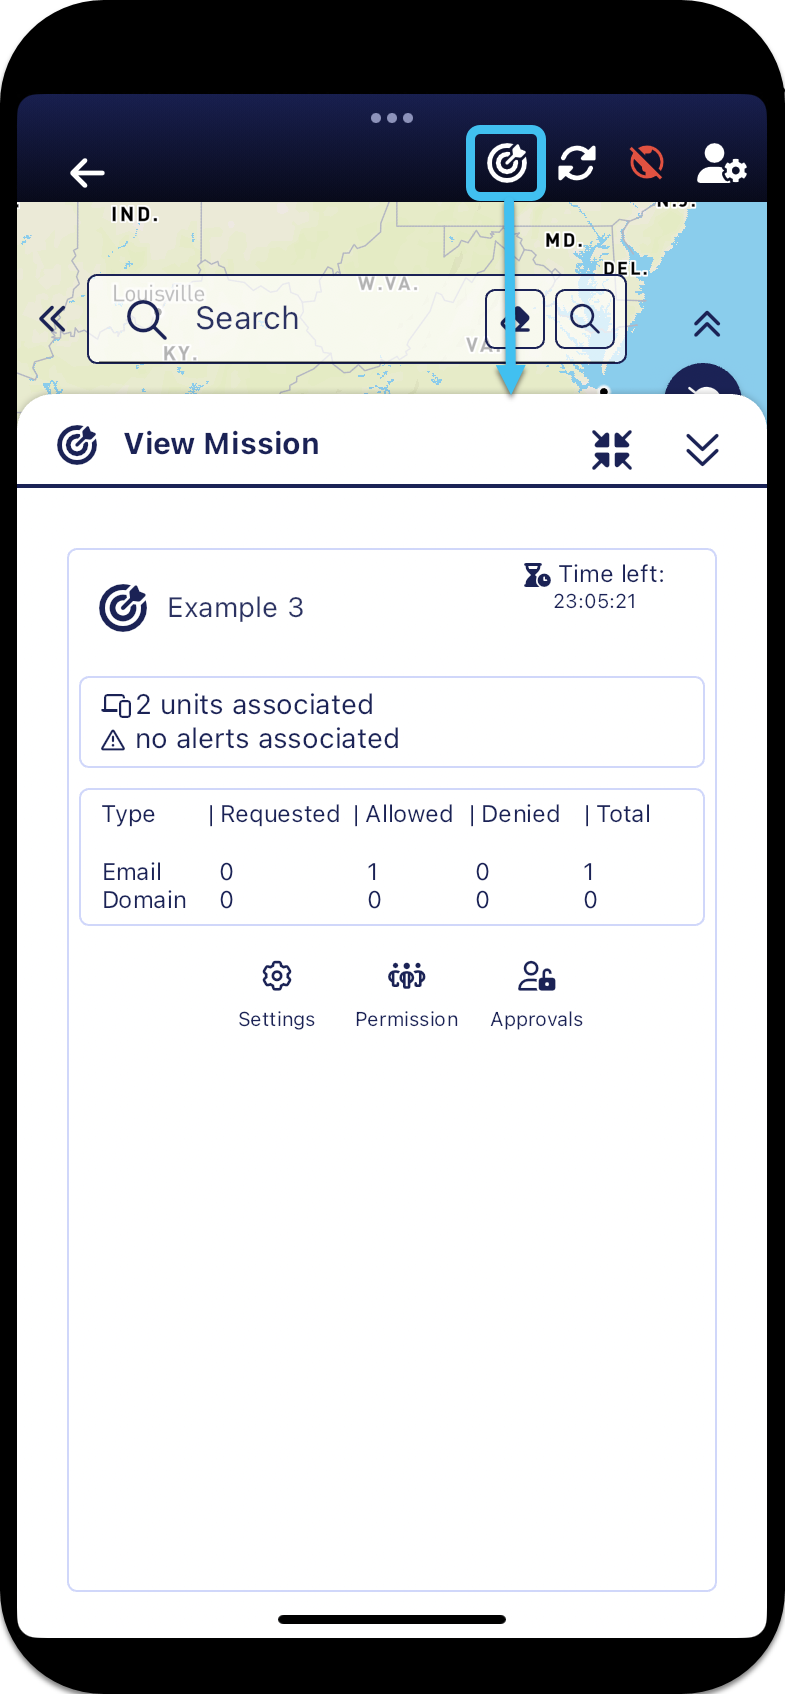
Tap to display the details of the mission you have open. This includes the mission name and the time the mission expires.
If you are the mission creator then the View mission panel opens which allows you to manage the mission's settings, permissions and approvals directly from the Sentinel mission map. These settings are coupled with those opened from the Missions screen.
 Refresh
Tap to refresh the data immediately, for example if a new unit has been added to a mission and you want to view its location.
 Connection status icon
This status icon informs you whether or not your G-Scout App is in an active session and the quality of it. The status icon changes in color depending on the following:
- Red: you have no connection so new data is not being displayed.
- Yellow: your connection is temporarily slow and new data may be delayed in being displayed.
- Green: you are connected and new incoming data is displayed.
 User preferences
Tap to open the User preferences panel which allows you to select the amount of past data displayed, based on either the last number of hours or the last number of known locations, and what color the data is displayed in so that you can quickly determine the age of the data.
 Map settings
Tap to open the Map settings panel which allows you to configure how you want the sectors displayed on the map, the icon size, and whether or not you want to display the buffer area around GPS pings and alerts.
 Activities
??? teamrev26.1 new>
Tap to open the Last Activities panel which displays the last voice, data, SMS, GPS ping and other communications for each phone, providing you with a timeline of the phone's last activities.
 Phones
Tap to open the Phones panel which lists the phones you are monitoring with real-time updates of their location. Which phones are displayed depends on how you opened the map screen; if you opened by tapping Sentinel on the Home screen then all phones you are monitoring are listed, if you tapped Cases or Missions then only the phones related to your selected case or mission are listed.
 Units
Units
Tap to open the Units panel which allows you to select which unit location data you want displayed on the map .
 Alerts
??? teamrev26.1 new>
Tap to open the Alerts summary panel which lists the Smart Track alerts you are monitoring with real-time updates of their location when they are triggered. Which alerts are displayed depends on how you opened the map screen; if you opened by tapping Sentinel on the Home screen then all alerts you are monitoring are listed, but if you tapped Cases or Missions then only the alerts related to your selected case or mission are listed.

 Filter
Tap to open the Filter panel which:
-
allows you to filter the data displayed on the Phones panel and the map by: data type, call direction, alert type, confidence level, date range, day of week and hour of day.
-
is displayed; when a filter is being applied is displayed.

 Compass
Tap to enable or to disable the map bearing view. When enabled the map zooms to your current location using your device's compass. When disabled the map remains at your location but is fixed in the north position. Note, you are unable to zoom to a phone event if the compass is enabled.
 Current location
Tap to zoom to your current location.

 Transmit your location
Tap to enable or to disable your location data being sent to OSS-ESPA.
When this is enabled your location data, which includes your current location and breadcrumb trail, is available for OSS-ESPA users to view on their Sentinel screen.
 Layer
Layer
Tap to open the Layer panel which allows you to select your preferred base map layer.

When you are following a navigation route this menu is displayed.
-
view the time, distance and arrival time.
-
Re-center: tap if you have moved your map to view another location and want to now re-center your location on the map.
-
Recalculate: tap if you take a wrong turn and prefer an immediate recalculation of the new route rather than awaiting the additional time required for an automatic recalculation.
-
View route: tap to display all the drive route on the map.
-
Cancel: tap to cancel the navigation.
 Auto-recalculate
When you are following a navigation route to the most recent event or to another field unit this displays at the bottom of the map. If you enable it then your navigation route is automatically recalculated when the target location moves by more than 500m.