Cell coverage tab
This topic describes the Cell coverage tab on the Case management view, which by default is located at the left of the ESPA analysis center screen.
This feature requires option E3 Drive data/analytics. If you do not have this option this tab is not available.
The Cell coverage tab displays the Favorites folder and all the cell coverage data for all the cell coverages you selected on the Case analyses tab. It allows you to select which cell coverage data is displayed on the map. It also allows you to display the cell tower details.
The Favorites folder is always displayed at the top of the list and contains the cell coverage results that you have added to it. The other cell coverages you have selected to open are listed below this and each are contained in their own folder.
For further information on using this tab refer to Viewing cell footprint analysis results.
NOTE: If you want to save your cell coverage configuration use Save cell coverage on the Case analyses tab.

Click to open or close the view. You can also click and drag the view border to change the view size.


Click to expand the view of the Case management view so that it displays the total width of the contents of the currently selected tab. If the view is expanded click to restore it to its previous size.

Click to display a list of all the tabs that are currently open on the Case management view. This is useful if you have a lot of tabs open as it provides an alternative method to select that tabs rather than locating them by scrolling along them.
The search area allows you to quickly locate data of interest. For example, you may want to search for a cell ID or EnodeB.
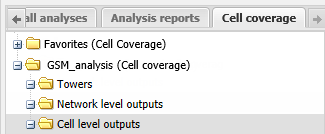
This folder contains information relating to the cell towers. The cell tower information that is displayed is from the one you selected in System on the Cell footprint analysis dialog box.
If you select all options then the towers are displayed as shown:
Select to display on the map all the cell sites that were included in the cell tower data file you selected for your analysis on the Cell footprint analysis dialog box. The cell sites are displayed as colored circles. The color of the circles for each operator can be different if your administrator has configured them with different colors. For example;

Select to display all the sectors that were included in the cell tower data file you selected for your analysis on the Cell footprint analysis dialog box. The sectors display as shown:
Select to display on the map all the cell IDs that were included in the cell tower data file you selected for your analysis on the Cell footprint analysis dialog box. The cell IDs display as shown:
These sector labels are required as they allow you to match the cell footprint results to the CDR data which is not possible using the Cell footprint labels. This is because the drive test results provide the Cell footprint labels using the Layer 1 identifiers (that is, PN, PSC, BSIC/BCCH) and the CDR uses Layer 3 identifiers (that is the Cell ID).
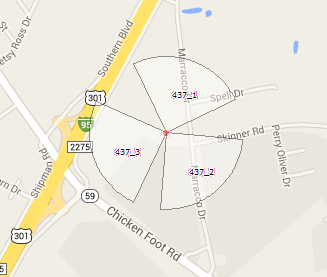
For GSM and UMTS the sector label only consists of one number but for CDMA it consists of the Cell ID and the Sector ID, for example 437-1, 437-2 and 437-3.
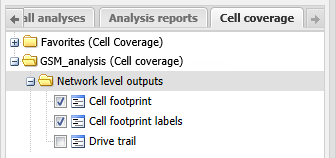
The Network level outputs folder contains the cell footprint analysis results at the network level, that is it contains the combined results of all cells. For GSM there is only ever one set of results but for other technologies you may have subfolders for each channel/frequency measured during the drive test.
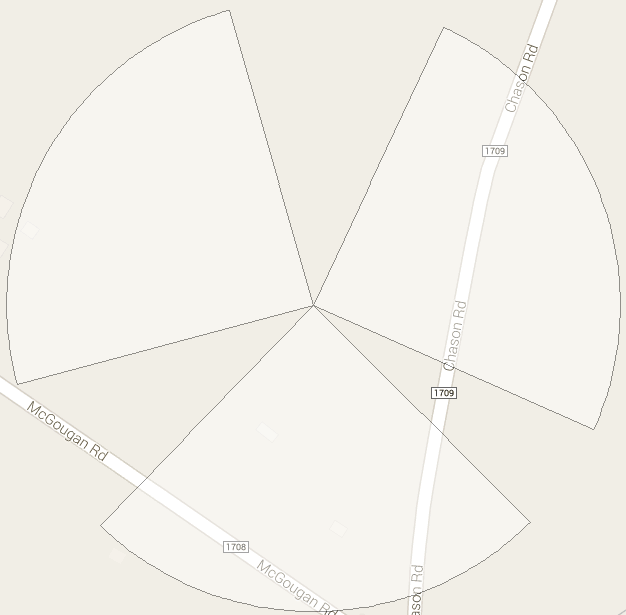
For GSM you only have one folder:
For other technologies you may have multiple subfolders:
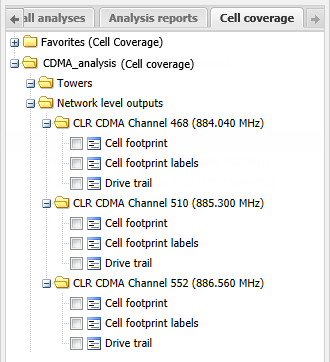
Select to display on the map the dominant areas of every cell measured during the drive test. The dominant area is the area in which each cell's received signal strength is higher than any other cell and therefore phone calls in that area will most likely use that cell.
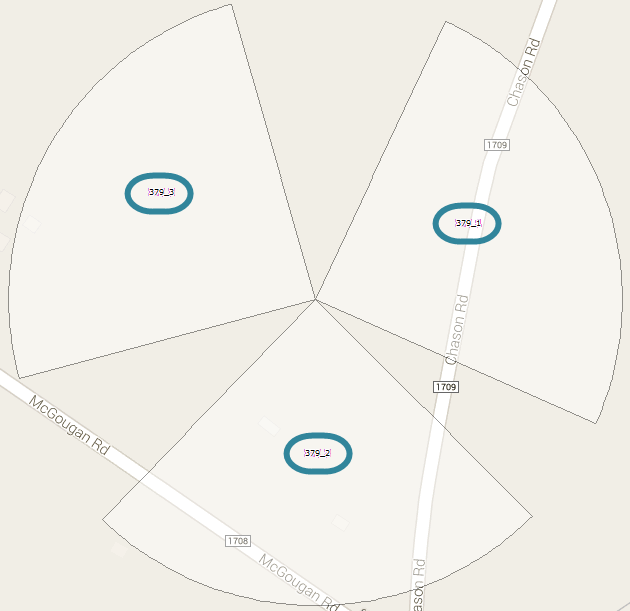
Select to display on the map the label obtained from the drive test that identifies each cell, for:
- GSM this is a combination of the Broadcast Channel and the Base Station Identity Code (BCCH_BSIC)
- CDMA this is the Psuedo Noise code (PN)
- UMTS this is the Primary Scrambling code (PSC)
- LTE this is the Physical Cell ID (PCI)
Select to display on the map the route you drove during the drive test.
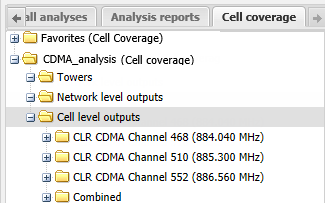
The Cell level outputs folder contains the cell footprint analysis results at the cell level, that is it contains the individual results of all cells. For GSM there is only ever one set of results but for other technologies you may have subfolders for each channel/frequency measured during the drive test along with a subfolder combining all the channel/frequencies. You should use the combined subfolder if you do not know which channel/frequency was used by the phone. This is the case in most instances as a CDR provides you with the Cell ID but not the channel/frequency. The combined subfolder takes the maximum combined coverage of all frequencies being transmitted from the cell. However if you do know which frequency/channel was used then select the individual channel/frequency.
For GSM you only have one folder:
For other technologies you may have multiple subfolders:
Select to display on the map the area in which the selected cell's signal power level is above the Coverage threshold set in the Cell footprint analysis dialog box. If this output is not displayed for a cell it means that the signal power level for that cell was never above the set threshold. If a suspect has been making multiple phone calls while driving, by selecting the coverage area of each cell that the suspect used it can help you identify the route they were driving.
The dominant areas is only displayed for GSM, UMTS, CDMA and EVDO; it does not display for LTE, NR and IoT.
Select to display on the map the area in which the selected cell is dominant. This means that the selected cell's received signal strength is higher than any other cell and therefore phone calls in that area will most likely use that cell. It is this same area that is displayed on the Network level outputs Cell footprint, except at the network level it displays this for every cell. If this output is not displayed it means that another cell with a higher received signal strength was transmitting over the same area.
Select to display on the map the areas in which the selected cell's signal level is in each signal level band. For the selected cell, the signal power level is represented on the map using different colors for each signal level band. The Legend/Filter view displays a key that details the ranges of each signal level band. These signal level bands are defined prior to running your cell footprint analysis in the Cell footprint analysis dialog box.
Signal contours allow you to visualize how the signal degrades geographically (from the green high power signals to red low power signals) as it propagates away from the cell tower. The signal contours clearly identify where the cell's signal cannot reach and therefore where calls physically cannot be made through the selected cell. This is very useful if you are challenging alibi locations.
Signal contours allow you to determine the most likely areas a phone was used. When a phone call occurs in a particular cell the most likely area for the phone's location is in the dominant area, however it may be outside this dominant area. If it is outside the dominant area it is most likely to be in an area where the cell's signal power is higher rather than lower. The signal contours show you the areas covered by each signal level band. This is useful if you need to identify a more specific area, for example if you need to physically search an area for a missing person the signal contours show you which areas have the highest power and therefore they are the more likely search areas. In a search case you should prioritize the dominant area, and then areas covered by the highest signal power.
As mentioned the signal contours most often increase your potential areas of interest from that shown by the dominant area, however there are occasions where it does the opposite and decreases potential areas of interest to less than that of the dominant area. For example if a cell is located near to a large expanse of water, it may show as being dominant over the area of water, however the signal contours may not cover much of the water indicating that the signal power level was so low that a call could not have been in that location even though the cell showed as being dominant over that area.
Select to display on the map the route you drove during the drive test. For the selected cell, the signal power level is represented on the map using different colors for each signal level band. The Legend/Filter view displays a key that details the ranges of each signal level band. These signal level bands are defined prior to running your cell footprint analysis in the Cell footprint analysis dialog box. Grey represents areas that you drove where no signal was detected by the selected cell.
Select to display on the map the route you drove during the drive test where signal was detected. The route is displayed using the same color as the coverage color. There is nothing displayed on the route where no signal was detected, unlike the Signal contour trail which displays grey dots.
For the analysis folder click to display Remove from map. This removes the cell coverage for the selected analysis from the map and automatically removes the analysis from the Cell coverage tab. Note, this option is not available on the Favorites folder if there are other analyses open on the Cell coverage tab. However, if the Favorites folder is the only cell coverage open then this removes the favorites cell coverage from the map and closes the Cell coverage tab.
For any analysis folder, including the Favorites folder, click to display Remove all from map. This removes the cell coverage for all the analyses from the map and closes the Cell coverage tab. Note, this option is not available on the Favorites folder if it is the only folder open on the Cell coverage tab, instead use Remove from map.
For the Favorites folder, click to display Run cell overlay analysis. This analysis helps you prioritize searches and identify likely locations of a phone if, for example, it is bouncing back and forth between towers.
For each folder click to display Clear all items. This clears all those items from the map.
For most folders click to display Select all. This selects all those items within the folder.
For the cell level output parent folders and the Favorites folder click to display the Select all - xxxx menu options. This selects all those items within the folder.
For any result you have selected then click to display Zoom to this. Select to zoom to that item on the map.
If you have the Narrative dialog box open then for any cell level output's Coverage area, Dominant area or Signal contours that you have selected then click to display Add to narrative. Select to add the output to your narrative. For further information refer to How to add cell level outputs to a narrative.
For any result click to display Add to favorites. The result is added to your Favorites folder. Note, the Favorites folder is always displayed at the top of the Cell coverage tab and on the Case analysis tab.
The Favorites folder is useful for adding important cell coverage results to so that you can easily reference them in the future.
For any result in the Favorites folder then click to display Remove from favorites. The result is removed from the folder. Note, the Favorites folder is always displayed at the top of the Cell coverage tab and on the Case analysis tab.
For any cell level output's Coverage area or Dominant area that you have selected then click to display Edit coverage color. This allows to change the default appearance of the cell's coverage area. You may want to change a coverage's appearance if the automatic selection of colors has placed coverages of a similar color side by side making the individual footprints difficult to distinguish between. This is also useful if you are creating reports and taking screen captures of the map where you want it to highlight specific coverages of interest as it also allows you to adjust the thickness of the coverage's boundary lines. For further information refer to Coverage color dialog box.