Case analyses tab
This topic describes the Case analyses tab on the Case management view, which by default is located at the left of the ESPA analysis center screen.
This feature requires your account to be configured with the ESPA analysis center screen.
The Case analyses tab displays all the analyses results detailed below. It also allows you to save separately your current map view, Data view selections, and your cell coverage map configuration.
It also displays a Favorites folder and a Saved narratives folder. The Favorites folder is where cell coverage results you have selected that have significant importance are added to. You select the favorite cell coverage results on the Cell coverage tab. The Saved narratives folder contains all the narratives saved by the case creator and case assignees. The Favorites and Saved narratives folders cannot be renamed, deleted, or have items other than the favorite cell coverage results or narratives saved to their respective folders.
When a cell footprint analysis completes it creates the following outputs:
- Analysis log: which details any warnings or errors that occurred during the analysis.
- Cell coverage: which allows you to open the Cell coverage tab to display on the map the cell coverage and labels detected in the drive test and the cell tower details selected for the analysis.
- Google earth export: this output is not generated by default but can be generated if you select it in the Advanced tab of the Cell footprint analysis dialog box prior to running your cell footprint analysis. This output allows you to download the same information that is available from the Cell coverage map and view it on Google Earth.
This feature requires option E4 Phone data/analytics. If you do not have this option then you cannot run a link analysis.
When a link analysis completes it creates the following outputs:
- Analysis log: which details a summary of the analysis.
- Link analyses: which opens the Link analysis tab to display the results of the analysis.
If you have more than one location in your case associated with geofence or tower dump files then a default target development analysis is automatically displayed on this tab. This analysis is named "Target development analysis default". Right-click on the output and select Open to display the data on the Target development view. You can also save your own target development analysis with your selected devices of interest on the Target development preview tab, which can also be viewed using the same process as for the default analysis.
This feature requires option E6 Public records data. If you do not have this option then you cannot request a CLEAR or Whooster match.
When a CLEAR or Whooster match request completes it creates the following output:
- Analysis log: which details a summary of the analysis.
This feature requires option E12 WiFi data/analytics. If you do not have this option then you cannot run a WiFi analysis.
When a WiFi analysis completes it creates the following outputs:
- Analysis log: which details any warnings or errors that occurred during the analysis. It also details the boundaries of the analysis area and the selected input parameters it was run on.
- WiFi clients: which details a summary of the WiFi clients including the SSID, MAC address and Client MAC address.
- WiFi clients location: which details the WiFi clients including the date, SSID, MAC address, Client MAC address and latitide/longitude.
- WiFi unassociated clients: which details the unassociated clients MAC address.
- WiFi unassociated clients location: which details the unassociated clients date, MAC address and latitide/longitude.
- WiFi coverage: which allows you to open the WiFi coverage tab to display the results of the analysis.
When a GAR snapshot has been downloaded into OSS-ESPA it creates a Snapshot Export folder which contains all the snapshots that you download into OSS-ESPA using the Download GAR Snapshot Report dialog box. From here, you can download in both .html and .csv format, and rename or delete the file.
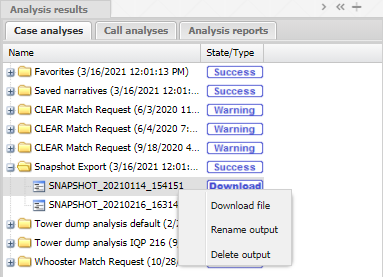
For further information refer to Downloading a GAR snapshot analysis created using the GAR software.
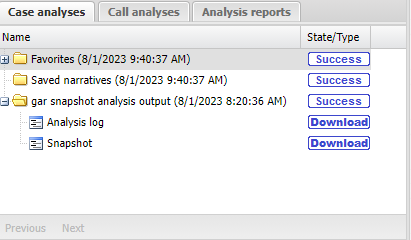
When a GAR snapshot analysis completes it creates the following outputs:
-
Analysis log: which details any warnings or errors that occurred during the analysis. It also details the boundaries of the analysis area and the selected input parameters it was run on.
-
Download: you can download an .html file which allows you to review the results of a snapshot analysis that you run using the Snapshot GAR analysis dialog box. The .html file also allows you to view the results in a .csv format.
For further information refer to Snapshot GAR analysis dialog box.
This feature requires option E7 Advanced CDRs. If you do not have this option this feature is not available.
When a precision location analysis completes it creates the following outputs:
- Map: this is for information only, it indicates that there is a saved map associated with the analysis. These open automatically when you open the Precision Loc result.
- Analysis log: which details a summary of the analysis.
- Precision Loc: which loads the map with the default analysis and opens the Precision location tab.
When a Google Earth Timeline export completes it creates the following outputs:
- Download: This output allows you to download the currently selected map layers to a KML format that you can then use in Google Earth. The same layers are exported as with Export map to Google Earth, however this export places the data into a timeline folder which allows you to adjust the timeline slider in Google Earth to display all the activity during a specific time-frame.
- Analysis log: which details a summary of the export.

Click to open or close the view. You can also click and drag the view border to change the view size.

Click to add a folder. Once your folder is added you can click it to save the current map view to it.


Click to expand the view of the Case management view so that it displays the total width of the contents of the currently selected tab. If the view is expanded click to restore it to its previous size.

Click to display a list of all the tabs that are currently open on the Case management view. This is useful if you have a lot of tabs open as it provides an alternative method to select that tabs rather than locating them by scrolling along them.
The Name displayed for the analysis is the name you entered in Report name on either the Cell footprint analysis, Link analysis, Tower analysis or WiFi footprint analysis dialog box.
For some results you cannot define the name:
- For a CLEAR or Whooster match request you cannot define the name at the time you request the match and by default it is named "CLEAR Match Request" or "Whooster Match Request" along with the date and time the match was requested.
-
If you have geofence or tower dump files in your case then a default target development analysis is automatically displayed and by default is named "Target development analysis default".
Note, you can rename an analysis by clicking it and selecting Rename analysis. The names for the individual results can also be changed by clicking it and selecting Rename output.
The State is displayed for the top level folder of each analysis and is either:
- Requested: indicates that you have requested the analysis and your request has been logged but not yet been placed in the queue for processing. The amount of time before it enters the queue is dependent on the number of previous requests have been processed.
- Queued: indicates that your analysis is in the queue for processing.
- Running: indicates the analysis is currently running but is not yet available for use.
- Success: indicates that the analysis has completed successfully.
- Error: indicates that the analysis was unable to complete. For further information on the errors you can download the Analysis log on the Case analyses tab.
- Warning: indicates that the analysis completed but there were some issues. For further information on the warnings you can download the Analysis log on the Case analyses tab.
The Type is displayed for the items within each results folder and is either:
- Coverage: indicates that the result contains the cell coverage maps generated from a cell coverage analysis. You can then open these results in the Cell coverage tab and select which cell coverage results you want displayed on the map.
- Download: indicates that the result can be downloaded and used in another tool, for example Google Earth.
- Map: indicates that the result is a map that you configured and saved using Save map view.
- Link: indicates that the result contains a link analysis. You can then open and view these results on the Link analysis tab.
- Tower: indicates that the result contains a tower analysis. You can then open and view these results on the Tower analysis tab.
- Narrative: indicates that the item contains a saved narrative. You can open and view the narrative on the map.
Click to navigate to the previous page of analysis results.
Click to navigate to the next page of analysis results.
Select an analysis folder then click to display a menu which contains Delete analysis. Click to delete the selected analysis result. A delete confirmation message is displayed temporarily on the map. Note, you cannot delete the Favorites and Saved narratives folders.
Select an analysis folder then click to display a menu which contains Rename analysis. Click to rename the selected analysis result. A rename confirmation message is displayed temporarily on the map and then the name is updated on your tab. Note, you cannot rename the Favorites and Saved narratives folders.
Select a folder that you manually created then click to display a menu which contains Save map view. Click to save the current CDR configuration to the currently selected analysis folder. A Save map view dialog box opens allowing you to enter a name for your map configuration.
Note, you cannot save a map to the Favorites folder or a folder created by an analysis.
The complete list of map details saved is:
- The case file number, phone user details, CDR data, sector data, target locations, timeline, contact data, TA data, HO data, public records, geo-locations and maps.
- The map zoom.
- Any filters, column selections and column ordering applied to any tabs.
- The calls and call locations that are selected on the CDR data tab.
- The sectors that are selected on the Sector data tab.
- The target locations that are selected on the Target locations tab.
- The address locations and the record usage that are selected on the Public records tab.
- The TA arcs that are selected on the TA data tab.
- The handovers that are selected on the HO tab.
- The geo-locations that are selected on the Geo-loc data tab.
NOTE: The coverage maps are not saved along with these details. To save coverage maps use Save cell coverage and Save WiFi coverage.
This setting is only available if the Cell coverage tab is open. Select a folder which currently has an analysis open on the Cell coverage tab then click to display a menu which contains Save cell coverage. Click to save the Cell coverage tab's current cell coverage configuration to the currently selected analysis folder. A Save coverage dialog box opens allowing you to: select the cell coverage analysis you want to save (only if multiple are open), select which folder to save it to and to enter a name for your cell coverage configuration. Note, the only folders you can save to are those that currently have a cell coverage analysis open on the Cell coverage tab and those folders you manually created.
Note, you cannot save cell coverage to the Favorites and Saved narratives folders.
NOTE: The map configuration details are not saved along with the cell coverage map. To save the map configuration details use Save map view.
This setting is only available if the WiFi coverage tab is open. Select a folder which currently has an analysis open on the WiFi coverage tab then click to display a menu which contains Save WiFi coverage. Click to save the WiFi coverage tab's current WiFi coverage configuration to the currently selected analysis folder. A Save coverage dialog box opens allowing you to select which folder to save it to and to enter a name for your WiFi coverage configuration. Note, the only folders you can save to are that which you currently have a WiFi coverage analysis open for on the WiFi coverage tab and those folders you manually created.
Note, you cannot save WiFi coverage to the Favorites and Saved narratives folders.
NOTE: The map configuration details are not saved along with the WiFi coverage map. To save the map configuration details use Save map view.
Select a Map output result then click to display Show on map. This removes all the map configuration currently displayed on the map and in the Data view and then displays the information you selected. If there is also cell coverage configuration displayed on the map from the Cell coverage tab it remains on the map. If you also need to remove the cell coverage use Remove from map on the Cell coverage tab.
Select a Map, Coverage, Tower, Precision Loc or a Download output result then click to display a menu which contains Delete output. Click to delete the selected analysis output result. A delete confirmation message is displayed temporarily on the map.
If a Map or Coverage result is currently being displayed on the map you cannot delete it, you must remove it from display first. To do this for a Map output you must either select to display another Map output or click Refresh or Refresh data, and for a Coverage output you must use Remove from map on the Cell coverage tab.
Note, the "Cell Coverage" result in the Favorites folder cannot be deleted.
Select a Map, Coverage, Tower, Precision Loc or a Download result then click to display Rename output. A Rename output dialog box opens allowing you to enter a new name for your output result.
Note, the "Cell Coverage" result in the Favorites folder cannot be renamed.
Select a Coverage, Tower, Precision Loc or Link result then click to display Open.
- Click Coverage then Open to display the selected cell coverage analysis on the map. A Cell coverage tab containing the configuration of the cell coverage analysis also opens. Note, the "Cell Coverage" result in the Favorites folder automatically opens on the Cell coverage tab when you select any cell coverage analysis.
- Click Link then Open to display the Link analysis tab containing the link analysis results.
- Click Precision Loc then Open to display the default precision location analysis on the map and open the Precision location tab.
- Click Tower then Open to display the Tower analysis tab containing the tower analysis results.
Select a Narrative result then click to display Open narrative. The Narrative dialog box opens displaying the events for the selected narrative. If you attempt to open a narrative that you did not create you are prompted to save it with a new name. Narratives which you did not create show the narrative result as colored on the Case analyses tab.
NOTE: When you open your narrative you must ensure all the events that you added to your narrative are available on the ESPA analysis center screen, for example you must ensure the applicable phone numbers are selected in Sources or that the original source files such as the CDR files have not been deleted from the case. If any events are not available a message is displayed detailing which are missing and if you proceed then these events cannot be replayed.
Select a Narrative result then click to display Rename narrative. A Rename narrative dialog box opens allowing you to enter a new name for your saved narrative. Note, this menu item is only available if you created the narrative as only the person who created the narrative can rename it. Narratives which you did not create show the narrative result as colored on the Case analyses tab.
Select a Narrative result then click to display Delete narrative. Click to delete the selected saved narrative. A delete confirmation message is displayed on the map. Note, this menu item is only available if you created the narrative as only the person who created the narrative can delete it. Narratives which you did not create show the narrative result as colored on the Case analyses tab.
Some analysis results are available to download these are displayed with Download. Select the result you want to download then click to display Download file.