Cell footprint analysis dialog box
This topic describes the purpose of the Cell footprint analysis dialog box, how to access it and all the settings and buttons on it.
This feature requires option E3 Drive data/analytics. If you do not have this option you cannot access the Cell footprint analysis dialog box.
The Cell footprint analysis dialog box allows you to select applicable drive test devices and a cell tower data file to run your analysis on. The advanced settings allow you to edit settings associated with the output grids, signal coverage threshold and bands, or to generate a downloadable Google Earth output. Once you have made these selections it allows you to run your analysis.
NOTE: The drive test files that are available for selection on this dialog box are also filtered by the map area that is displayed on the ESPA analysis center screen.
If you require information on running an analysis refer to Preparing cell footprint analysis evidence.
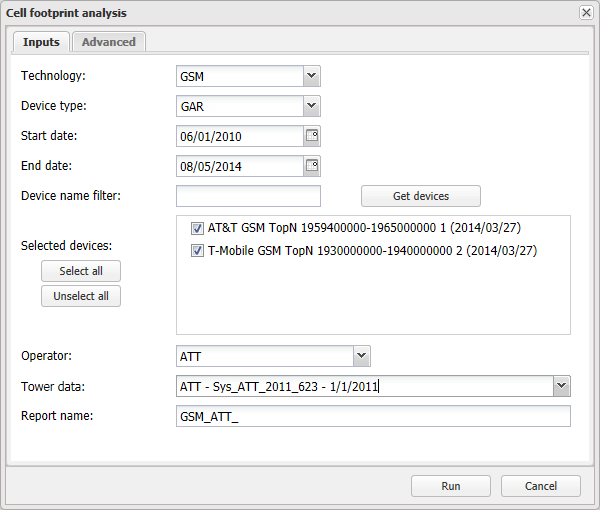
This setting is mandatory. Select the technology used by the phone user's phone. The CDR data displayed on the ESPA analysis center screen details the technology that was used for each call.
This setting is used to filter the drive test devices that are available within the map area that is displayed on the ESPA analysis center screen.
This setting is mandatory. Select the start date you want used to filter the drive test devices that are available within the map area that is displayed on the ESPA analysis center screen.
This setting is mandatory. Select the end date you want used to filter the drive test devices that are available within the map area that is displayed on the ESPA analysis center screen.
If you have a naming convention for your drive test filters you may want to enter part of the name to further filter the drive test devices within the map area that is displayed on the ESPA analysis center screen.
Click to display all the available drive test devices that match the criteria that you have selected on this tab in addition to them being within the map area that is displayed on the ESPA analysis center screen.
Displays all the available drive test devices that match the criteria that you have selected on this tab in addition to them being within the map area that is displayed on the ESPA analysis center screen. Use Select all, Unselect all and the check boxes to select which drive test devices you want used in the analysis.
NOTE: For a device to be displayed it must first be approved on the GAR drive management screen. If there are unexpected devices displayed they may be from invalid or test drives. If required, you can remove these drives using the GAR drive management screen.
Select the operator used by the phone user's phone. This setting is used to filter the cell tower data files that are available to select in Tower data.
Select the applicable cell tower data file you want used in the analysis. This cell tower data file must be for the operator used by the phone user's phone, cover the location of the incident and be applicable to the date of the incident. This cell tower data file is used to display the cell tower locations and sectors on maps for visual correlation purposes. If selected here, the sites and sectors within the boundaries of the current map display are shown in the analysis outputs, such as the Cell footprint map and Google Earth export.
The options displayed in the drop-down are automatically listed based on the most recent tower data from the date you selected in End date. If you happen to go back and edit the End date then this setting is automatically updated with the most recent data from your new end date.
This setting is mandatory. Enter a name for your analysis report. By default the report name is prefixed with the technology and the operator you selected but you can change this if required. When this analysis is run this report name is then displayed on the Case management view's Case analyses tab.
Click to close the dialog box without applying any changes you may have made.
Click to run the selected analysis. Depending on the analysis being run it may take between 10 to 30 minutes. The status and results are displayed on the Case management view's Case analyses tab using the Report name you entered.

Enter the bin size of the output grids. This determines the output resolution of the Cell footprint analysis. The higher the resolution the smoother the output coverage maps appear but the analysis will take longer to complete and the results will occupy more disk space. For example, if you only require a quick basic analysis you may want to use a bin size of 100 meters rather than the 50 meters default and in dense urban areas with a smaller cell coverage it is recommended you use a higher resolution, for example 25 meters.
Default: 50 meters
Enter the distance to be used outside the data points in the drive data file to create the grid boundaries used in the Cell footprint analysis. The Cell footprint analysis uses interpolation of drive test data to determine the coverage area of each cell. Buffer distance allows coverage areas to be extended outside of the drive test area up to the specified buffer distance using extrapolation.
Default: 500 meters
Enter the minimum number of drive test data points necessary to allow grid interpolation per cell. To allow accurate interpolation there must be sufficient data points. If the number of data points for a particular cell are limited it can impact the overall Cell footprint analysis output, including the outputs of other cells. This setting allows you to ignore cells that do not contain the specified number of data points therefore preventing them impacting the overall Cell footprint analysis output.
Default: 25
Select if you want the analysis to include a downloadable output that you can use in Google Earth. Once prepared this output is available on the Case management view's Case analyses tab.
Select if you want OSS-ESPA to match the layer 3 data gathered by the GAR unit and saved in the drive test file, with the cell data that is in the tower data file. Select either:
- None: no matching is done.
-
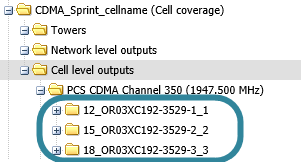
Cell name: the layer 3 data is matched with the cell name data, and the cell name is displayed on the Cell coverage tab and the map view.
-
Cell ID: the layer 3 data is matched with the cell ID data, and the cell ID is displayed on the Cell coverage tab and the map view. This is the default setting.

Select the minimum power level you want the analysis to display results for. This setting effects the Coverage area result.
Select the number of signal contour bands you want the analysis to use then use Signal contour band thresholds to set the lower limit of each band. You can select a maximum of five. This setting effects both the Signal contours and Signal contour trail results.
Select the lower limit of each signal counter band. The number of bands you can select values for is defined by the setting of Number of signal contour bands. This setting effects both the Signal contours and Signal contour trail results.
Click to close the dialog box without applying any changes you may have made.
Click to run the selected analysis. Depending on the analysis being run it may take between 10 to 30 minutes. The status and results are displayed on theCase management view's Case analyses tab using the Report name you entered.