Viewing cell footprint analysis results
This topic describes how to view Cell footprint analysis results.
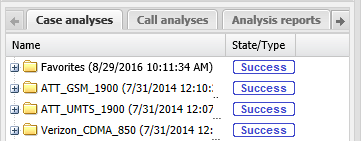
The Cell footprint analysis results are displayed on the ESPA analysis center screen's Case management view on the Case analyses tab. By default the analysis generates the cell coverage and also an analysis log download. From the Case analyses tab you can open the cell coverage result. The cell coverage details open on the Cell coverage tab where you can select which components of the cell coverage you want displayed on the map. You can open multiple cell coverage results on the Cell coverage tab at any one time allowing you to view the cell coverage from multiple operators and multiple technologies. You can also add cell coverage results that are of significant interest into a Favorites folder. If you require an overview of these tabs or a detailed description of their settings refer to the Call analyses tab and the Cell coverage tab.
The Case analyses tab is also useful for saving map views without running a Cell footprint analysis. For further information refer to Saving the map view.
Running a cell footprint analysis requires option E3 Drive data/analytics. If you do not have this option, Analysis is not available on the Input and settings view of the ESPA analysis center screen.
After you have run your analysis as described in Preparing cell footprint analysis evidence you can view the results once the analysis has completed successfully. You will know when your analysis is complete when the state of your analysis on the Case analyses tab changes to Success or Warning.
You can view the cell coverage results using either of the following procedures:
- Open your case on the ESPA analysis center screen and set the map to display the case information you require, such as the desired phone numbers and the date range.
-
On the Case management view's Case analyses tab click the analysis folder you want to review the results for. The folder opens and displays the result outputs.
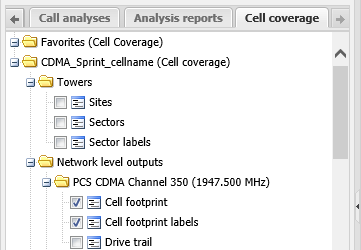
- To display on the map the cell coverage and labels detected in the drive test click Cell coverage then select Open. The Cell coverage tab opens.
-
For GSM the Cell footprint and the Cell footprint labels are selected by default and are automatically displayed on the map. For other technologies, unless you only selected one channel/frequency for your cell footprint analysis, you must select the cell footprint and cell footprint labels for the channel/frequency that you want to display on the map.
- Click Cell footprint and then select Zoom to this. The map zooms to display the selected cell footprint.
-
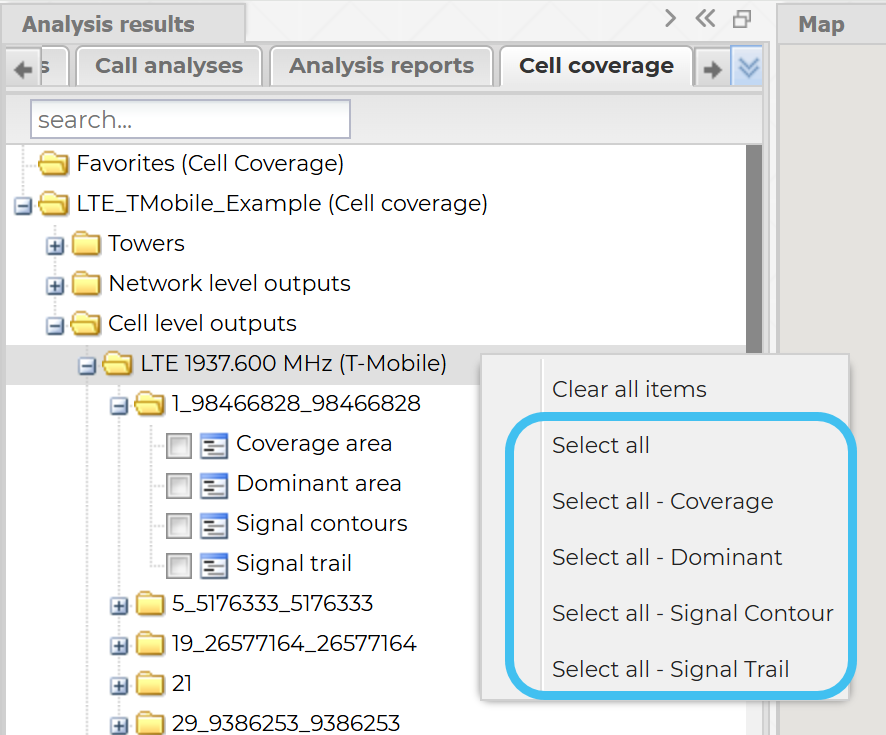
You can use the Cell coverage tab to display a variety of cell coverage data. In addition to the network cell footprint and labels described in the previous steps you can also display cell level outputs which includes each cell's coverage area, dominant area, signal contour and signal trail. For example:
- you may only be interested in displaying the coverage area of two cells including all the network cell footprint labels so you would:
- In Network level outputs, deselect the network level Cell footprint, and select the Cell footprint labels, and
- In Cell level outputs, open the subfolder for each cell you are interested in and select Coverage area.
-
you can use the Select all menu items to quickly select what you want displayed on the map.
-
Select all - Coverage, Select all - Dominant, Select all - Signal Contour and Select all - Signal Trail are available on the cell level output parent folder and the Favorites folder.
-
Select all is available on a number of folders such as the cell level output subfolder.
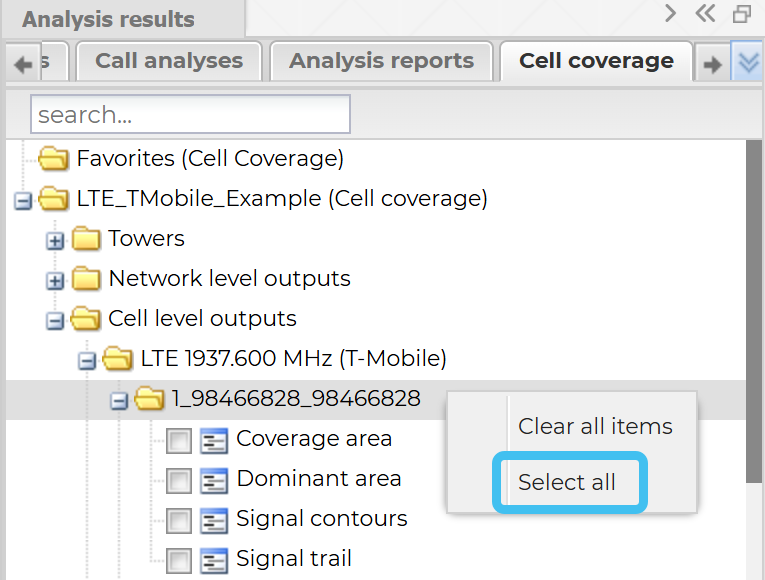
Click here for a short video showing the use of the Select all menu items.
-
For further information on the cell coverage selections refer to Cell coverage tab.
- you may only be interested in displaying the coverage area of two cells including all the network cell footprint labels so you would:
- You can also now use the map features described in Using the ESPA analysis center map and Viewing and configuring sectors to inspect the analysis results.


This method allows you to display cell coverage results directly from the map by selecting the sector of interest.
- Open your case on the ESPA analysis center screen and set the map to display the case information you require, such as the desired phone numbers and the date range.
-
On the Case management view's Case analyses tab click the analysis folder you want to review the results for. The folder opens and displays the result outputs.
- To display on the map the cell coverage and labels detected in the drive test click Cell coverage then select Open. The Cell coverage tab opens.
-
On the map of WNF analysis center click
, or for ESPA analysis center click , then select from the menu the cell coverage result you want to display then click the sector that you are interested in. For further information on each of the cell coverage selections refer to Cell coverage tab.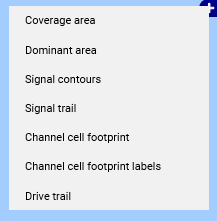
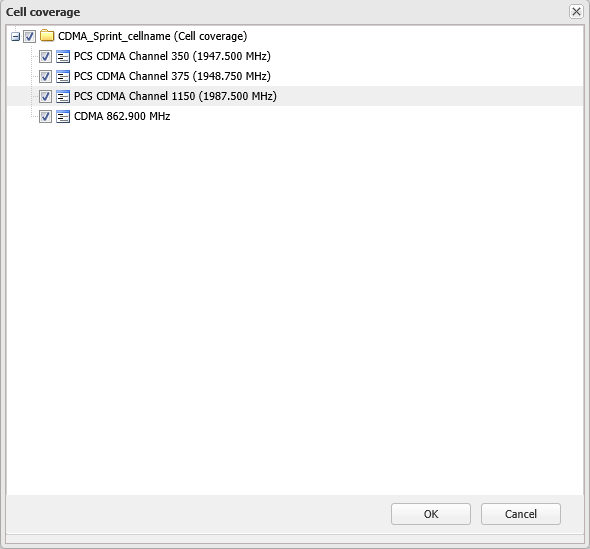
If you have more than one analysis open on the Cell coverage tab or more than one channel that provides cell coverage for the selected sector then the Cell coverage dialog box opens allowing you to select the coverage analysis of interest.
To remove the cell coverage result from the map click the sector once more.
- You can also now use the map features described in Using the ESPA analysis center map and Viewing and configuring sectors to inspect the analysis results.
If you want to save the cell coverage configuration that you currently have displayed use either of the following procedures:

Click
then select Save cell coverage.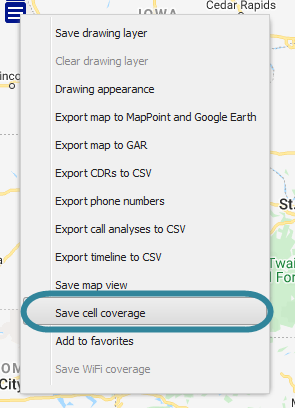
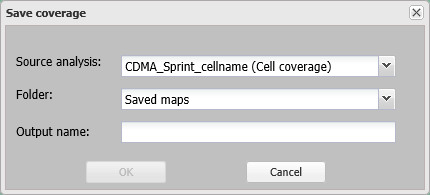
The Save coverage dialog box opens.
This step is only applicable if you have multiple cell coverage analyses open on the Cell coverage tab, if you do not have multiple analyses open then this setting is not displayed.
In Source analysis select which cell coverage analysis you want to save.
- In Folder select which folder you want to save the cell coverage configuration to. The folders that are available to select are those of the cell coverage analyses that you currently have open and of those you manually created on the Case analyses tab. There is also a folder named Saved maps which creates a new folder with that name if it is not already created, or you can enter your own folder name.
- In Output name enter a name for your cell coverage map then click OK. Your new cell coverage map is saved and displayed on the Case management view on the Case analyses tab under the folder you selected.
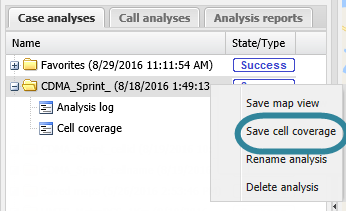
On the Case analyses tab select the folder you want the cell coverage configuration saved to and select Save cell coverage.
The Save coverage dialog box opens.
NOTE: Save cell coverage is only displayed for folders that currently have a cell coverage result open on the Cell coverage tab.
This step is only applicable if you have multiple cell coverage analyses open on the Cell coverage tab, if you do not have multiple analyses open then this setting is not displayed.
In Source analysis select which cell coverage analysis you want to save.
- In Folder select which folder you want to save the cell coverage configuration to. The folders that are available to select are that of the cell coverage analysis you have selected and of those you manually created on the Case analyses tab. There is also a folder named Saved maps which creates a new folder with that name if it is not already created, or you can enter your own folder name.
- In Output name enter a name for your cell coverage map then click OK. Your new cell coverage map is saved and displayed on the Case management view on the Case analyses tab under the folder you selected.
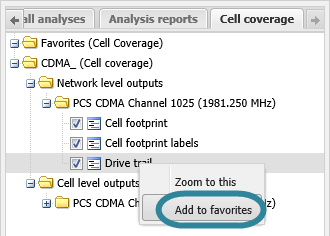
You can add cell coverage results to the Favorites folder using either of the following procedures:
This method allows you to add cell coverage on an individual results basis directly from the Cell coverage tab.
-
On the Cell coverage tab click any result and select Add to Favorites. The result is added to the Favorites folder displayed at the top of the tab.
This method allows you to add all the cell coverage results that you currently have displayed on the map to the Favorites folder.
-
On the map ensure the cell coverage results you want added to your Favorites folder are displayed. For further information on displaying them refer to How to view cell coverage results.
-
Either click
or right-click anywhere on the map to display the map menu then select Add to favorites. The cell coverage results that you currently have displayed on the map are added to the Favorites folder displayed at the top of the Cell coverage tab.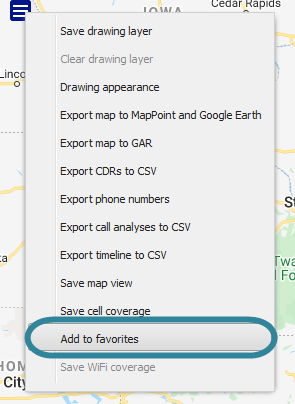
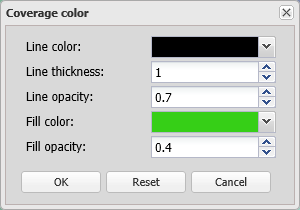
You may want to change a coverage's appearance if the automatic selection of colors has placed coverages of a similar color side by side making the individual footprints difficult to distinguish between. This is also useful if you are creating reports and taking screen captures of the map where you want it to highlight specific coverages of interest as it also allows you to adjust the thickness of the coverage's boundary lines. You can edit the outline and fill of specific cells using the following procedure.
- Open the Cell coverage tab as described in How to view cell coverage results and ensure it displays the case information you require, such as the desired phone numbers and the date range.
-
On the Cell coverage tab, for each cell you want on the map, select the output type you want to display either: Coverage area or Dominant area then click the output and select Edit coverage color. The Coverage color dialog box opens.
-
Edit the settings as required then click OK. The dialog box closes and the cell's appearance is updated on the map.
After you have run your analysis as described in Preparing cell footprint analysis evidence you can view the results once the analysis has completed successfully. You will know when your analysis is complete when the state of your analysis on the Case analyses tab changes to Success or Warning.
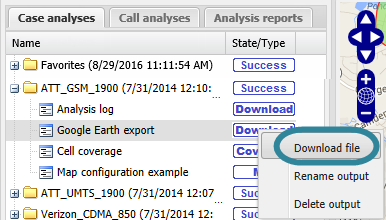
NOTE: To obtain a Google Earth export you must select the Run Google Earth export setting in the Advanced tab of the Cell footprint analysis dialog box before you run your analysis.
-
On the ESPA analysis center screen's Case management view's Case analyses tab click the analysis folder you want to export the results for.
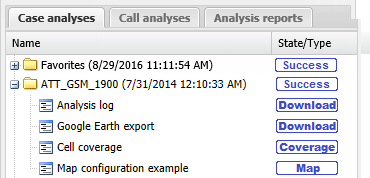
The folder opens and displays the result outputs.
- Click Google Earth export.
-
Select Download file then follow your Internet Explorer prompts to save and open the file in Google Earth.