Live Monitoring screen
This topic provides an overview of the Live Monitoring screen and all the settings and buttons on it. However if you require step-by-step procedures on using live monitoring refer to Using Live monitoring for wiretaps.
This feature requires option E19 Sentinel content log. If you do not have this option this feature is not available.
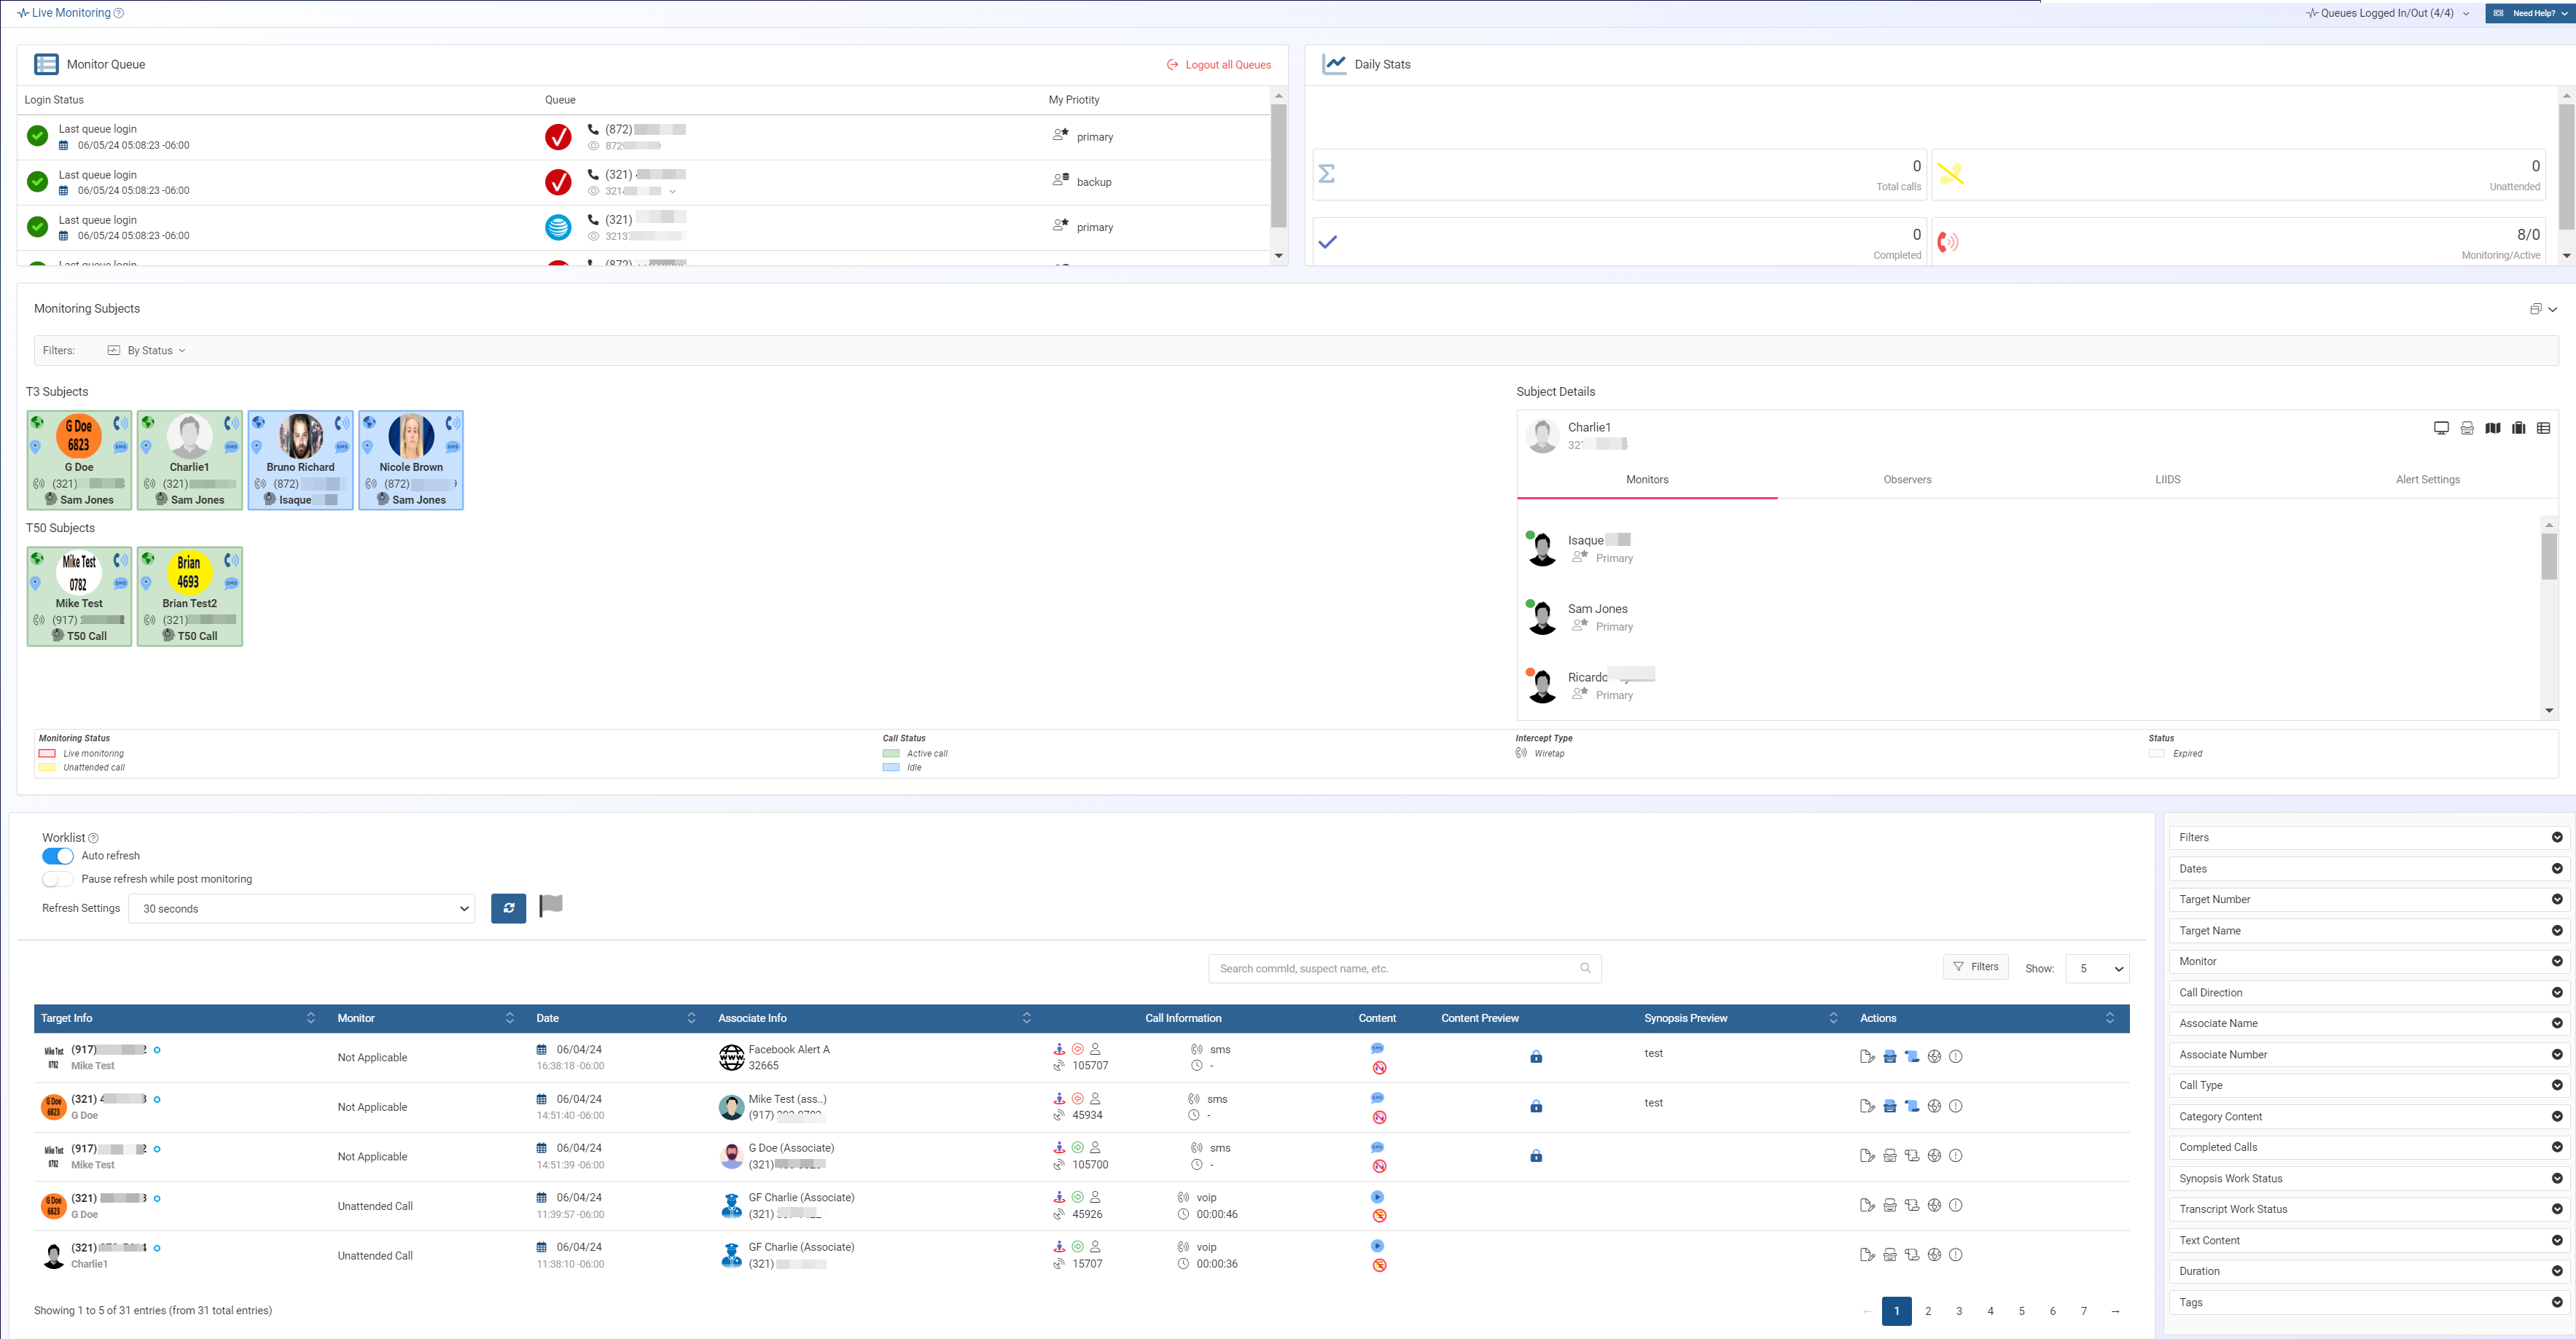
The Live Monitoring screen allows you to monitor and manage voice, SMS, MMS, social media, and data communication, for example email, Web browsing and file downloads that you have been given legal permission to monitor.
When a voice call occurs, you can listen to it live while entering the call's synopsis. When the call is complete it appears in your Worklist, where you can then replay the recording and complete the call's associated tasks such as categorization, synopsis and transcript.
SMS, MMS, social media, data and fax calls are also displayed in your Worklist, allowing you to view them and manage the tasks associated with them.
The Worklist is also available on the Evidence Management and Reporting screen and any changes you make on either screen are immediately updated on the other.
The filter, to the left of the Worklist allows you to quickly find the item you are looking for. For further information, refer to How to create worklist filters.
If you are listening to a call and you unexpectedly loose connection, for example your browser crashes, then the call is automatically routed to another monitor. During the time no monitor is listening to the call, it is minimized.
This screen also provides you with a summary of the number of calls over the calendar day.
What you can view, listen to, and change on the screen depends on what permissions your administrator has set up for you.
-
a user with no monitor permissions:
-
you can only view communications for cases you have permission on.
-
you can only access communications (voice, text, data) classified with the following categories: Pertinent, Non pertinent, No Conversation.
-
you are unable to change a communication's category.
-
you are able to create interactive html reports of pertinent monitoring evidence data required for court procedures using the Evidence Management and Reporting screen. For communications classified with categories you have permission to access, the report can include the voice, text and data content of the communications along with the register data such as the comm # and location; for all other categories the report will only include the register data.
-
-
a user with monitor permissions of either User or Station:
-
you can access communications (voice, text, data) classified with the following categories: Not Monitored, Uncategorized, Pertinent, Non pertinent and No Conversation.
-
you are able to change a communication's category for the phones that you are monitoring.
-
you are able to create interactive html reports of pertinent monitoring evidence data required for court procedures using the Evidence Management and Reporting screen. For communications classified with categories you have permission to access, the report can include the voice, text and data content of the communications along with the register data such as the comm # and location; for all other categories the report will only include the register data.
Note, a station user account is configured to work in a station usage model where the user firstly logs on using a station account and then enter their name and badge number and any optional information specified by their administrator.
-
-
a user with monitor permissions of either User supervisor or Station supervisor:
-
you can access communications (voice, text, data) classified with the following categories: Not Monitored, Uncategorized, Pertinent, Non pertinent and No Conversation.
-
you are able to change a communication's category for the phones that you are monitoring.
-
you are able to create interactive html reports of pertinent monitoring evidence data required for court procedures using the Evidence Management and Reporting screen. For communications classified with categories you have permission to access, the report can include the voice, text and data content of the communications along with the register data such as the comm # and location; for all other categories the report will only include the register data.
-
can create queues and listen in to live calls alongside the monitor.
-
you can create global filters.
Note, a station supervisor account is configured to work in a station usage model where the supervisor firstly logs on using a station account and then enter their name and badge number and any optional information specified by their administrator.
-
-
a user with monitor permissions of Administrator:
-
you have the same access to communications and the ability to change call classification as a User, Station, User supervisor, Station supervisor but you can also access communications with any category including Privileged and Blocked.
-
you are able to create interactive html reports of pertinent monitoring evidence data required for court procedures using the Evidence Management and Reporting screen for all cases, even those that you are not a monitor on. For communications classified with all categories with the exception of Privileged and Blocked, the report can include the voice, text and data content of the communications along with the register data such as the comm # and location; for Privileged and Blocked categories the report will only include the register data.
-
can create queues and listen in to live calls alongside the monitor.
-
you can create global filters.
-
Wiretap audio file verification
The intercepted wiretap audio files are validated using Cyclical Redundancy Checking (CRC) hash verification, a process that generates a unique digital fingerprint, called a CRC hash, from the exact data in the recording at the time it was captured. This hash value is later recalculated and compared whenever the file is accessed or prepared for evidence. If any portion of the file had been altered, even by a single bit, the CRC hash would not match. Because all CRC hash values for the intercepted recordings remained identical from the time of interception through their submission into evidence, this confirms that the audio content has remained complete, authentic, and unaltered.
If you require information on using live monitoring refer to Using Live monitoring for wiretaps.
Click to display important status information which allows you to confirm that your Live monitoring is functioning correctly. All indicators must be green. If any are red, contact Gladiator Forensics support.
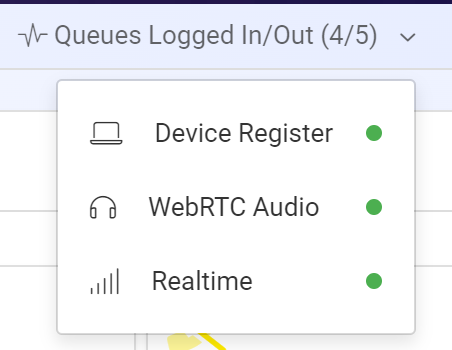
- Device register indicates whether or not the Live monitoring screen is registering the PBX server.
- WebRTC Audio indicates whether or not the Live monitoring screen is receiving the audio.
- RealTime indicates whether or not the real time communication is receiving correctly.
This section lists all the queues that you are assigned to monitor and displays whether or not you are logged into the queue. From here you can log in and out of all queues, log in and out of individual queues, and view the intercept details including whether you or a primary or backup monitor.
 and
and 
Click to log in or out of all your live monitoring queues. It is only when you are logged in that active calls are routed to you. It is therefore important that you log in to start live monitoring and log out once you are complete.
If required you can also log in and out of individual queues.
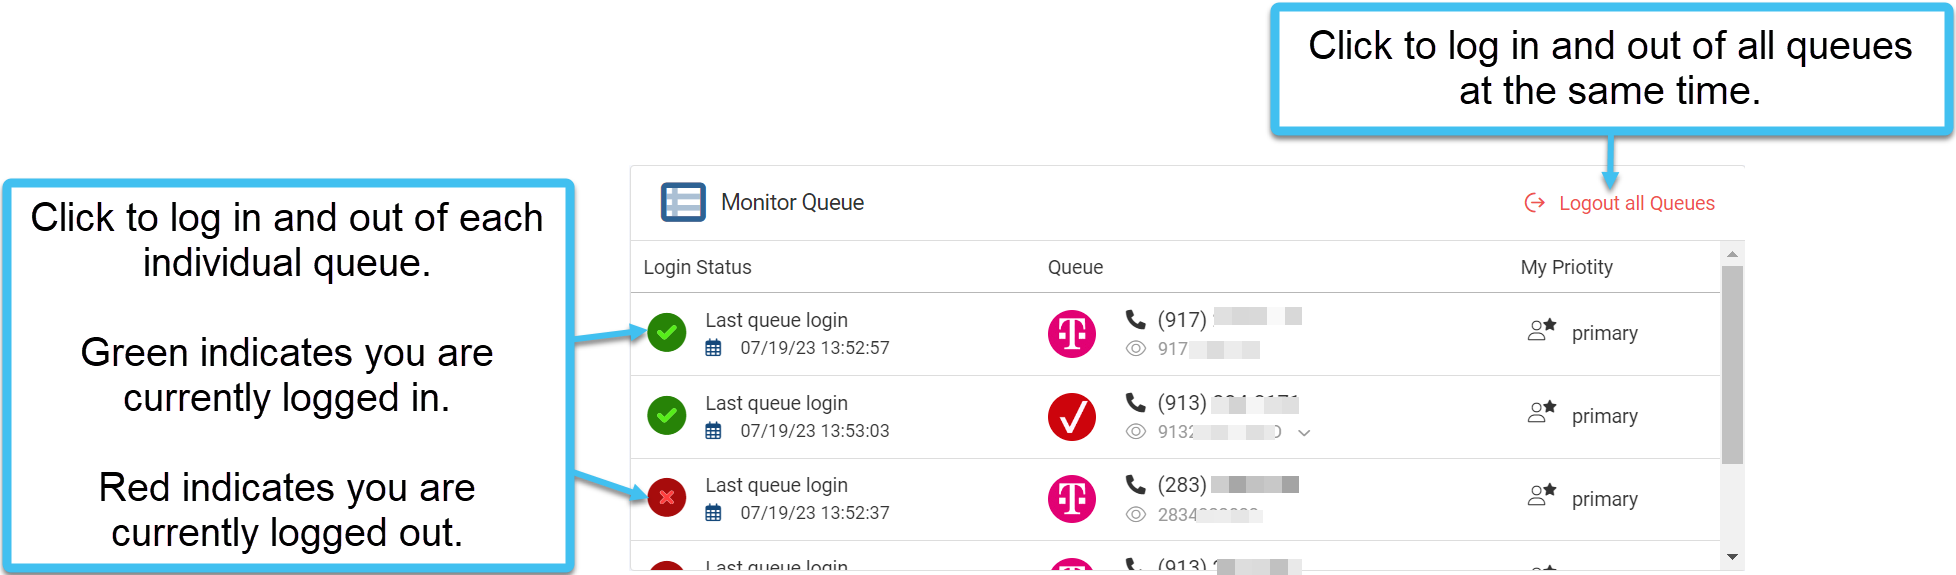


Click these icons to log in or out of an individual queue. When you are:
-
logged in a queue
is displayed. If you click on it you are logged out of the queue. -
logged out a queue
is displayed. If you click on it you are logged in to the queue.
This displays a summary of your call monitoring data for the calendar day. This is useful as it allows both the administrators and investigators to gain an insight into the activity of the target and allocate resources as needed.
 Total calls
This displays the total number of calls that you have received during the day.
 Completed
This displays the total number of calls that have completed. A completed call is one where the call has ended.
 Unattended
This displays the number of your calls that OSS-ESPA was unable to transfer to you because you and other monitors assigned to the queue were monitoring other calls. If a call is unattended it is not normally recorded unless your administrator has selected to do so by setting Recording mode to auto record (T50).
 Monitoring/Active
This displays the number of calls that you are monitoring and the number of calls that are active on your OSS-ESPA customer account. An active call is a current call that is not being monitored.

If your workspace is large, possibly you have multiple monitors then you may prefer to open this view in a separate screen. This is particularly useful if you are a supervisor and have many subjects in the view.
The filters allow you to select what is displayed on the screen. These filters are most useful if you are supervising a team of monitors and therefore have permissions to many cases.
Use this to filter the displayed subjects by their status.
- Live Monitoring: this displays all the subjects where a monitor is currently listening to a wiretap call.
- Unattended Call: this displays active calls which are not currently being monitored.
- Active PRTT: this displays active PRTT calls.
- Idle: this displays all the idle calls.
- Expired: this displays all the intercepts where the time period the judge has set for the interception has expired. For any subjects you still need to monitor, you must obtain the necessary legal permission then update the Court Authorization info on for example the Sentinel i-cases screen.
The subjects you have been assigned to monitor are displayed here. The T3 and T50 subjects displayed are the ones that have been assigned to you by your supervisor for monitoring using the Queue management screen.
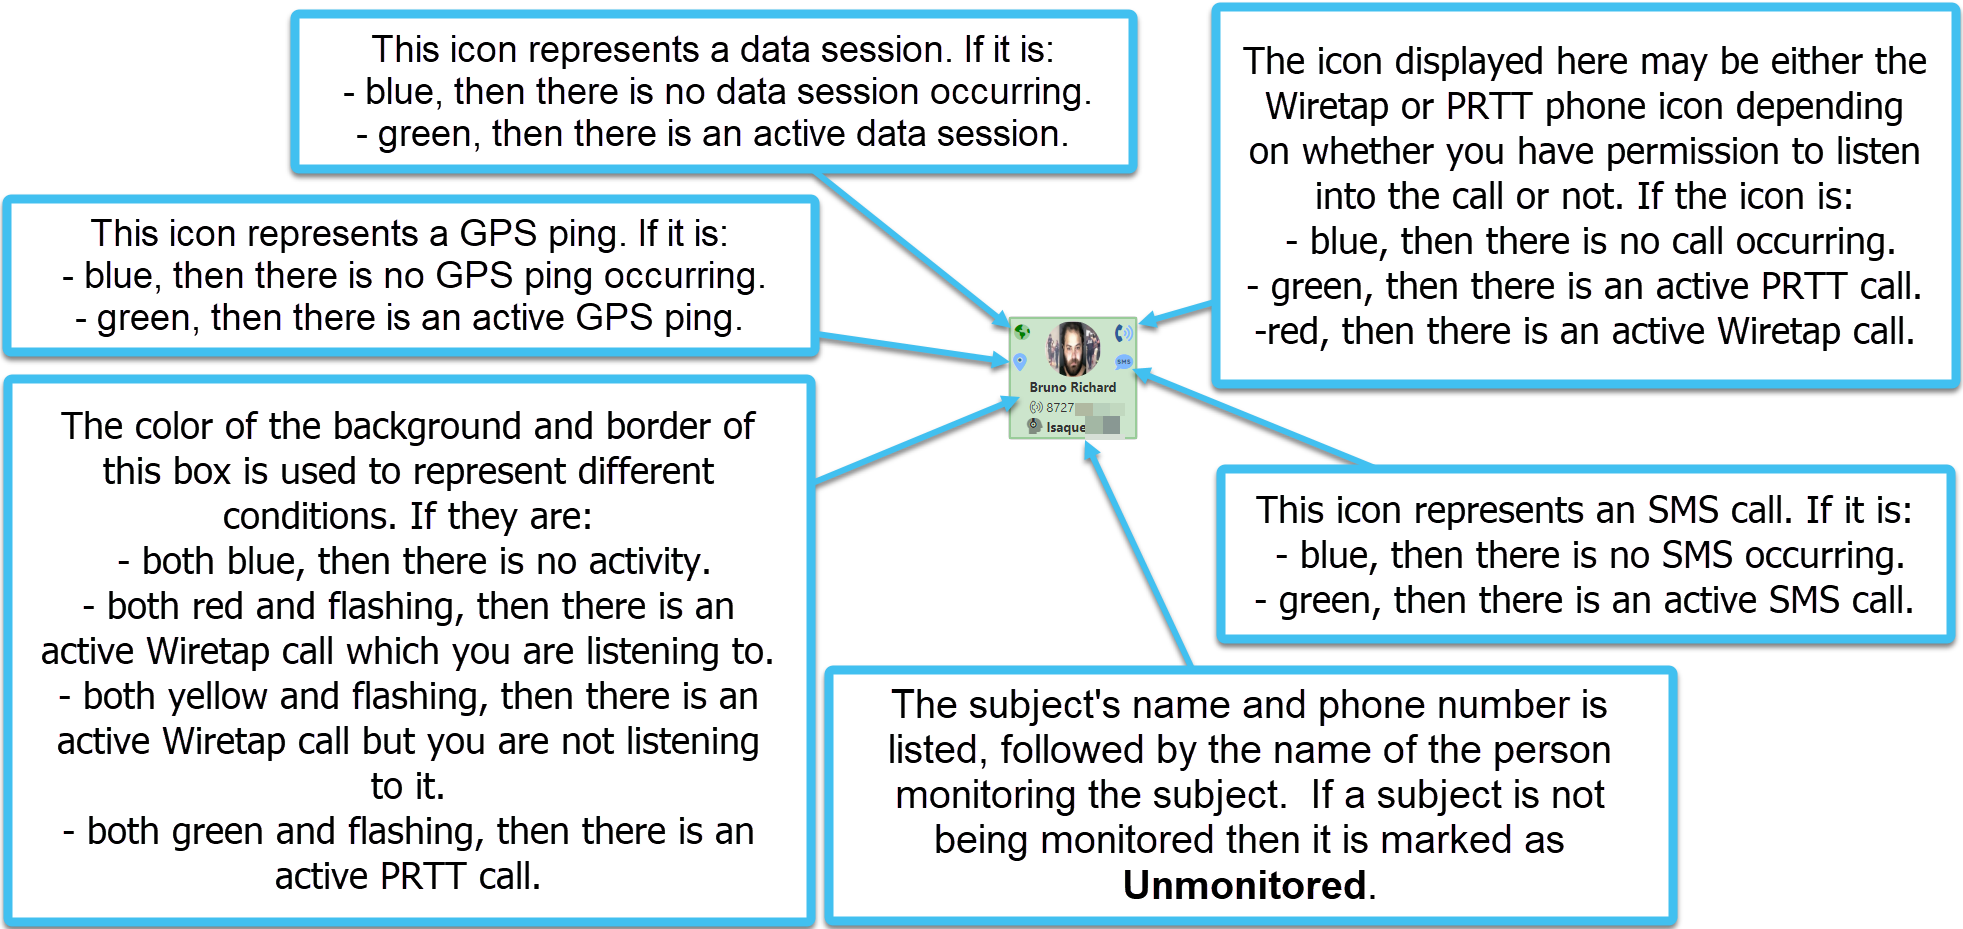
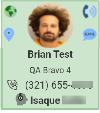
Understanding the subject icon
The details displayed in the subject icon are:
-
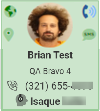
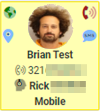
an events indicator containing four icons, one in each corner, which represent: data session, GPS ping, SMS call, and the intercept type which is either a wiretap call or a PRTT (Pen Registers Trap Trace ) call. All four icons display even if you have not been given permission to monitor them on the Queue management screen. If you are a monitoring supervisor, you can also listen into a monitored call by clicking the phone icon in the top-right corner.
The icons display in different colors and may be flashing which represent different states as shown in the following graphic:
-
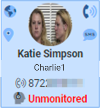
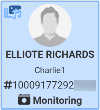
the subject's name and phone number along with their default picture, which is uploaded using the People and devices screen. For further information on adding a picture, refer to To edit the information of an existing person.
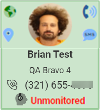
-
the name of the person monitoring the subject. If a subject is not being monitored then it is marked as Unmonitored. This information is useful if you are a monitoring supervisor as you can then communicate with other monitors to ensure you have someone log into the subject's queue.
For example:
|
Active data session |
Active data session Active location Active SMS |
Active voice call Call unattended |
No monitors assigned |
No activity No monitors assigned |
Social media |
Note, the social media icon only displays as blue as shown in the last graphic in the above table.
Click the monitored subject icon to display monitoring details in this section. The details displayed are:
-
the subject's name and phone number along with their default picture, which is uploaded using the People and devices screen. For further information on adding a picture, refer to To edit the information of an existing person.
- the monitor's name who is currently listening to the call. If there is no call, or the call is not being monitored then no name is displayed.
- on the Monitors tab it lists all the monitor's names that have been chosen to monitor the subject and their priority in the queue. A red or green circle displays beside each monitor which indicates whether or not they are currently logged into the subject's queue. This is useful if you are a supervisor as it allows you to see which monitors are assigned to monitor the subject and which are currently logged into the queue.
-
on the Observers tab it lists any observers that have listened into the call by clicking the
 at the top-right of the subject icon.
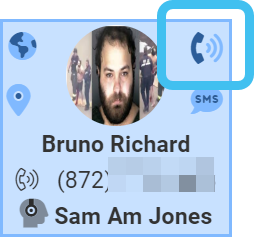
- on the LIIDS tab it lists all the LIIDs associated with the subject.
-
on the Alert settings tab it allows you to manage your sound alerts for each subject. Sound alerts are only played if you are not currently listening to a call. You can select to enable or disable sound alerts for an:
-
Unattended call: if no monitor is logged into a queue and a call commences, a sound alert occurs every 5 seconds continuously until a monitor logs into the queue.
-
SMS/MMS/Data: a sound alert occurs once.
-
Incoming call: a sound alert occurs just once as the call commences. As the call is automatically routed to a monitor no further sounds occur.
-
 click to open the Sentinel screen. This icon is only displayed if you have permission to view this screen.
 click to open the Evidence Management and Reporting screen. This icon is only displayed if you have permission to view this screen.
 click to open the ESPA analysis center screen. This icon is only displayed if you have permission to view this screen.
 click to open the Manage case screen. This icon is only displayed if you have permission to view this screen.
 click to open the Queue management screen. This icon is only displayed if you have permission to view this screen.
This list displays all your communications including voice, data, SMS, MMS and social media communications. To investigate the communication, click the icon in the in the Content column. This icon is grey when the communication is being processed by OSS-ESPA, and blue when the communication has been processed and is ready to investigate. For example, to listen to a voice call recording and categorize and transcribe the call click  .
.
The list displays the last three days of communications, and a maximum of 1000 communications. For example, if there were only 100 communications in the last three days then only 100 would show, however if there were 1200 communications in the last three days then only the most recent 1000 communications show.
Typically auto refresh is on so that new communications are automatically listed in the table as they occur. You can use Pause refresh while post monitoring and Refresh settings to define when the worklist is refreshed. However you may wish to turn it off if you are working on post monitoring tasks, or using the filters.
When Auto refresh is on select if you do not want the worklist to refresh while you are updating a communication's classification, notes, tags, summary, transcription, or translation. If this is not selected then the worklist refreshes in the background, which causes a flickering, which you may prefer to avoid while you are updating one of these items in their respective dialog boxes.


When Auto refresh is on this setting allows you to select when the worklist is refreshed. You can select either:
-
New data: which means that the worklist is only refreshed when new data arrives.
-
time periods: of between 30 and 180 seconds. The worklist is only updated at the end of your selected time period if new data has arrived. You are notified if there is new data pending by the flag
displaying in red. You can also click to perform an immediate refresh if required.
NOTE: New data includes any received PRTT/T3 data, or any updates made by another monitor to a communication's classification, notes, tags, summary, transcription, or translation, or the completion of an automated translation. If you make changes to a communication it does not trigger a refresh or a  , only the row of the communication you changed is updated.
There are two filters you can use to search and display your required records in the table.
The first is the basic search field, situated above the table, that allows you to search for column information such as a target number, target alias, monitor name and communication id. This filter also searches for tags within your notes, synopsis and transcripts.
The second is the advanced filter, situated to the right of the table, which you can show or hide by clicking Filters.
Click to show and hide the filters. These filters allow you to display on the screen the communications that are of interest to you. You can save your own filter settings that you commonly use, such as your communications that need transcribed for a specific phone number. You can select to filter based on a combination of: the dates, the target's phone, the targets's name, the monitor's name, call direction, associate names, associate numbers, call types, category content, locked, synopsis work status, transcript work status, the communication's duration and text content and tags within the notes, synopsis and transcripts.
The Duration filter can be used to filter calls by short durations. This helps you with wiretap reporting which requires the number of calls that were less than one minute in duration and/or the number of calls that were under two minutes in duration. The range is displayed in seconds and allows you to choose whether or not to include data events in the sliding scale's range. By default data events are not selected as some can last for long time periods, for example a week, making the range of the sliding scale significantly larger.
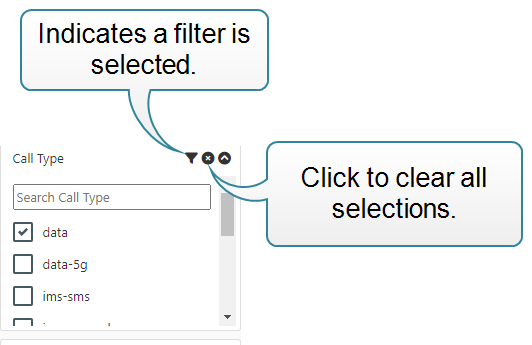
To allow you to quickly identify if a filter has been applied, the group has  displayed in the title bar. Any items you have selected in the filters are displayed at the top of each list.
Use to filter which cases are being displayed or used in the search. You must first create and save filters for them to display in this menu.
Select if you want to view or use filters created by your monitoring supervisor or administrator. These filters are typically commonly used filters that your supervisor or administrator has created for the benefit of all users.
To set a filter as your default, which is used each time you open the screen, select the filter in My filters, then select this check-box.
Click to clear all the filters.

Click to create a new filter. Refer to How to create worklist filters for further information.

Click to save the current configuration of the filters under a new name.

To edit a filter, select it in My filters, then select the required configuration of the filters, then click this icon.

Click to rename the filter currently selected in My filters.

To delete a filter, select it in My filters, then click this icon. You can delete filters that you created. Only administrators can delete global filters.
This column displays information associated with the call. It details an arrow representing who originated the call, the communication identifier, the type of call, the call duration. This column also displays the details of redirected calls. The  icon indicates that the call was redirected from the original number through the numbers listed after . If the call was specifically redirected to voice-mail then the
  icon is displayed followed by the voice-mail number.
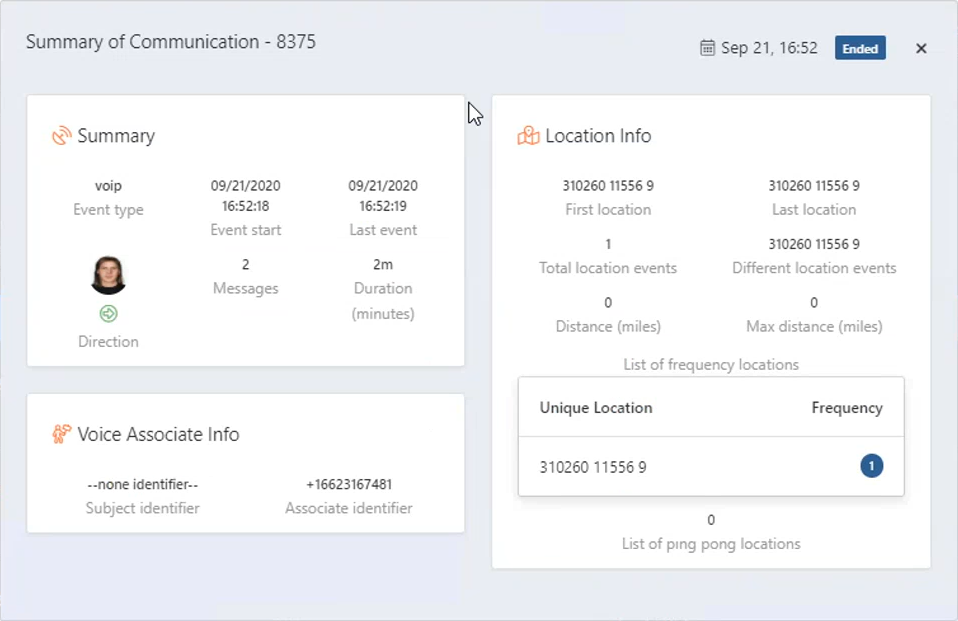
Left-click the communication identifier to open the summary of the communication. This contains the same information that is displayed on the Sentinel screen's Message summary view.
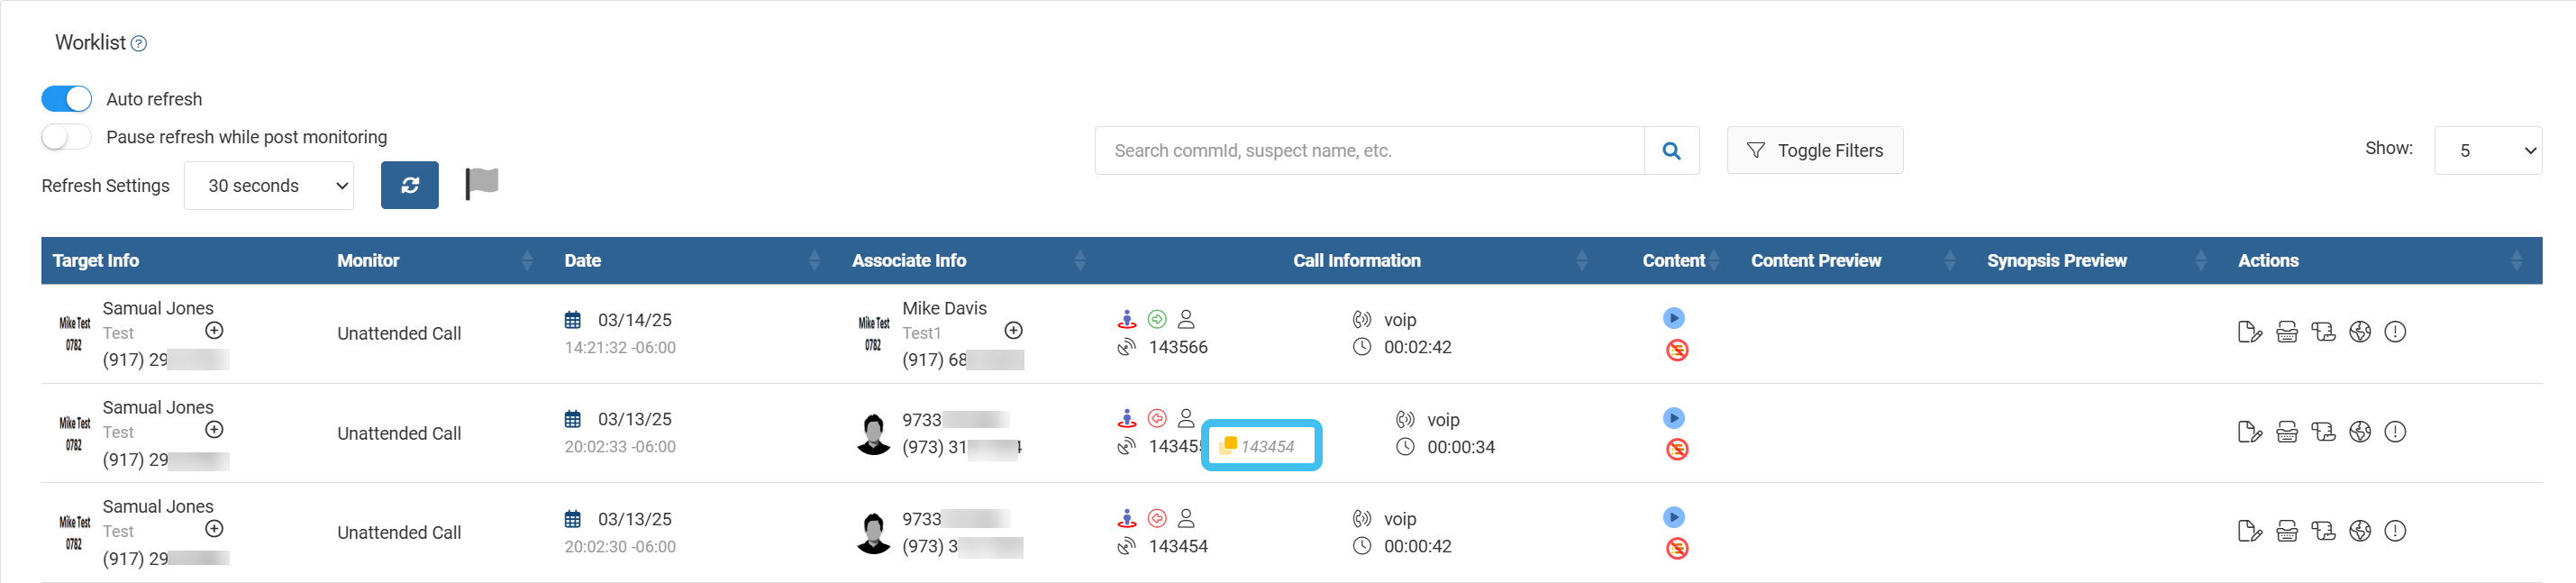
 indicates that the communication is a duplicate of another communication. Sometimes an operator supplies multiple legs for the same call. When this happens it creates duplicate communications that are individually listed. If OSS-ESPA detects that they are the same it marks any duplicates with along with the other communication number.
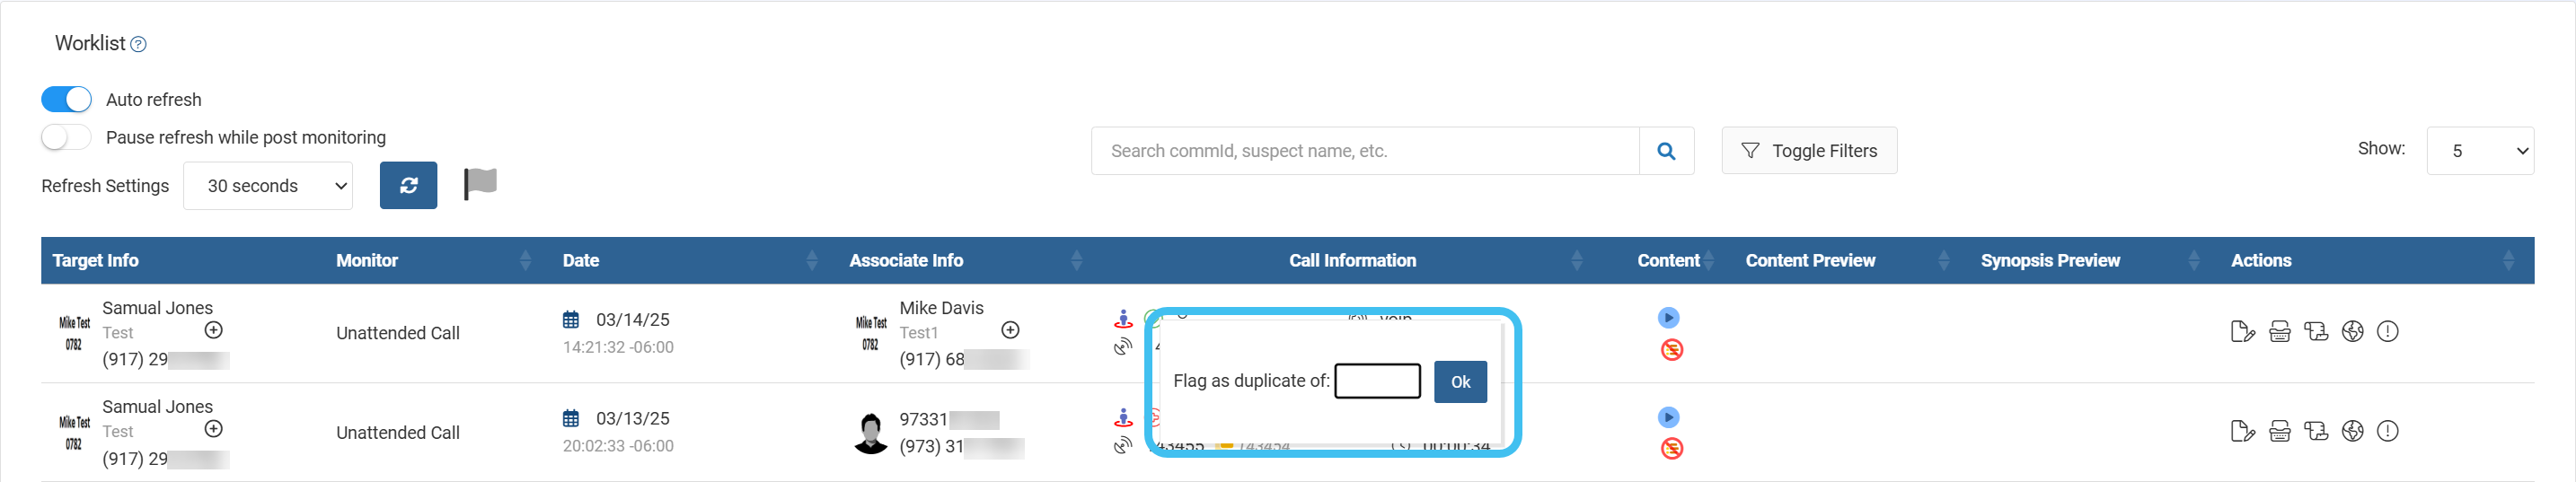
There are occasions where it is not possible for OSS-ESPA to detect a communication is a duplicate, and in this instance you can use this column to mark a communication as a duplicate. For a communication to be marked as a duplicate it must have the same: target phone number, associate phone number, communication type, call direction, and the call timespan must be the same +/- 30 seconds. To mark a communication as a duplicate, right-click the communication number and enter the other communication number.
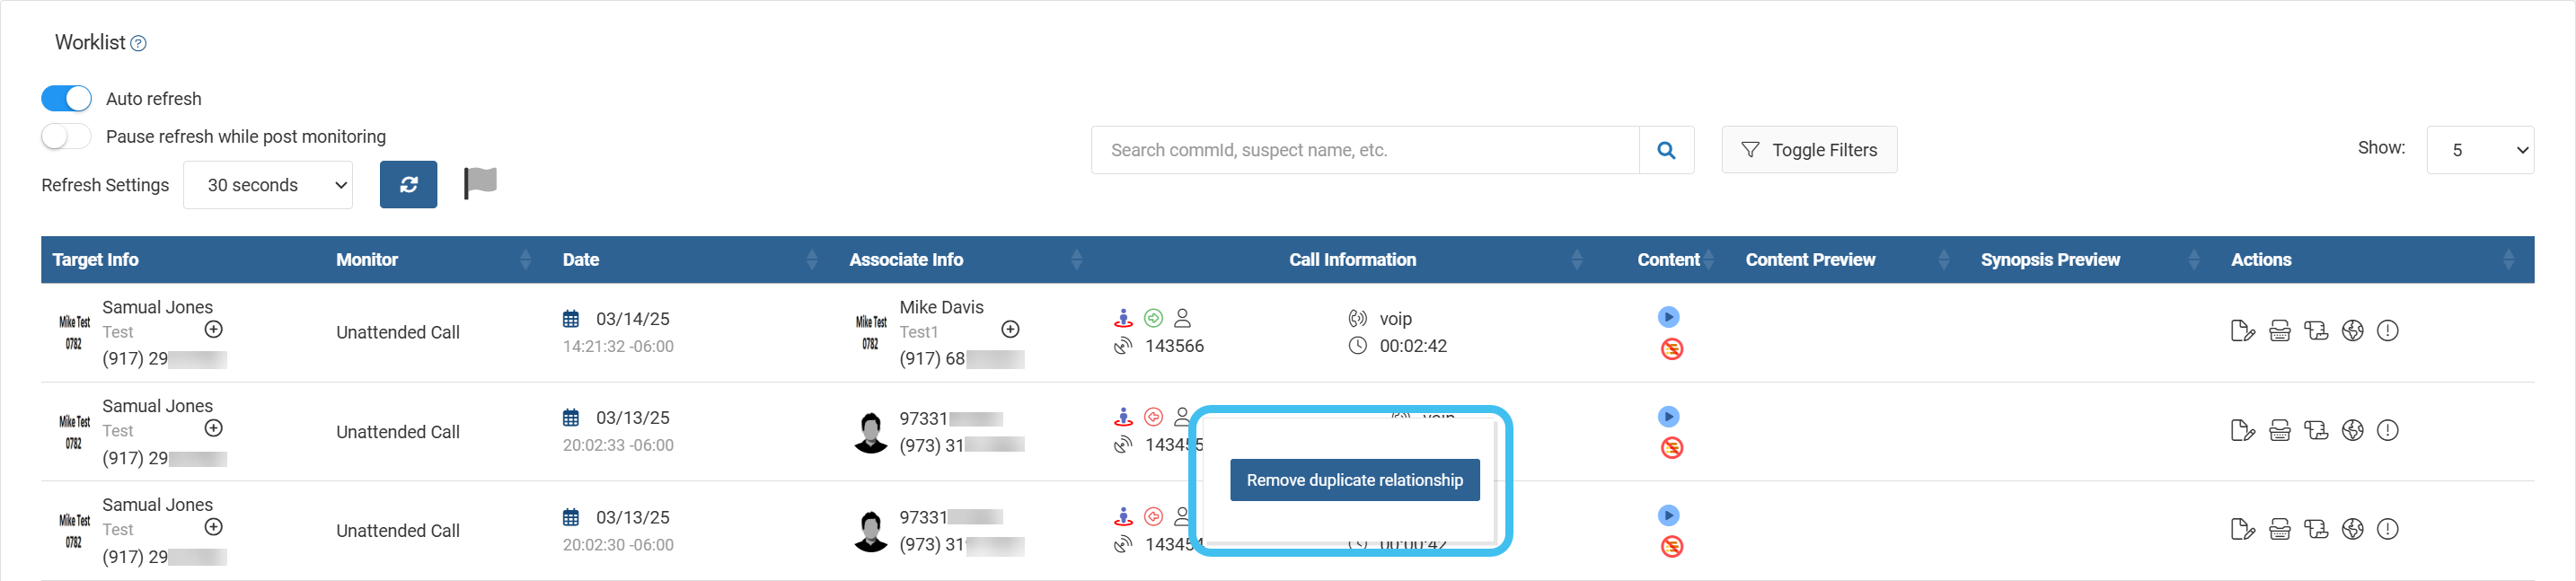
To remove a communication as being a duplicate, right click the communication and select Remove duplicate relationship.
This displays a preview of any available SMS and MMS content. If the MMS contains video or audio content, then the column displays Video or Audio.  displays if the communication is categorized as: Not Monitored, Uncategorized, Privileged or Blocked. Note, users with monitor permissions of Administrator can view the Privileged and Blocked communications.
This displays either:
-
 which indicates that the content of the communication is a voice recording that is still being processed by OSS-ESPA and is not yet ready to replay.
 -
which indicates that the content of the communication was a voice recording which been processed by OSS-ESPA and is ready to replay. Click to open the Audio Playback window. If required you can then enter a transcript and categorize the call.
-
 which indicates that for some reason the audio file failed to process. If this occurs then contact your administrator as it may be possible to retrieve the audio file manually.
 -
 which indicates that the content of the communication was data. Click to open the Data timeline view.
 -
 which indicates that the communication was an sms message with no content. This can occur with notifications from the operator which appear as an sms but contain no content. Note, only the Evidence Management and Reporting screen displays messages with no content; they do not display on the Live monitoring screen.
 Click for further details on why sms messages may have no content
Why sms messages may have no content
While generally the term sms is synonymous with user text messaging, sms is a protocol that can be used to transmit different types of carrier data to the device, including for example voicemail notifications and status, mms notifications, and other carrier-specific background data.
sms is only displayed in the Call type column on the Evidence Management and Reporting screen (and on the Event type column on the Sentinel screen's Event summary view) to identify sms user messaging, and is also used when the protocol description unit (PDU) is unknown. The following event types are also displayed, and as they contain no content the sms icon is displayed in grey.
-
sms-data: the default event type when the sms PDU contains data that is not defined as user messaging.
-
sms-notify: this identifies an sms PDU notification event such as voicemail, fax, and email.
-
wap-data: the default event type when the sms PDU contains encapsulated wireless application protocol (wap) data.
-
wap-push: the sms data sent to the wap-push port. The wap-push may further be classified if the wap-push data is a known content type:
-
mms-notify: mms notification message.
-
syncml-notify: syncml-notification message.
-
-
-
 which indicates that the content of the communication was a message such as an mms or ims-sms. Click to open the Chat timeline view which displays any text, graphics, audio and video shared during the communication.
 -
 which indicates social media content. Social media content is listed with a Call type of Unified message. Click to open the Chat timeline view which displays any text, graphics, audio and video shared during the communication.
 -
 which allows users with the monitor administrator permission to download audio from intercepted T3 voip calls on both the Live monitoring screen and the Evidence Management and Reporting screen. This is only available when Allow download audio is selected on Sentinel's Administrative settings screen.
The notes, synopsis, transcription, translation and completion icons indicate the status of each task. These icons are either white, yellow, blue or green depending on their completion status.
-
 : a white background indicates you have not started the action, or in the case of
  that you have not completed monitoring the content.
 -
 : a blue background indicates you have started the action, or in the case of
  that you have completed monitoring the content.
  : a yellow background on the transcript and translation icons indicates that you have requested an auto transcript or a translation but it is not yet complete.
-
 : a green background indicates that you have marked the action as "Done" on their respective dialog boxes.