Viewing different map layers
This topic describes how to view the different map layers on the ESPA analysis center screen.
You can select to hide or show each map layer using the layer selection settings located in the upper right corner of the map by clicking  . Note, if you are using WNF analysis center, then depending on the style of theme you have selected you may need to close another view to access this button. The following graphic provides an example of the layer selection window.
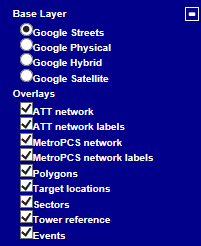
The base layers available to select are: Google Physical, Google Streets, Google Hybrid (a combination of both satellite and street maps), Google Satellite and Open StreetMap.
The overlays that are available to select are dependent on what you currently have displayed on your ESPA analysis center screen. For example, if you do not have a public records file in your case then the public records layer is not available to select. The possible selections are:
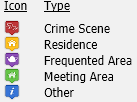
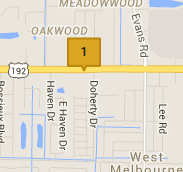
Select Target locations to display the target locations which you have added to the selected case. All the target locations listed on the Locations of interest screen (Case management), which have longitude and latitude information entered are displayed. Each type of location is displayed using a different default icon, or alternatively you can customize the icons using Marker icon, Marker label and Icons on the Locations of interest screen (Case management). For example, the default icons are;
Select Target locations buffer to display the selected target location buffers. All the target locations which have a location buffer set can now be displayed on the map. To display them you must select the target location's location buffer on the Target locations tab.
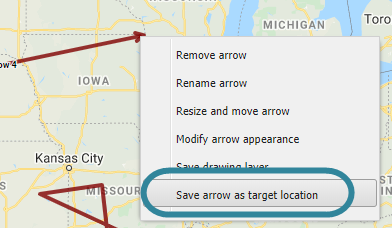
Select Target location drawing to display any lines, arrows or polygons that have been saved as a target location.
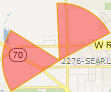
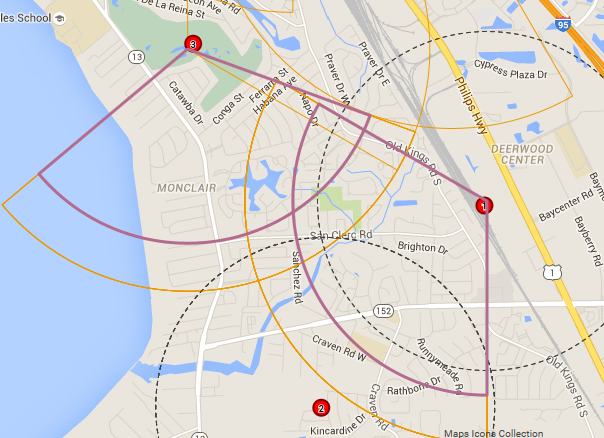
Select Sectors to display the sectors that have been identified as being used by one of the sources in Sources. For example;
Select Operator networks to display all the cell sites for the named operator. This operator appears on the overlays list because a phone that uses that operator is selected in Sources. Neighboring networks may also be displayed on the map if the phone was used near the neighboring network. Each operator identified has its own layer that you can select to show or hide, for example "ATT network". The cell sites are displayed as colored circles. The color of the circles for each operator can be different if your administrator has configured them with different colors. For example;

Select Operator network labels to display all the cell sites names for the named operator label. This operator label appears on the overlays list because a phone that uses that operator is selected in Sources. Neighboring network labels may also be displayed on the map if the phone was used near the neighboring network. Each operator identified has its own layer that you can select to show or hide, for example "ATT network labels". The cell site name is positioned alongside the colored circle of the cell site. For example;

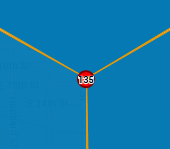
Select Tower reference to display a tower reference on the map which allows you to cross reference the geographic location of calls with the time of calls. Each tower location is given a reference number. A tower location is defined by its latitude and longitude, therefore each sector in the tower has the same tower reference number. This tower reference number is also displayed in the CDR data and Sector data tabs irrespective of whether you have selected to display the tower reference on the map.
Click on the tower reference number to open a pop-up which provides by default the tower's cell IDs, the number of calls that used the tower, the date and the local time of the calls. The color of the pop-up's header represents the color of the operator. The phone number is also displayed if more than one is selected in Sources. You can change the way the information is displayed by hovering over ... at the top of the pop-up then using  . These icons allow you to display the information as: the default, a summary by day for each phone number, or by a total summary for each phone number.
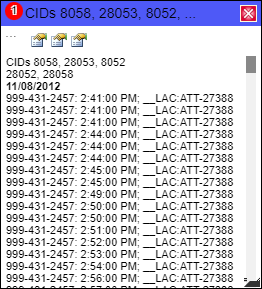
You can also include additional details in this pop-up and change the way the information is displayed using theTower display options on the Display tab of the Advanced options dialog box.
Select Tower reference with no label to display a tower reference on the map without a reference number. This is identical to the Tower reference, with the exception that there is no number displayed. This can be useful if you are sharing reports with others.
Select Drawings to display any polygons, lines and arrows that have been created for the case. Polygons are used to select your drive area and can be saved as target location areas. Polygons, arrows and lines are used to highlight areas on the map which you may then want to analyze further and include in advanced analysis reports. For further information refer to Selecting your drive area and Using map views in advanced analysis reports.
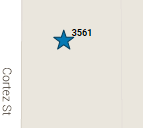
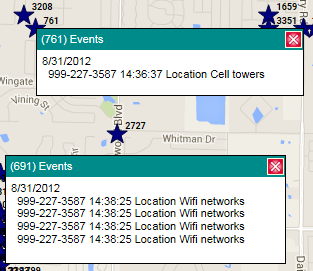
Select Events to display the events from the phone data files you uploaded as historical files when you first created the case, or which you subsequently uploaded using the Manage files screen. Only those events that have a latitude and longitude are displayed. This layer is only available if there are events from the phone data available on the Timeline tab. The events are displayed using a star, the color of which is defined by the Color selector.
Click on the event marker to open a dialog box which provides the local date and time of the event, and the details that are displayed on the Timeline tab's Event and Subtype columns. The phone number is also displayed if more than one is selected in Sources. Each event is given a reference number which allows you to correlate between the event marker and the dialog box which can be moved away from the event marker.
Select Timing advance to display the arcs from the advanced CDR files you uploaded. Only those arcs that you have selected on the TA data tab are displayed. The arcs are displayed as shown below, the color of which is defined by the Color selector.
Click on the arc to open additional details related to the call associated with the arc, and the arc's appearance, for further information refer to Using TA data.
Note, if you also want to view any estimated call locations associated with the TA advanced CDR file then you must also select the Call locations layer.
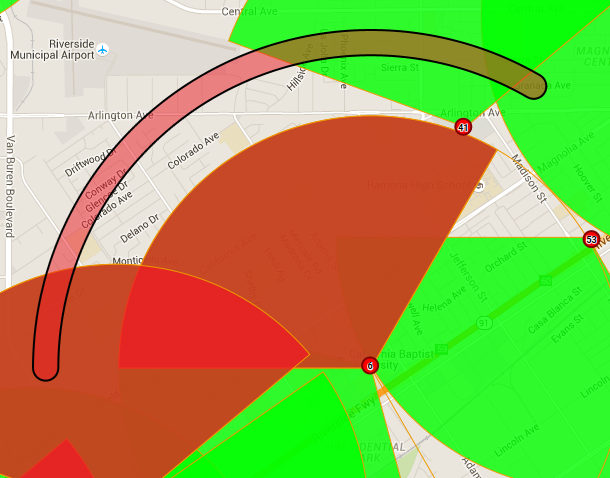
Select Handovers to display the handover sectors from the advanced CDR files you uploaded. Only those handovers that you have selected on the HO data tab are displayed. The handover sectors are displayed as shown below, the outline color of which is defined by the Color selector.
Click on the handover sector to open additional details related to the call associated with the handover, and the handover sector's appearance, for further information refer to Using handover data.
Select Call locations to display the estimated call locations from the advanced CDR files you uploaded. Only those call locations that you have selected in the Cal loc column on the CDR data tab are displayed. The call locations are displayed as shown below, the color of which is defined by the Color selector.
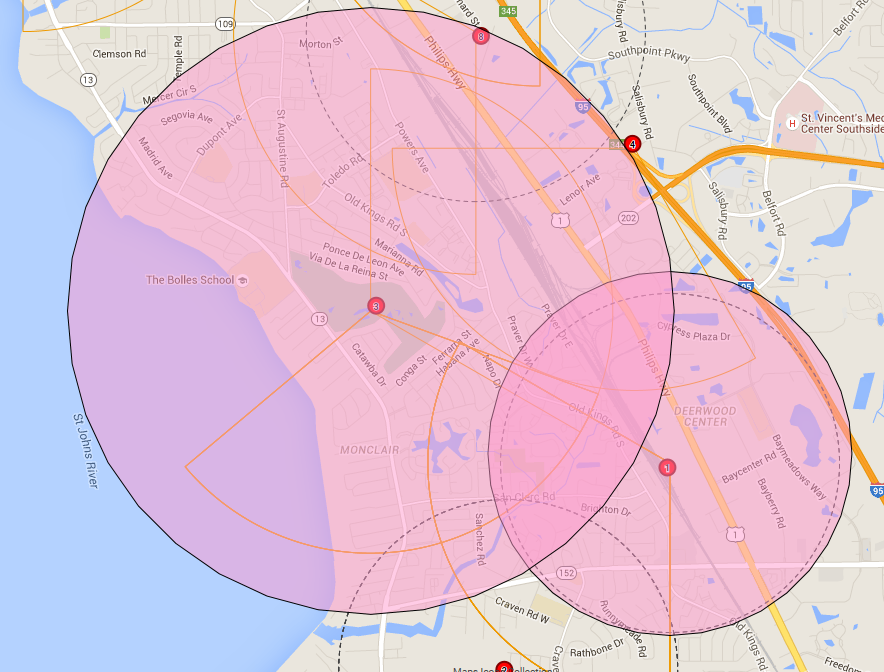
Click on the call location to open additional details related to the call associated with the location, and the call location's appearance, for further information refer to Using call locations calculated from triangulated data.
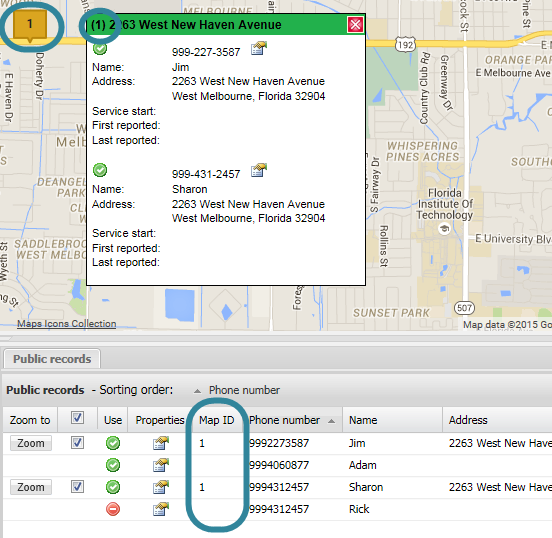
Select Public records to display the records from the public record files you uploaded. Only those locations that you have selected on the Public records tab are displayed, and only public records that have a latitude and longitude can be selected to display. The public record locations are displayed using a yellow square.
Click on the public record marker to open a dialog box which provides all the public records associated with the location. Each marker is given a map id which allows you to correlate between the marker on the map and the records on the Public records tab.
Select WiFi to display the WiFi locations that are open on the WiFi networks tab. Only those WiFi locations that you have selected on the WiFi networks tab are displayed. The WiFi locations are displayed using a red pointer.

Select Geo-location to display the geo-location events that are open on the Geo-loc data tab. Only those geo-location events that you have selected on the Geo-loc data tab are displayed. If the geo-location event is from a GPS ping or License Plate Reader then they are displayed by default using a red pointer, however you may have selected to display another icon type when you uploaded the geo-loaction file. GPS tracker events are always displayed with small circles displaying the drive route.
Select Geo-location confidence to display the selected geo-location confidence circles. To select geo-location confidence circles use the check-box to the left of the Conf radius column on the Geo-loc data tab.
The Global locations layer is only displayed if your account supports Global locations, and you have selected Show global location layer on the map on the Advanced options dialog box. Select to display the global locations on the map. For further information refer to How to display global locations on the ESPA analysis center and the Sentinel screen.