Using TA data
This topic describes how to use TA (Timing Advance) data to help identify the possible location of calls. It also explains how to set the appearance of the TA arcs on the map.
This feature requires option E7 Advanced CDRs. If you do not have this option this feature is not available.
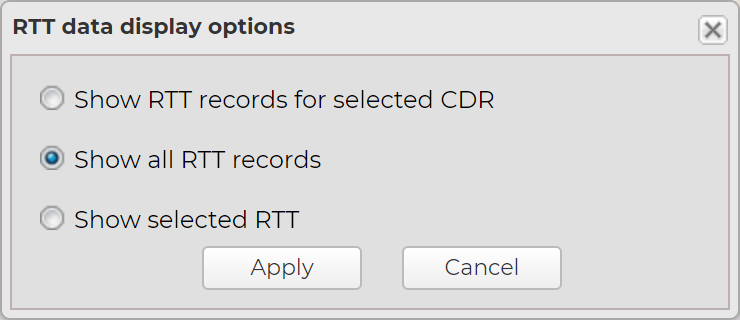
NOTE: Timing advance (TA) files are provided by a number of operators all of who refer to it as TA data with the exception of Verizon who use the term Round-Trip Time (RTT) data. For details of which operators supply this information, refer to table in Analyzing call locations using advanced CDRs.
- Open the ESPA analysis center screen and set up the case data as normal as described in Getting started with investigating case data visually.
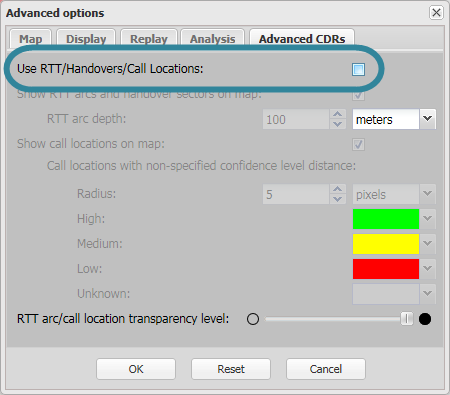
- Ensure the Advanced dialog box's Advanced CDRs tab has both Use TA/Handovers/Call Locations and Show TA arcs and handover sectors on map selected.
-
There are different methods of displaying the TA arcs on the map, for example:
 If you want to display the TA arcs for a particular call
-
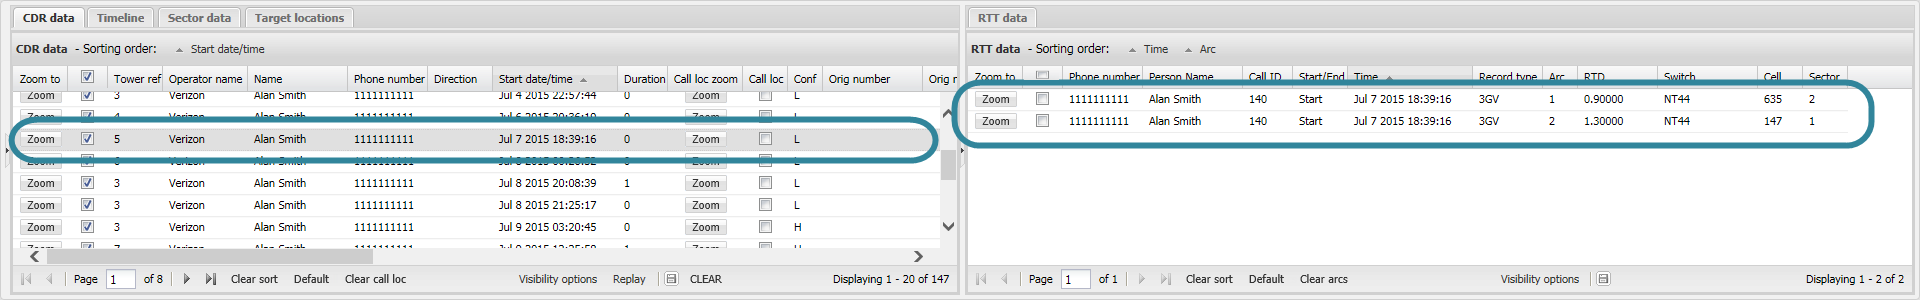
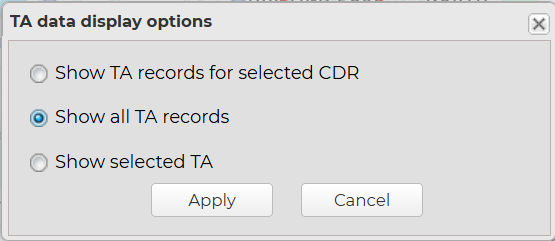
On the TA data tab click Visibility options. The TA data display options dialog box opens. Ensure Show TA records for selected CDR is selected.
-
On the CDR data tab select the call you are interested in. Note, to select the call click it and it will highlight in gray. If the call has TA data associated with it then the data is automatically displayed on the TA data tab.
-
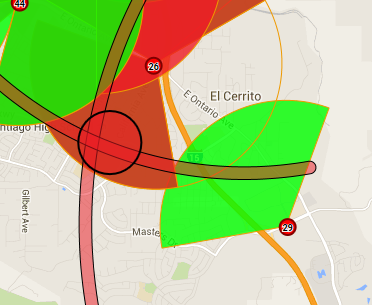
On the TA data tab select the check-box to display the TA arc on the map. The TA arc is positioned on the map displaying the most likely location area of the call.
-
To help identify the possible call location further:
- If you have other calls that are close in time to the one of interest you should display their TA arcs too. This can help narrow down the location further as you may get an overlap with multiple arcs.
-
If you also have an estimated call location for the call you can display this for the call too. This can help define the location further as you may get an overlap of the estimated call location circle with one or more of the TA arcs. To display any associated estimated call locations, on the CDR data tab select Call loc for the call you are interested in. For further information refer to How to display estimated call locations on the map.
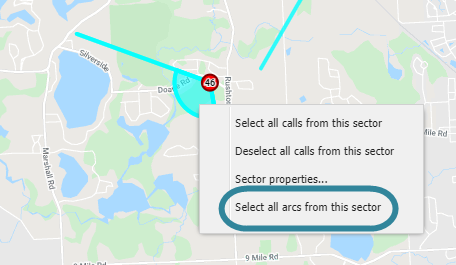
If you want to display all the TA arcs for a specific sector
-
On the TA data tab click Visibility options. The TA data display options dialog box opens. Ensure Show all TA records is selected.
-
Right-click the sector of interest and from the menu click Select all arcs from this sector.
-
The TA arcs positioned on the map display the most likely location area of the call.
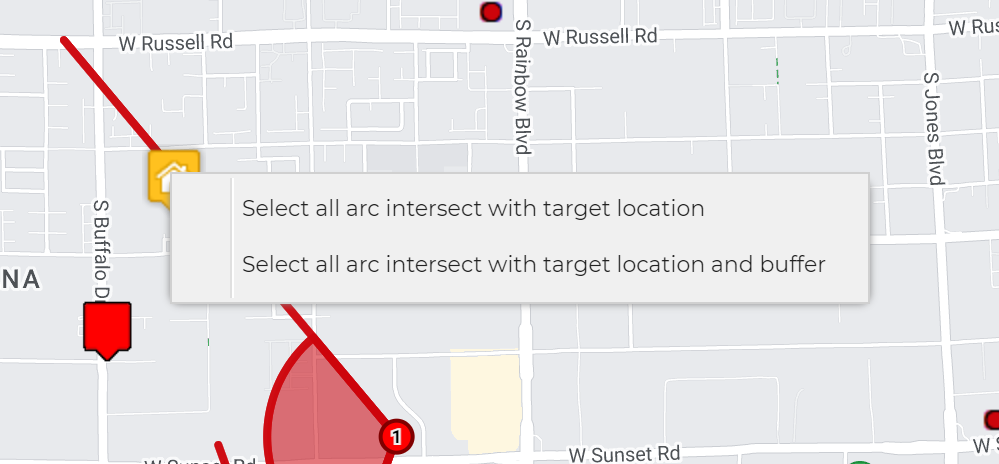
If you want to display all the TA arcs near a location
-
On the TA data tab click Visibility options. The TA data display options dialog box opens. Ensure Show all TA records is selected.
-
Right-click the location of interest and from the menu click either Select all arc intersect with target location or Select all arc intersect with target location and buffer.
-
The TA arcs positioned on the map display the most likely location area of the calls at the target location.
If you want to display the TA arcs within a geographical region
You can also click here for a short video showing how to use map drawing mode, including using the polygon drawing mode to display the TA arcs inside the polygon.
-
On the TA data tab click Visibility options. The TA data display options dialog box opens. Ensure Show all TA recordsis selected.
-
Draw a polygon over the geographic region of interest. To do this:
- Hover over
 on the top-right of the map.
 -
Click
 then select Polygon from the menu.
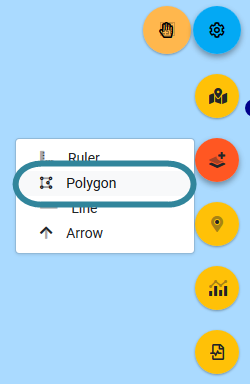
The map is now in the polygon drawing mode, and the
 icon turns from orange to white.
 -
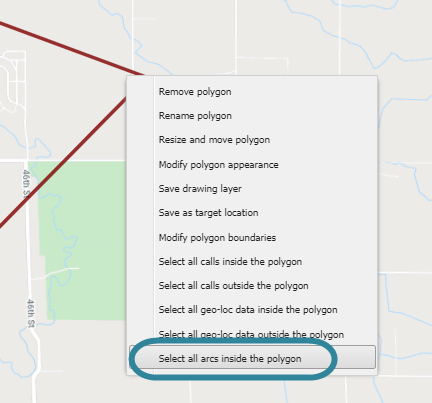
Left-click on the map to start drawing your polygon. You can left-click to create another point on your polygon or double left-click to complete your polygon.
Once you've completed your polygon the map view returns to the normal map mode which is indicated by the hand icon returning to orange
.
- Hover over
-
Right-click the polygon and from the menu click Select all arcs inside the polygon.
-
The TA arcs positioned on the map display the most likely location area of the call.
-
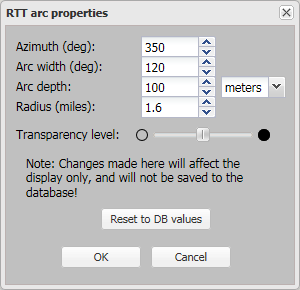
The following procedure details how to change the azimuth, arc width, arc depth, radius and transparency levels of an individual TA arc.
-
Right-click the TA arc on the map and select Arc properties ....
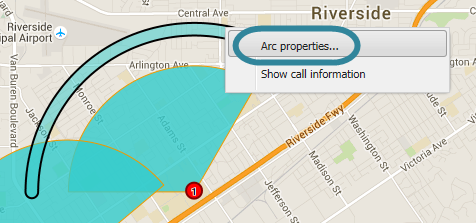
The TA arc properties dialog box opens.
-
Set the properties as required then click OK. These settings are then immediately applied on the map to the selected TA arc.
NOTE: If you apply an individual transparency level the actual level displayed is a combination of the default transparency level set using TA arc/call location transparency level and the individual level set in this step. For example if the default setting is set to 50% and the individual setting is set to 50% the overall transparency is displayed as 25%.
For further information refer to the TA arc properties dialog box.
The following procedure details how to change the depth of all the TA arcs. If you want to change the depth of an individual arc refer to How to change an individual TA arc's properties.
NOTE: This procedure does not apply to any TA arcs which you have set an individual property on using the TA arc properties dialog box.
-
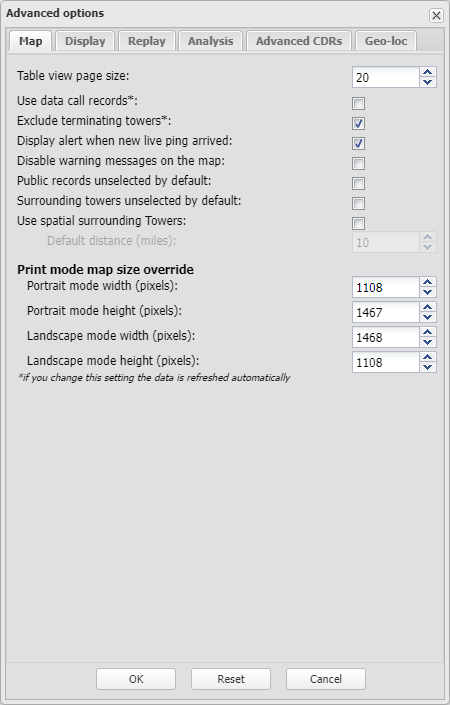
On the ESPA analysis center, open the Advanced options dialog box.
You can open the Advanced options dialog box from either the Input and settings view or the Map view.
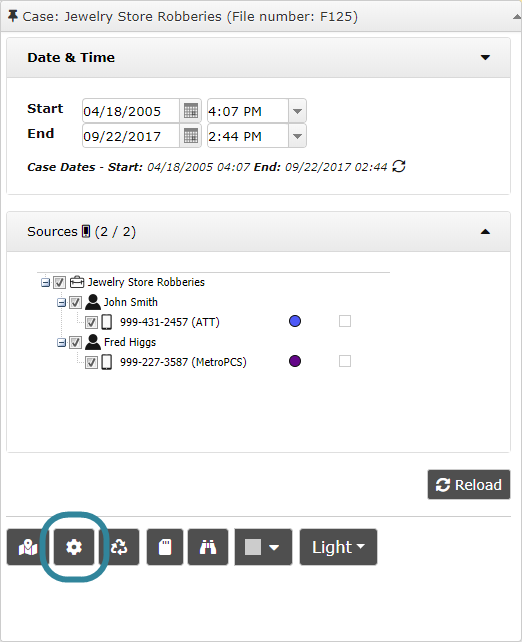
- On the Input and settings view:
Click
 .
.
-
On the Map view:
- Hover over on the top-right of the map.
-
Click
 then select Advanced options from the menu.
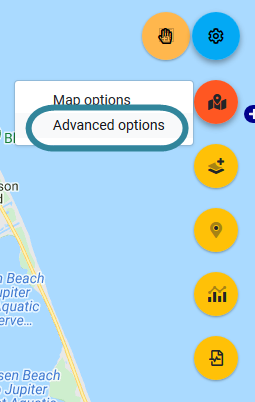
- Hover over
The Advanced options dialog box opens.
- On the Input and settings view:
-
Select the Advanced CDRs tab.
-
In TA arc depth select the method you want used to display the depth of the TA arc then click OK. This setting is then applied to all new TA arcs, and all the TA arcs that are currently displayed on the map unless they have an individual property set.
For further information on the options available refer to TA arc depth.
For further information on this setting refer to Advanced options dialog box.
The following procedure details how to change the transparency levels of all the TA arcs, however if you want to change the transparency level for an individual TA arc refer to How to change an individual TA arc's properties.
-
On the ESPA analysis center, open the Advanced options dialog box.
You can open the Advanced options dialog box from either the Input and settings view or the Map view.
- On the Input and settings view:
Click
.
-
On the Map view:
- Hover over on the top-right of the map.
-
Click
then select Advanced options from the menu.
- Hover over
The Advanced options dialog box opens.
- On the Input and settings view:
-
Select the Advanced CDRs tab.
-
Using TA arc/call location transparency level move the slider to the required transparency position than click OK. This setting is then immediately applied to all TA arcs that are currently displayed and any new TA arcs that you select to display.
NOTE: If you have an individual transparency level applied to any TA arcs then the actual level displayed is a combination of this default transparency level and the individual level set using the TA arc properties dialog box. For example if the default setting is set to 50% and the individual setting is set to 50% the overall transparency is displayed as 25%.
For further information on this setting refer to Advanced options dialog box.
The following procedure details how to display on the map the call ID, and the date and the local time associated with the TA arc.
-
Right-click the TA arc on the map and select Show call information.
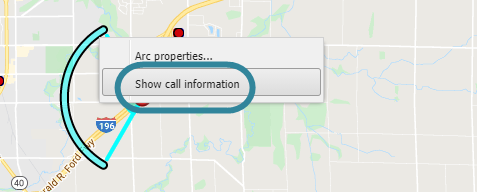
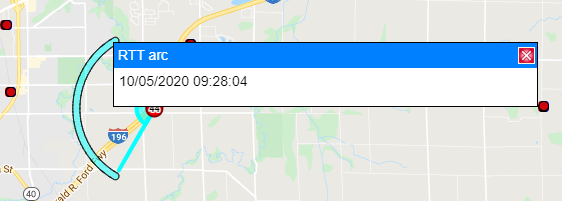
A popup opens which by default provides the date and the local time of the call.
-
If you want to display additional information, such as the call id and the phone number then:
-
On the ESPA analysis center, open the Advanced options dialog box.
You can open the Advanced options dialog box from either the Input and settings view or the Map view.
- On the Input and settings view:
Click
.
-
On the Map view:
- Hover over on the top-right of the map.
-
Click
then select Advanced options from the menu.
- Hover over
The Advanced options dialog box opens.
- On the Input and settings view:
-
Select the Display tab then click Change.
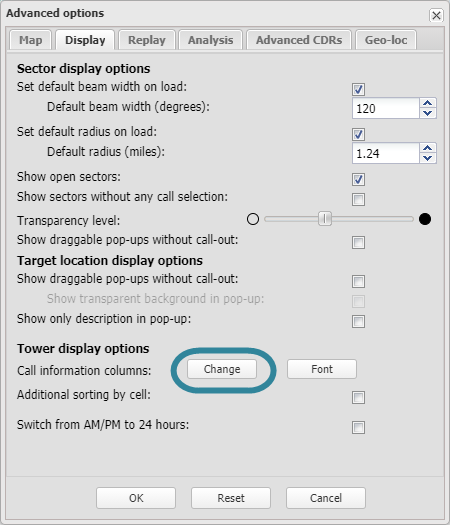
The Call/Geo-Loc information columns dialog box opens.
-
Click the TA tab, select the columns you want displayed in the TA arc popup, click Apply.
-
On the Advanced options dialog box click OK. Your updated selection appears immediately you open your next TA arc popup.
-
The following procedure details how to disable the TA layer and TA data tab from displaying. Although this is not common, you may want to do this if you have a lot of TA data that you currently do not want to analyze. Disabling it will improve the speed performance of the ESPA analysis center screen.
- Open the ESPA analysis center screen and set up the case data as normal as described in Getting started with investigating case data visually.
-
On the ESPA analysis center, open the Advanced options dialog box.
You can open the Advanced options dialog box from either the Input and settings view or the Map view.
- On the Input and settings view:
Click
.
-
On the Map view:
- Hover over on the top-right of the map.
-
Click
then select Advanced options from the menu.
- Hover over
The Advanced options dialog box opens.
- On the Input and settings view:
-
Select the Advanced CDRs tab then unselect Use TA/Handovers/Call Locations then click OK.
The TA layer and TA data tab are both removed.
For further information refer to the Advanced options dialog box.