Using map views in advanced analysis reports
This topic describes how to use map views in advanced analysis reports on the ESPA analysis center screen.
This feature requires option E9 Analysis report. If you do not have this option this feature is not available.
This procedure details how to add a map into your report. For further information on what map details are saved refer to Add current map view.
This procedure assumes you have created a report as detailed in the first three steps of To create a new report.
If you currently have the <Report name> tab open then go directly to step 3.
-
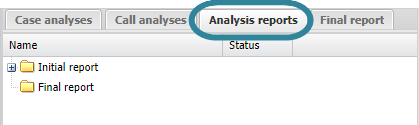
On the ESPA analysis center screen's Case management view select the Analysis reports tab.
-
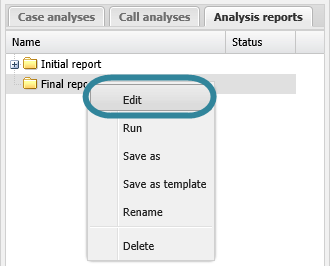
Right-click the report folder then click Edit on the displayed menu.
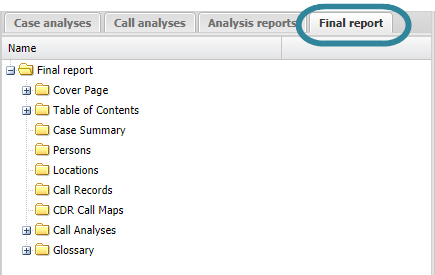
A new tab opens which is titled with the report's name.
-
On the <Report name> tab, right-click the folder in the report to which you want to add a map view, then click Add current map view.
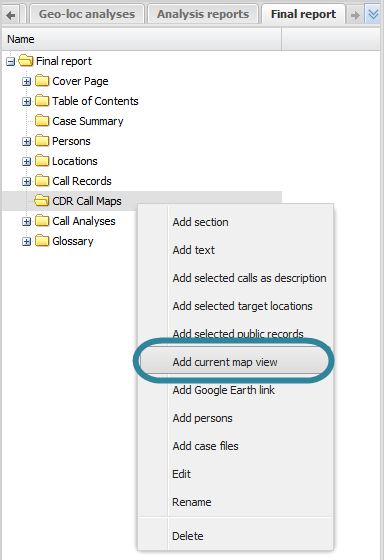
The Add map view into report dialog box opens.
-
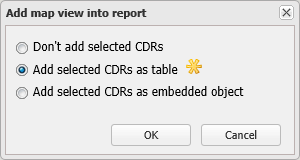
Select whether or not you want the CDR data included in the report. If you do want to include it you can select to include it as a table or as an embedded object then click OK. For further information refer to Add map view into report dialog box.
The new map view is displayed in the report structure.
- If you want to move it's position then left-click it and drag it to a new position.
-
By default the item is named "Map view" or "Map view with CDR", you may want to rename it by right-clicking it and selecting Rename.
For further information on all the details that are saved refer to Add current map view.
You can add notes to your map view using the target location notes feature as described in the following procedure.
- On the ESPA analysis center screen set your map view as required.
-
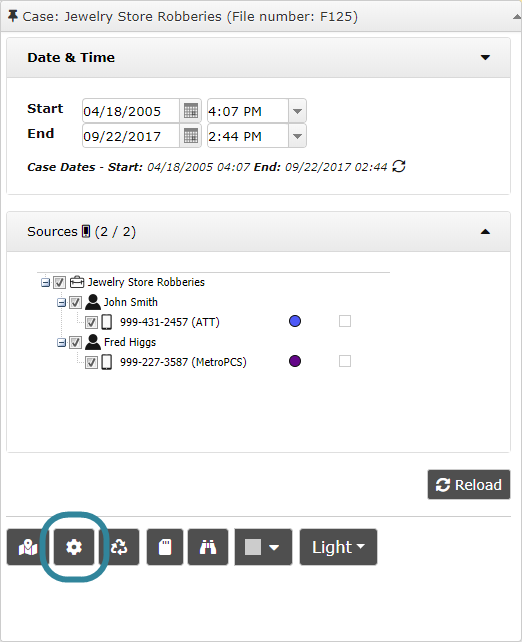
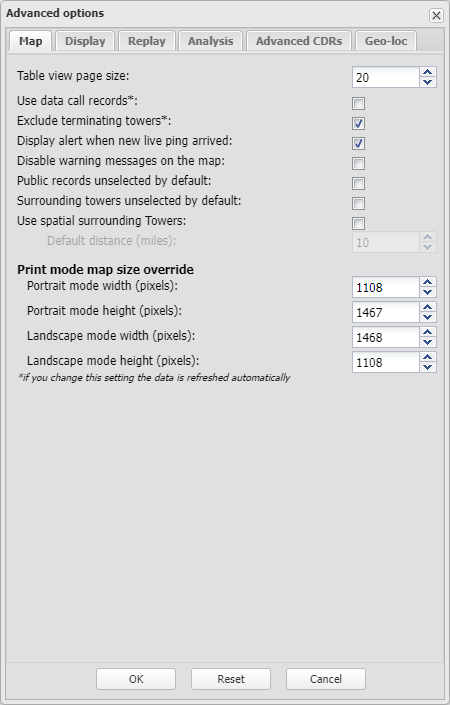
On the ESPA analysis center, open the Advanced options dialog box.
You can open the Advanced options dialog box from either the Input and settings view or the Map view.
- On the Input and settings view:
Click
 .
.
-
On the Map view:
- Hover over
 on the top-right of the map.
 -
Click
 then select Advanced options from the menu.
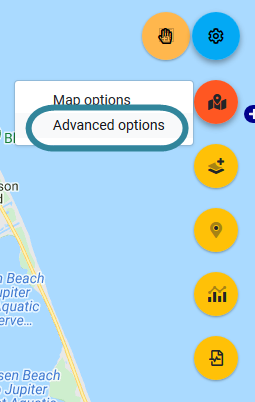
- Hover over
The Advanced options dialog box opens.
- On the Input and settings view:
-
On the Display tab it is recommended that you set the Target location display options as detailed below.
- Select Show draggable pop-ups without call-out. This is optional but it allows you to easily move the note around on the map view without having to change its latitude and longitude values manually using the Target location information dialog box.
- Clear Show transparent background in pop-up. This is optional but it makes the background of the note white and easier to read, however it does mean that you can't see the map view underneath it.
- Select Show only description in pop-up. This is optional but it removes all the target location information other than the description which is the text you most likely only want to include in your note.
-
 On the WNF analysis center
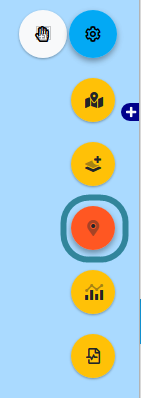
On the map of the WNF analysis center screen click
 and ensure the icon is orange
  . Note, if you are using WNF analysis center, then depending on the style of theme you have selected you may need to close another view to access this button.
 On the ESPA analysis center
- On the map of the WNF analysis center screen, hover over on the top-right of the map.
-
Click
 .
.
- On the map of the WNF analysis center screen, hover over
-
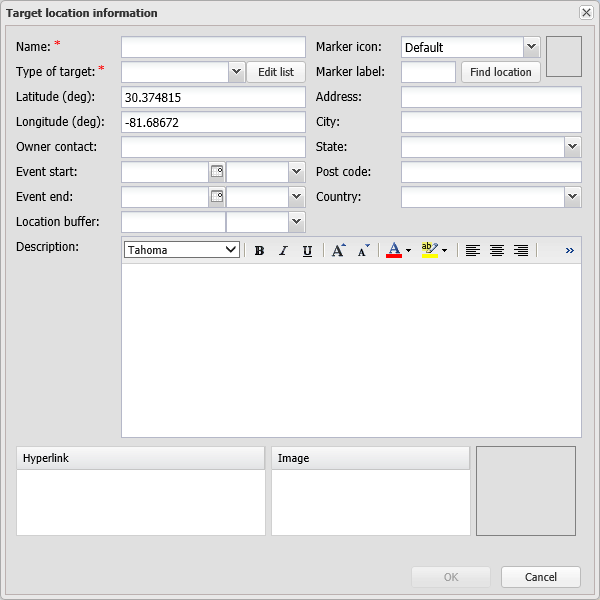
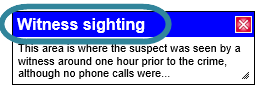
Left-click the map on the location you want to add a note to. The Target location information dialog box opens with the latitude and longitude of the location you clicked completed.
-
On the Target location information dialog box you must:
- In Name enter the title of the note.
- In Type of target select Notes.
- In Description enter the details of your note. If you require a description of any settings refer to Target location information dialog box.
-
Click OK.
The note is now displayed on the map, the Target locations tab, the Legend/Filter view and the Add/Edit location screen. If you want to edit the note once it is added click the title on the pop-up to re-open the Target location information dialog box. If you want to delete it refer to Managing locations.
You can add arrows to your map view using the draw arrow mode as described in the following procedure. You may also wish to add text beside the arrow, this can be done by either renaming the arrow as detailed in the following procedure or adding a note alongside it as detailed in To annotate your map view with notes. You can also save the arrow as a target location.
You can also click here for a short video showing how to use map drawing mode, including the arrow drawing mode.
-
On the map of the ESPA analysis center screen, hover over
on the top-right of the map.Click
 , then select Arrow from the menu.
 -
Left-click on the map to start drawing your arrow. You can left-click to create another point on your arrow or double left-click to complete your arrow.
Once you've completed your arrow the map view returns to the normal map mode which is indicated by the hand icon returning to orange
 .
. -
If you require to remove, rename, modify the position or appearance of the arrow then right-click the arrow to display the following menu.
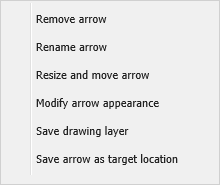
- To move the arrow to a different position or to change the size of it, select Resize and move arrow then click on the solid orange circles.
- To change the appearance of the arrow select Modify arrow appearance.
- To rename the arrow select Rename arrow. You may want to do this to add a short description of what the arrow is highlighting.
- To delete the arrow select Remove arrow.
- To add the arrow as a target location select Save arrow as target location. The Target location information dialog box opens with the latitude and longitude defined as being the point of the arrow. You can then enter the name and any other details you want to include then click OK.
-
Either click
 or right-click an area of the map outside a sector then from the menu select Save drawing layer.
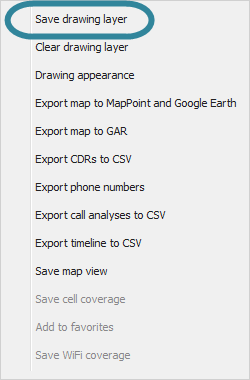
All the polygons, arrows and lines on the map are saved. To add the current map view, including all the polygons, arrows, lines, and pop-ups to the report refer to the relevant section either To add a map view to a report or To update an existing map view in a report.
You can add lines to your map view using the draw line mode as described in the following procedure. You may also wish to add text beside the line, this can be done by either renaming the line as detailed in the following procedure or adding a note alongside it as detailed in To annotate your map view with notes. You can also save the arrow as a target location.
You can also click here for a short video showing how to use map drawing mode, including the line drawing mode.
-
On the map of the ESPA analysis center screen, hover over
on the top-right of the map.Click
, then select Line from the menu. -
Left-click on the map to start drawing your line. You can left-click to create another point on your line or double left-click to complete your line.
Once you've completed your line the map view returns to the normal map mode which is indicated by the hand icon returning to orange
. -
If you require to remove, rename, modify the position or appearance of the line then right-click the line to display the following menu.
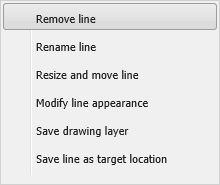
- To move the line to a different position or to change the size of it, select Resize and move line then click on the solid orange circles.
- To change the appearance of the line select Modify line appearance.
- To rename the line select Rename line. You may want to do this to add a short description of what the arrow is highlighting.
- To delete the line select Remove line.
- To add the line as a target location select Save line as target location. The Target location information dialog box opens with the latitude and longitude defined as being the start of the line. You can then enter the name and any other details you want to include then click OK.
-
Either click
or right-click an area of the map outside a sector then from the menu select Save drawing layer.
All the polygons, arrows and lines on the map are saved. To add the current map view, including all the polygons, arrows, lines, and pop-ups to the report refer to the relevant section either To add a map view to a report or To update an existing map view in a report.
You can add pop-ups containing sector information as described in the following procedure.
-
On the ESPA analysis center, open the Advanced options dialog box.
You can open the Advanced options dialog box from either the Input and settings view or the Map view.
- On the Input and settings view:
Click
.
-
On the Map view:
- Hover over on the top-right of the map.
-
Click
then select Advanced options from the menu.
- Hover over
The Advanced options dialog box opens.
- On the Input and settings view:
-
Select the Display tab then select Show draggable pop-ups without call-out.

-
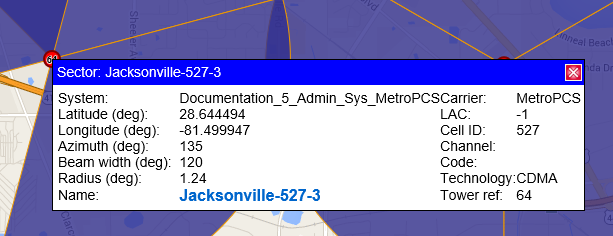
Left-click a sector on the map and the sector pop-up is displayed. You can open multiple sector pop-ups if required and you can also resize them. If you want to edit the sector information click the blue sector name to open the Sector information dialog box.
To add the current map view, including all the polygons, arrows, lines, and pop-ups to the report refer to the relevant section either To add a map view to a report or To update an existing map view in a report.
This procedure assumes you have created a report as detailed in the first three steps of To create a new report and that you have previously added a map view as detailed in To add a map view to a report.
If you currently have the <Report name> tab open then go directly to step 3.
-
On the ESPA analysis center screen's Case management view select the Analysis reports tab.
-
Right-click the report folder then click Edit on the displayed menu.
A new tab opens which is titled with the report's name.
-
On the <Report name> tab, in your report structure right-click the map view you want to edit. You can then select to either: immediately update the report with the current map view displayed on the ESPA analysis center screen, or load the map view you previously saved to the report, configure the new map then update it in the report.
To update immediately
-
To update the report with the current map view, in your report structure right-click the map view then select Update with current map view.
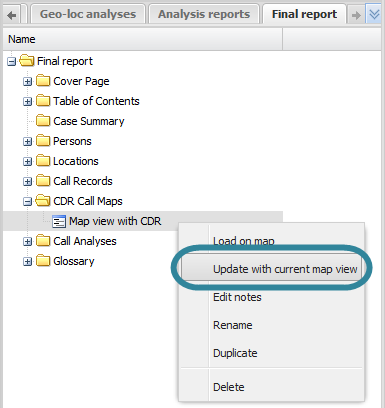
The map view is updated in your report.
To load the map view previously saved
-
In your report structure right-click the map view then select Load on map.
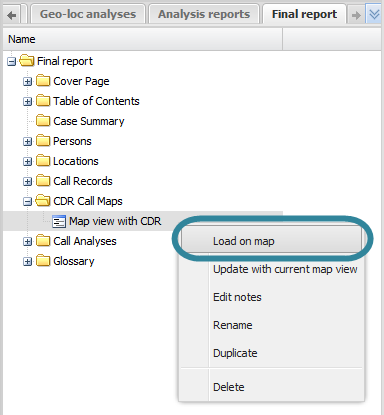
The map view previously saved is then displayed on the screen. For further information on all the settings previously saved refer to Add current map view.
-
Using the ESPA analysis center screen's features configure the new map as required.
-
To update the report with the new map view, in your report structure right-click the map view then select Update with current map view.
The map view is updated in your report.
-
This procedure details how to add a notes section that will be positioned alongside the map view in the report, it does not describe how to annotate the map itself with notes, that procedure is detailed in To annotate your map view with notes.
This procedure assumes you have created a report as detailed in the first three steps of To create a new report and that you have previously added a map view as detailed in To add a map view to a report.
If you currently have the <Report name> tab open then go directly to step 3.
-
On the ESPA analysis center screen's Case management view select the Analysis reports tab.
-
Right-click the report folder then click Edit on the displayed menu.
A new tab opens which is titled with the report's name.
-
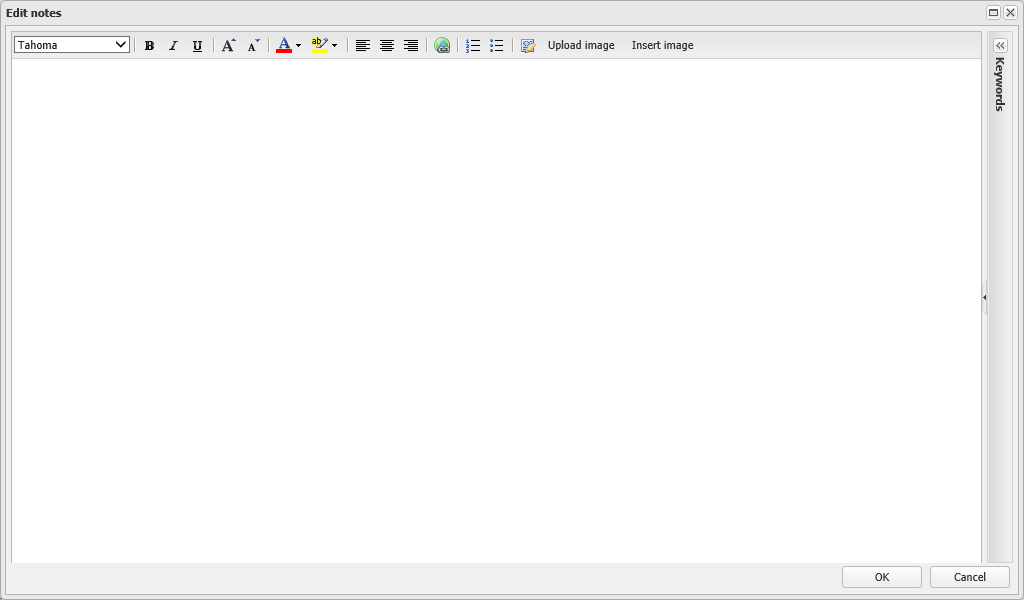
On the <Report name> tab, in your report structure right-click the map view then select Edit notes.
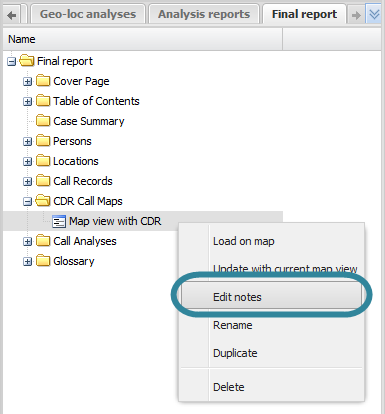
The Edit notes dialog box opens.
-
Enter and format your required text.
You can also include images in text items. Click Insert image to select images that you uploaded to your case. If you want to add an image directly to the report that you have not previously uploaded to your case then click Upload image. However, note that this image will only be available in this report and will not be available to include in other reports for this case.
To include keywords into your text, double-click an item listed in Keywords. For further information refer to Keywords.
Click OK when you are complete. The text is not displayed as a separate item in the report structure, but is instead contained as part of the map view and will appear in your report as an introduction before the map view content.
This procedure renames the item as it is displayed on the <Reports name> tab, this name does not appear in your report.
This procedure assumes you have created a report as detailed in the first three steps of To create a new report and added a map view as detailed in To add a map view to a report.
If you currently have the <Report name> tab open then go directly to step 3.
-
On the ESPA analysis center screen's Case management view select the Analysis reports tab.
-
Right-click the report folder then click Edit on the displayed menu.
A new tab opens which is titled with the report's name.
-
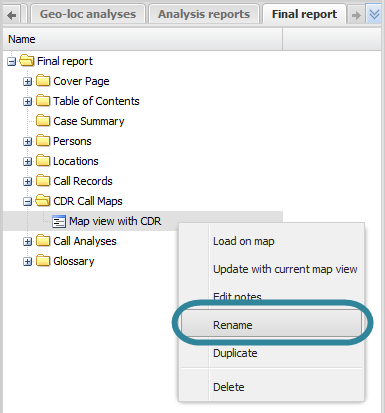
On the <Report name> tab, locate the position in your report of the map view then right-click and select Rename.
The Rename section dialog box opens.
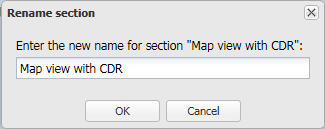
- Enter the new name for your map view then click OK. The name is updated on the <Reports name> tab.
This procedure assumes you have created a report as detailed in the first three steps of To create a new report and that you have previously added a map view item as detailed in To add a map view to a report.
If you currently have the <Report name> tab open then go directly to step 3.
-
On the ESPA analysis center screen's Case management view select the Analysis reports tab.
-
Right-click the report folder then click Edit on the displayed menu.
A new tab opens which is titled with the report's name.
-
On the <Report name> tab, locate the position in your report of the map view item then right-click and select Duplicate.
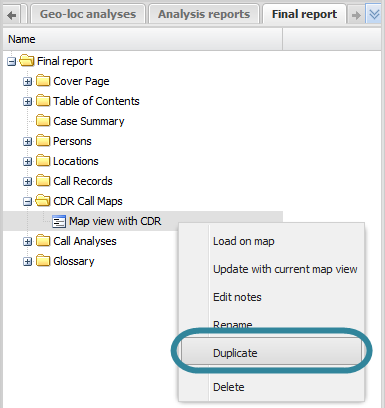
The Duplicate item dialog box opens.
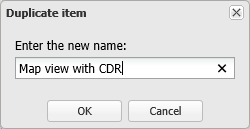
-
Enter a name for your new map view item then click OK. The duplicated map view item is displayed in the report structure. If you want to move it's position then left-click it and drag it to a new position.
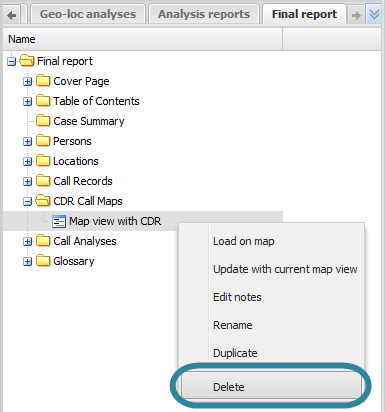
This procedure assumes you have created a report as detailed in the first three steps of To create a new report and added a map view as detailed in To add a map view to a report.
If you currently have the <Report name> tab open then go directly to step 3.
-
On the ESPA analysis center screen's Case management view select the Analysis reports tab.
-
Right-click the report folder then click Edit on the displayed menu.
A new tab opens which is titled with the report's name.
-
On the <Report name> tab, locate the position in your report for the map view then right-click and select Delete. Click OK on the Delete section dialog box to remove the map view item from the <Reports name> tab and as content within your report when you run a new version of your report.