Downloading a GAR snapshot analysis created using the GAR software
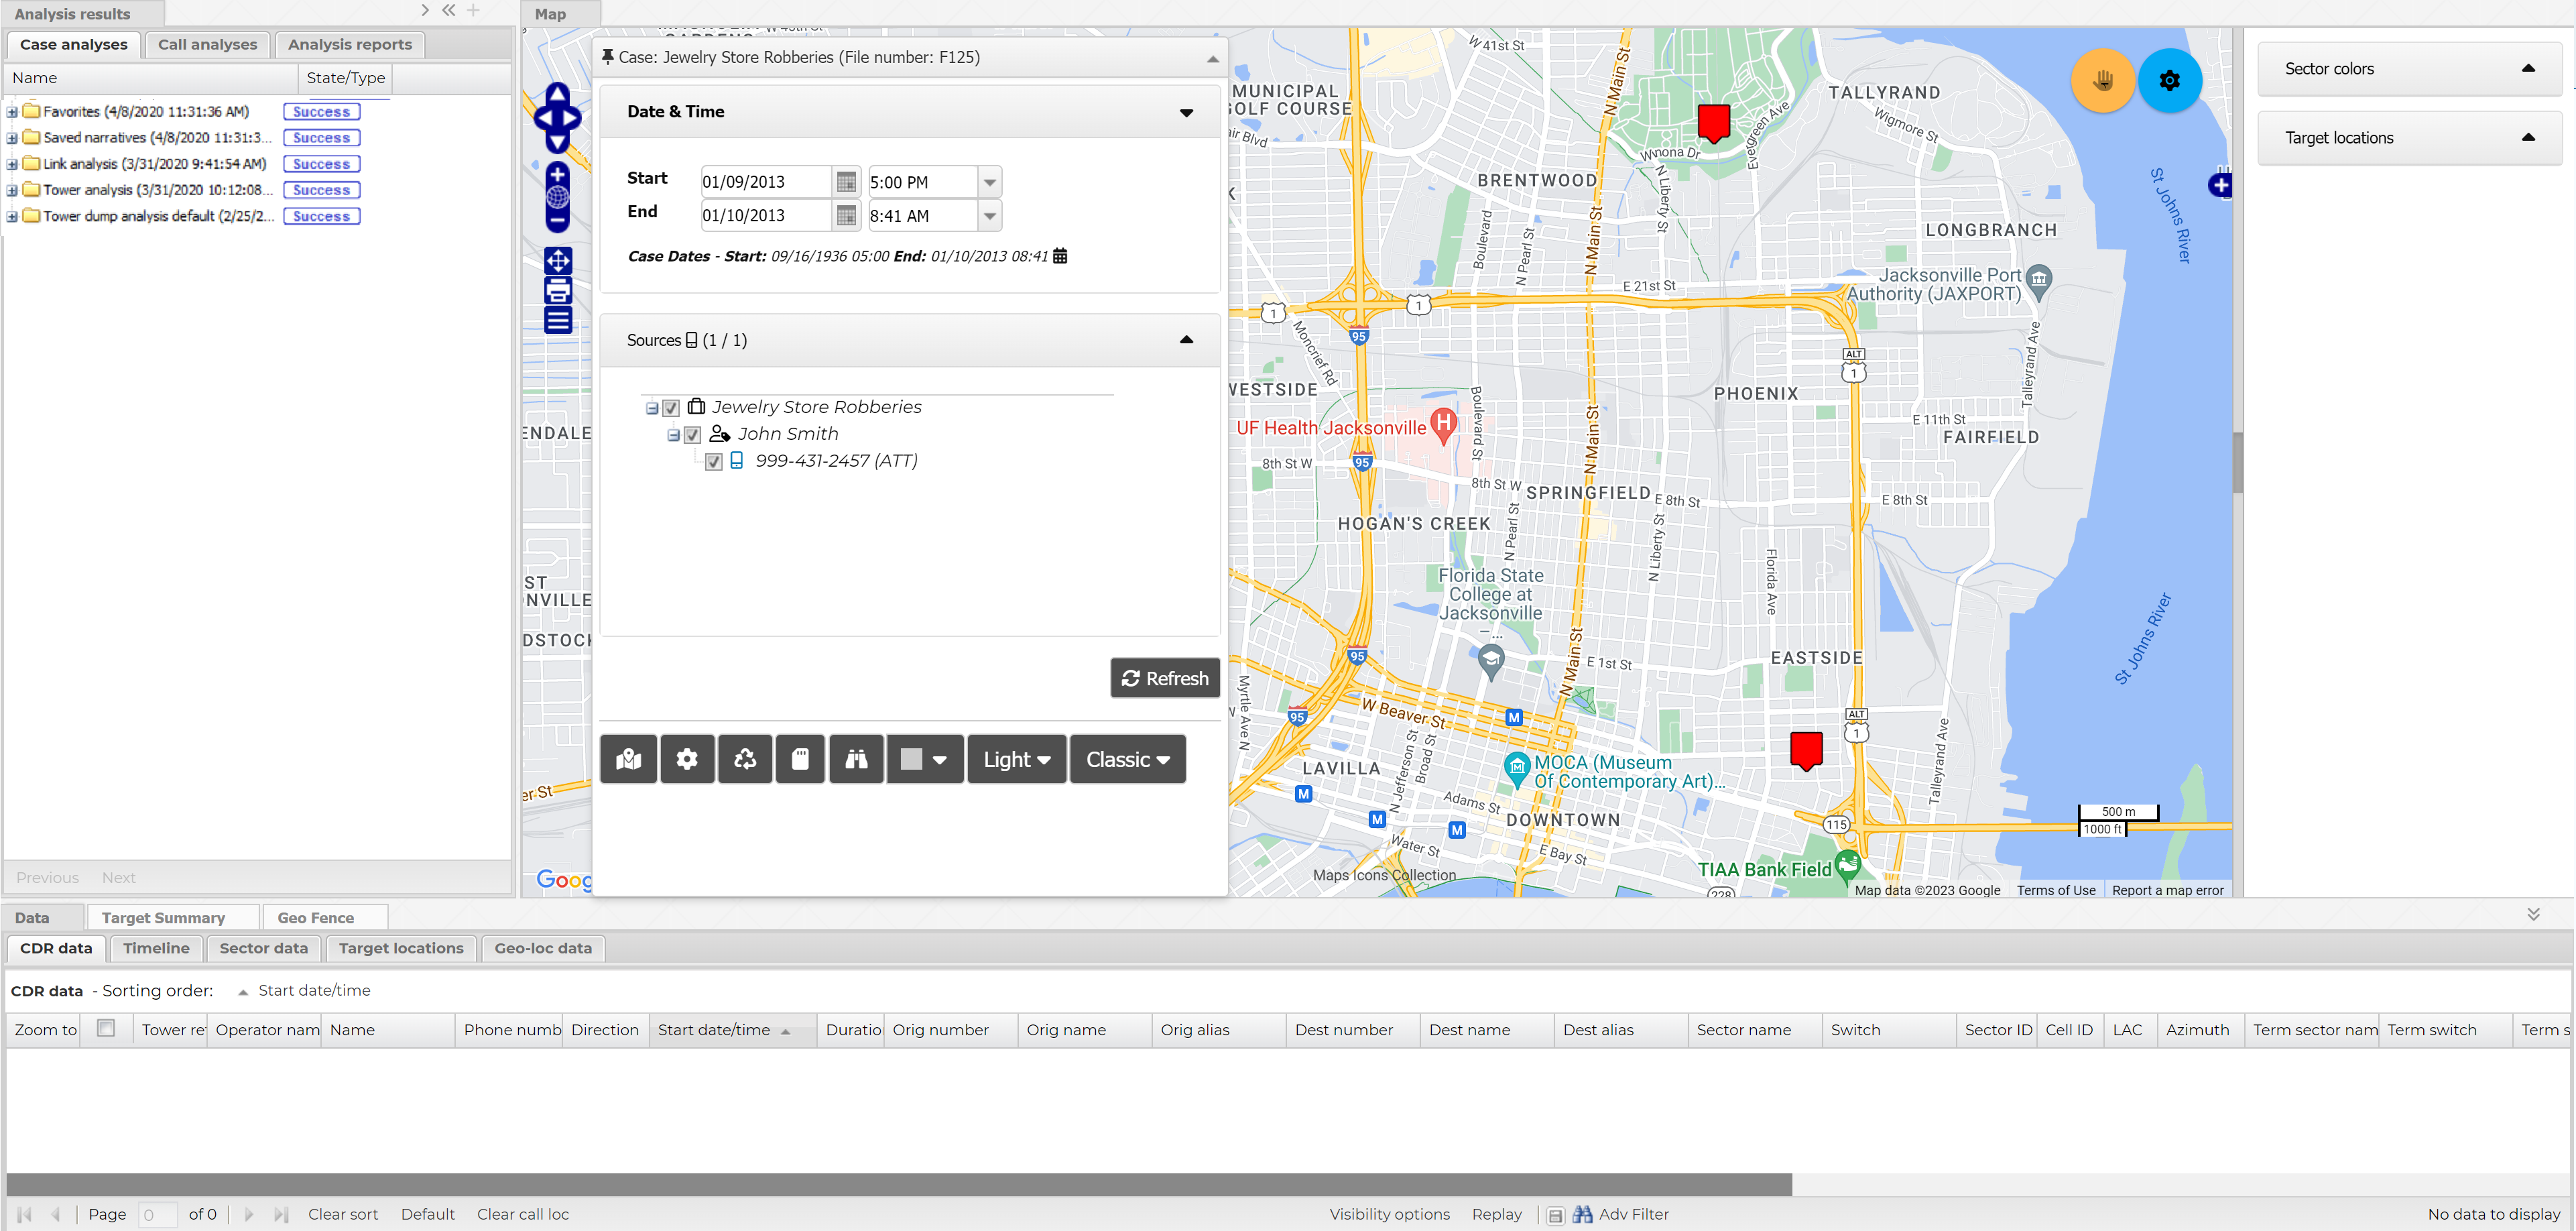
On the ESPA analysis center, hover over  on the top-right of the map, click
  then select Snapshot analysis from the menu. On the Snapshot selector dialog box, select Download GAR snapshot analysis result then click Apply. Use the Download GAR snapshot report dialog box to specify your analysis criteria, then click Download. Your snapshots are now available on the Case analyses tab's Snapshot Export folder.
This topic describes how to download a GAR snapshot analysis, previously created using the GAR software, to identify which cell towers provide coverage in a specific location.
Downloading a GAR snapshot analysis requires option E4 Phone data/analytics. If you do not have this option, you cannot select to download this analysis from the ESPA analysis center screen.
-
For the case you want to download a GAR snapshot analysis on, open the Manage case screen.
 Need help finding your case?
On the main menu click View cases. The screen that opens depends on your setting of View cases. If it is set to:
- Advanced view, then the Advanced view cases screen opens.
- If your case is listed on the Favorite & recent cases tab, click the case name to open the Manage case screen.
- If it is not listed on the Favorite & recent cases tab, then click the Cases tab. Use the search filters to help locate your case. You can also click
 to open the FILTERS group which allows you to set your own default filter defining what is displayed on this tab, for example you may wish to set it to cases that you created which are currently open.
For further information refer to Searching for a case.
- Grid view, then the View cases screen opens.
- If your case is listed under My recent cases click it to open the Manage case screen.
- If it is not listed under My recent cases then select your case from the table, using the search filters to help locate it if required. Note, by default the search is set to only display cases that you created; if you are not the original creator but an assignee then ensure you set Case filter to Assigned cases before clicking Search.
- Tree view, then the View i-cases screen opens.
- Click
 at the top-right of the screen to open either the View Cases or Advanced view cases screen and follow the above description.
- Click
- Advanced view, then the Advanced view cases screen opens.
-
Click
 at the top of the screen.
The ESPA analysis center screen opens.
-
Hover over
on the top-right of the map, click then select Snapshot analysis from the menu.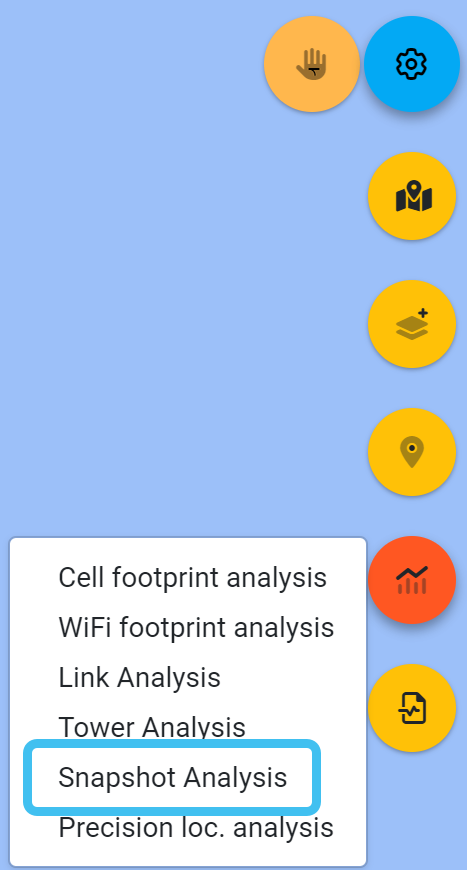
The Snapshot selector dialog box opens.
-
Select Download GAR snapshot analysis result then click Apply.
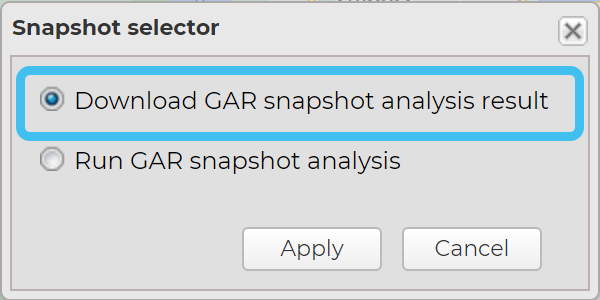
The Download GAR snapshot report dialog box opens.
-
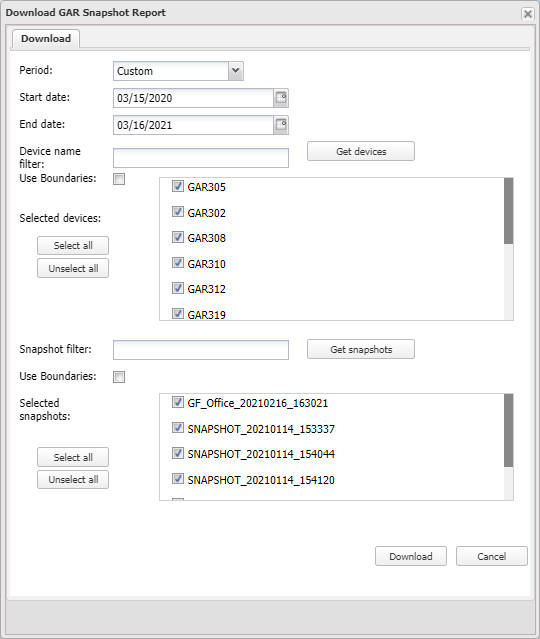
The Download GAR snapshot report dialog box allows you to download your GAR snapshots so that you can identify which cell towers are in a specific area. Use the settings to find the GAR snapshots you want to download. The settings allow you to filter the displayed GAR snapshots based on which GAR unit was used, the name of the snapshot and the map's current zoom settings.
-
Once you have selected the GAR snapshots you want click Download.
-
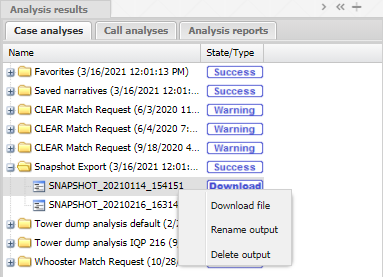
Your snapshots are now available on the Case analyses tab's Snapshot Export folder, where you can download in both .html and .csv format.
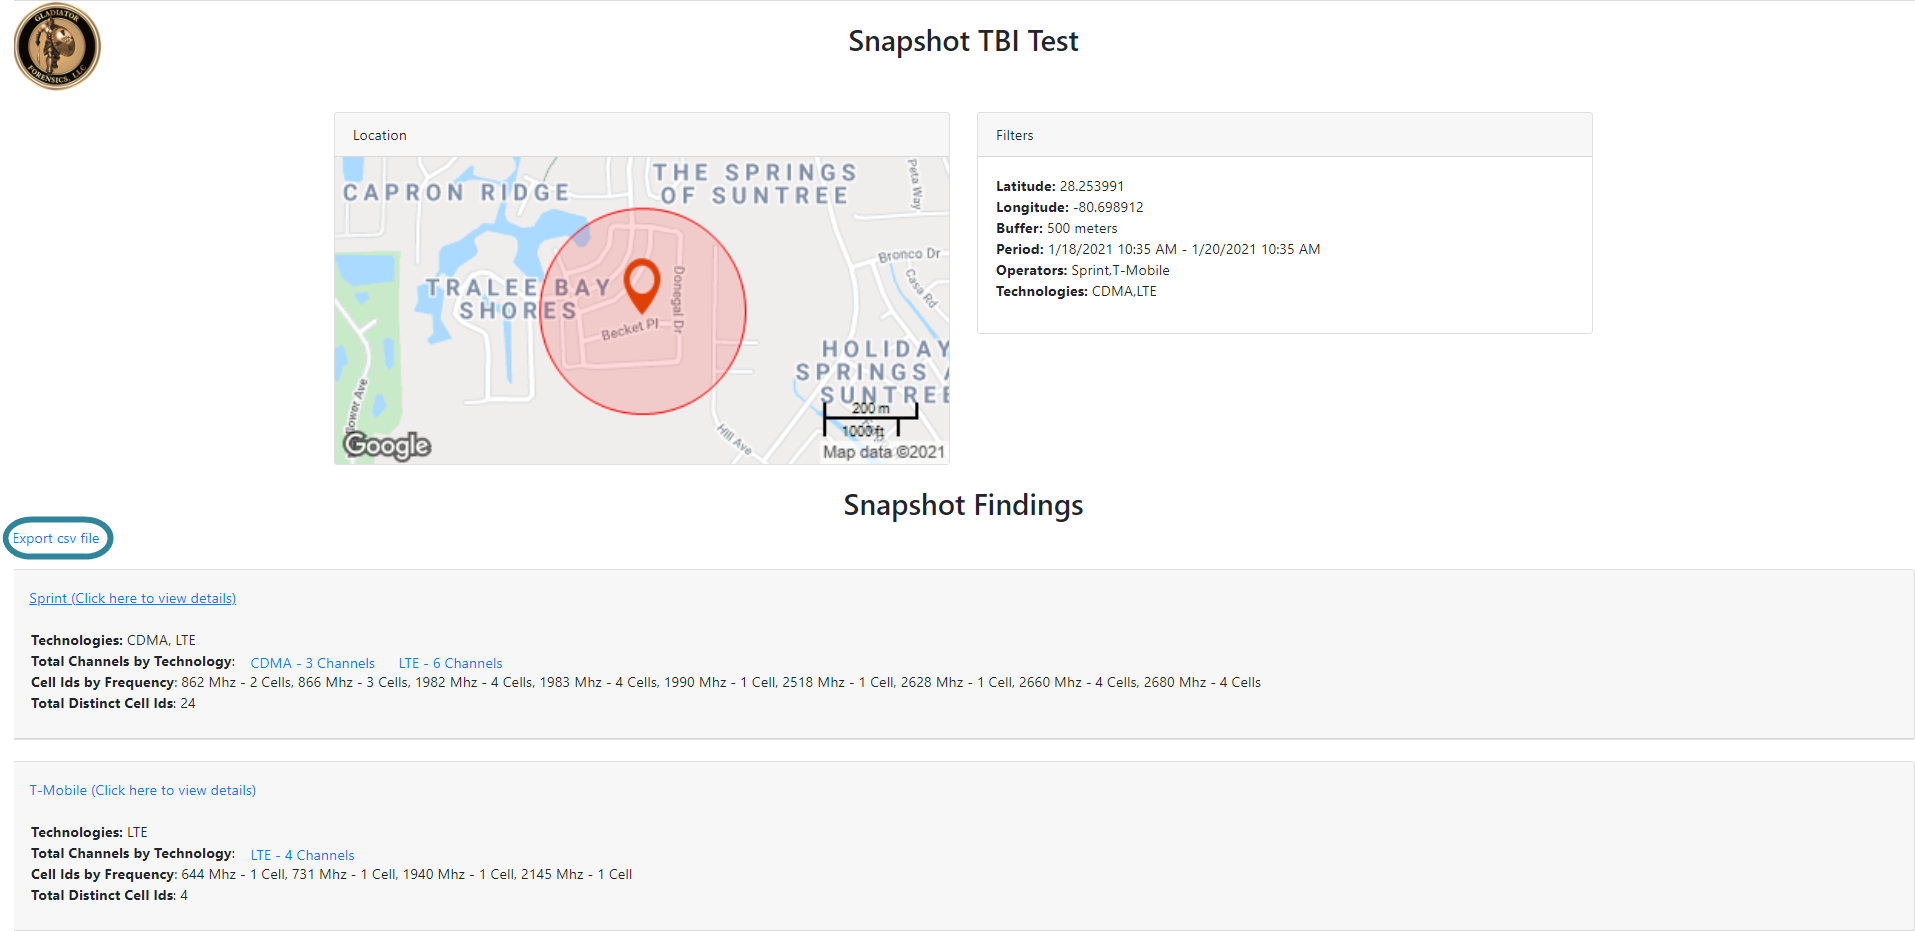
Examples of the results screen are shown below: In the results you can:
-
Click Export csv file to export the results for use elsewhere.
-
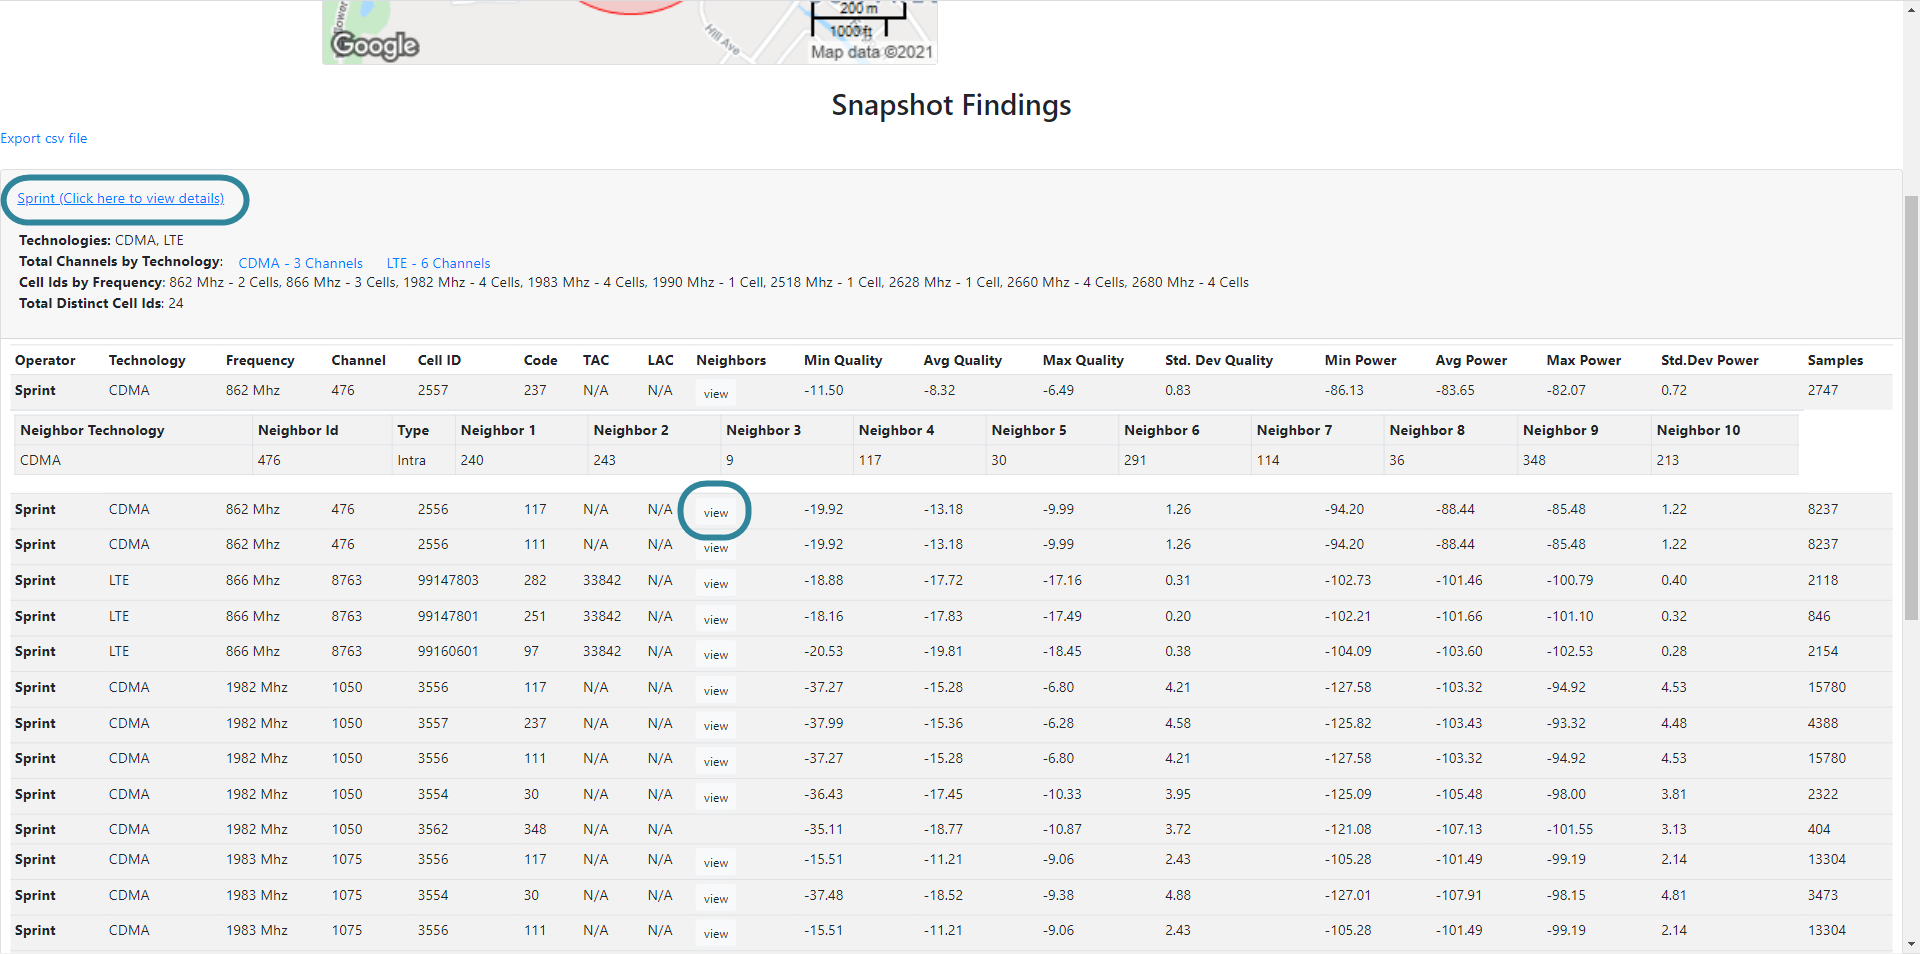
Click the operator link to expand the results and view the detail in a tabular format. This table also allows you to view the neighboring cells.
-
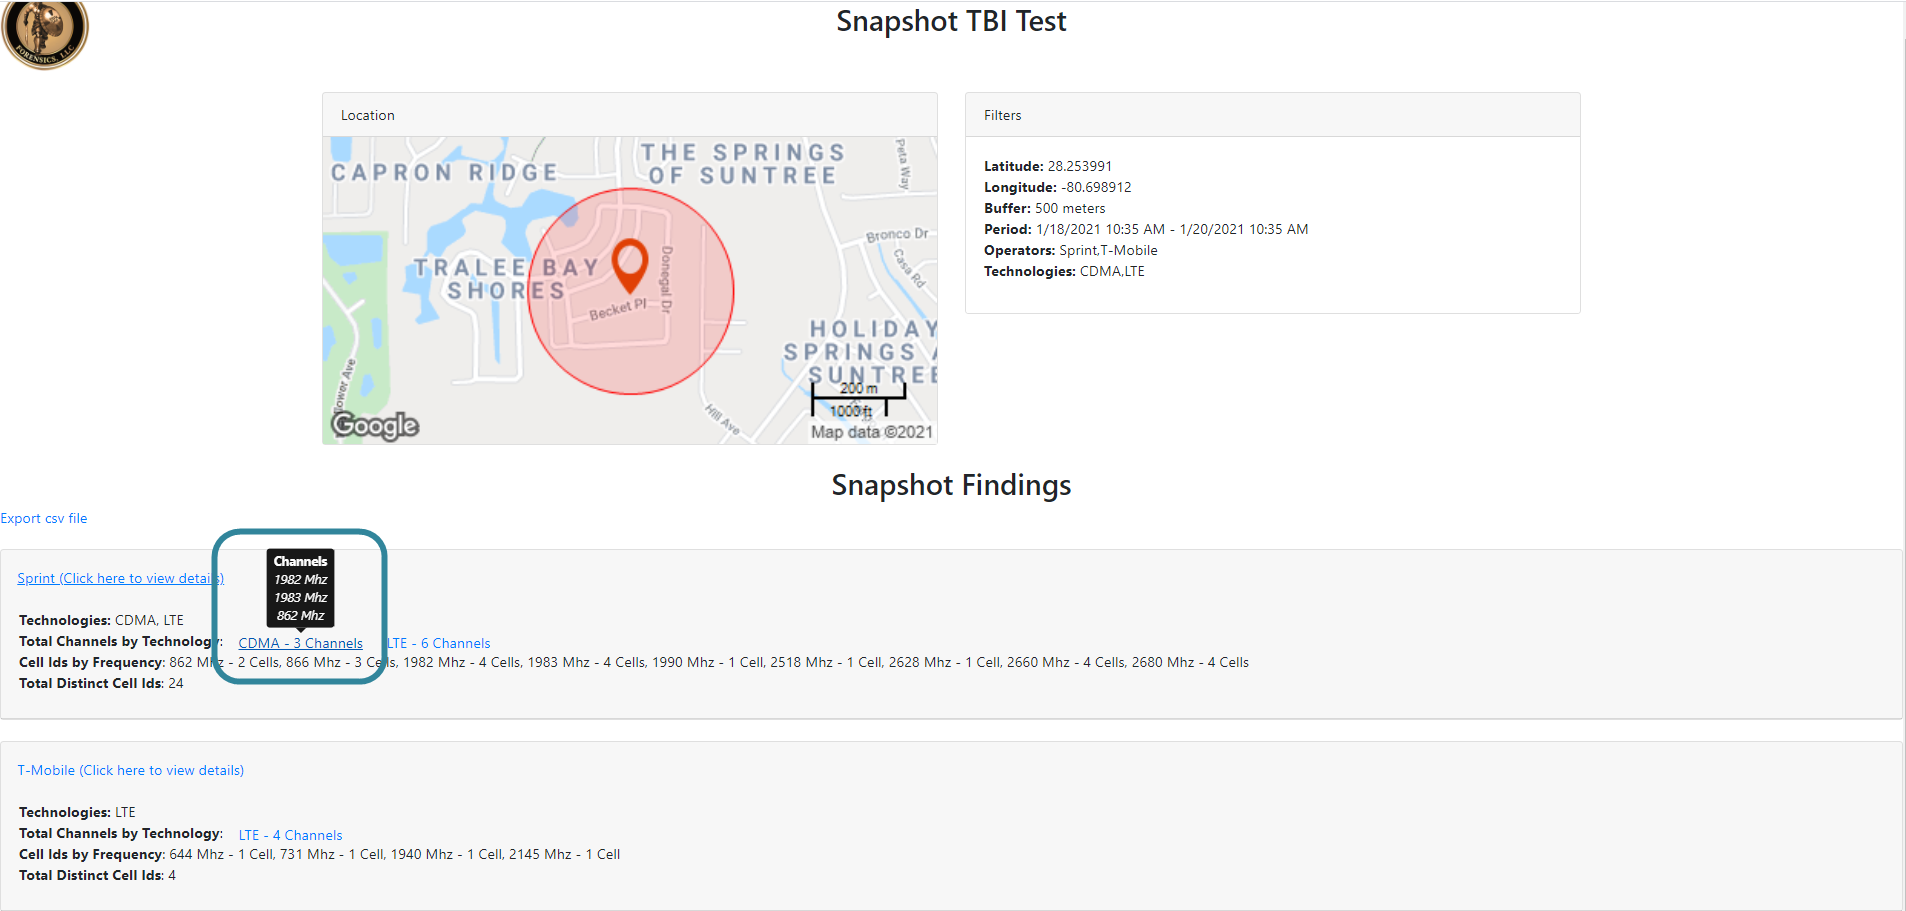
Hover over the total channels per technology to view the frequency channels.
-