Getting started with investigating case data visually
This topic describes how to get started visually investigating the case data on either the WNF analysis center or the ESPA analysis center .
Both these analysis centers allow you to investigate the case data in exactly the same way. The only difference is how the views can be displayed.
-
WNF analysis center: This is the traditional screen. The different views can be opened and closed but they all remain in the same location on the same browser window.
-
ESPA analysis center: With the ESPA analysis center, simply because a view is attached to a particular area of the screen by default, does not mean it has to stay there. You can float a view by clicking the view and dragging it down until it floats. Once a view is floating you can attach it to a particular part of the screen, this is known as docking. To float, move and dock a view, click in the view title and float it, then drag it to the region where you want to dock it, and drop it in the region. If your workspace is large, for example if you are using multiple monitors, this analysis center also provides the flexibility to open the different views in separate browser windows.
If you require an overview of the ESPA analysis center screen or a detailed description of its settings refer to ESPA analysis center screen.
NOTE: Depending on how your administrator has configured your OSS-ESPA account you may only be able to investigate case data if you are the case creator, a case assignee or an administrator.
To visually investigate case data open the ESPA analysis center screen as described in the following procedure.
-
For the case you want to view open the Manage case screen.
 Need help finding your case?
On the main menu click View cases. The screen that opens depends on your setting of View cases. If it is set to:
- Advanced view, then the Advanced view cases screen opens.
- If your case is listed on the Favorite & recent cases tab, click the case name to open the Manage case screen.
- If it is not listed on the Favorite & recent cases tab, then click the Cases tab. Use the search filters to help locate your case. You can also click
 to open the FILTERS group which allows you to set your own default filter defining what is displayed on this tab, for example you may wish to set it to cases that you created which are currently open.
For further information refer to Searching for a case.
- Grid view, then the View cases screen opens.
- If your case is listed under My recent cases click it to open the Manage case screen.
- If it is not listed under My recent cases then select your case from the table, using the search filters to help locate it if required. Note, by default the search is set to only display cases that you created; if you are not the original creator but an assignee then ensure you set Case filter to Assigned cases before clicking Search.
- Tree view, then the View i-cases screen opens.
- Click
 at the top-right of the screen to open either the View Cases or Advanced view cases screen and follow the above description.
- Click
- Advanced view, then the Advanced view cases screen opens.
-
Click
 at the top of the screen.
The ESPA analysis center screen opens.
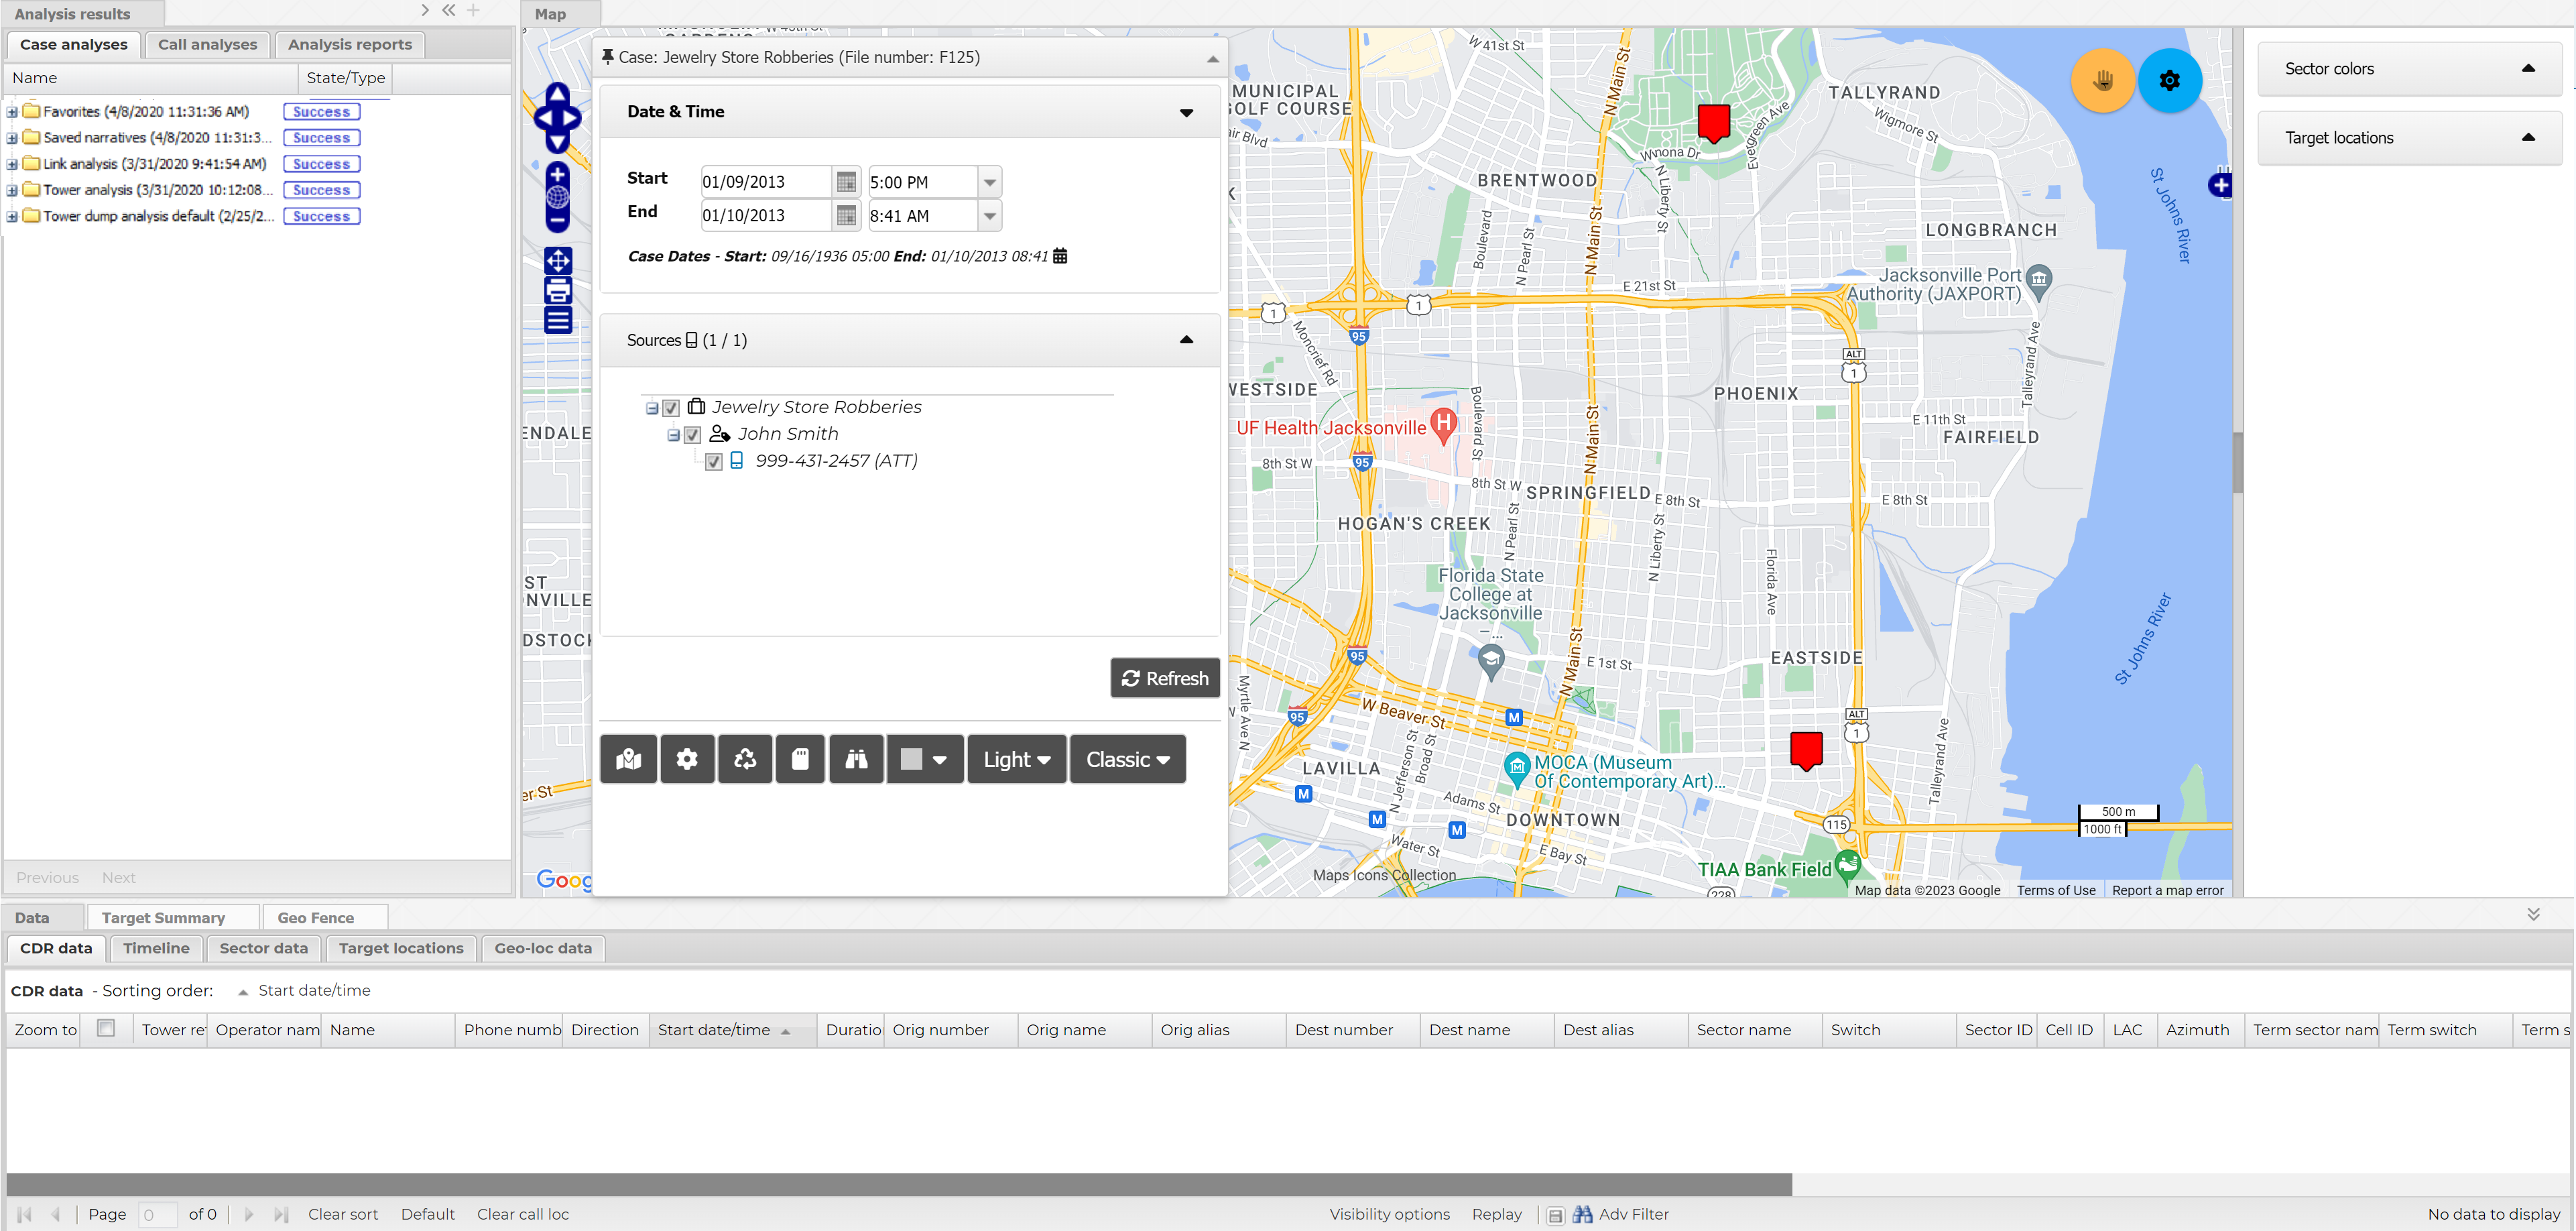
- If you want to open views in separate windows it is recommended that you do it now as it must be done prior to clicking Refresh. For further information refer to Opening a view in a new window.
-
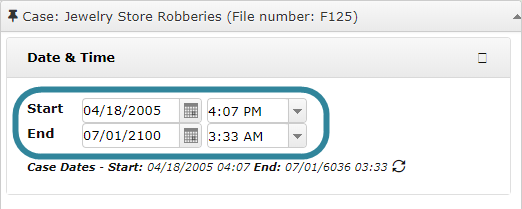
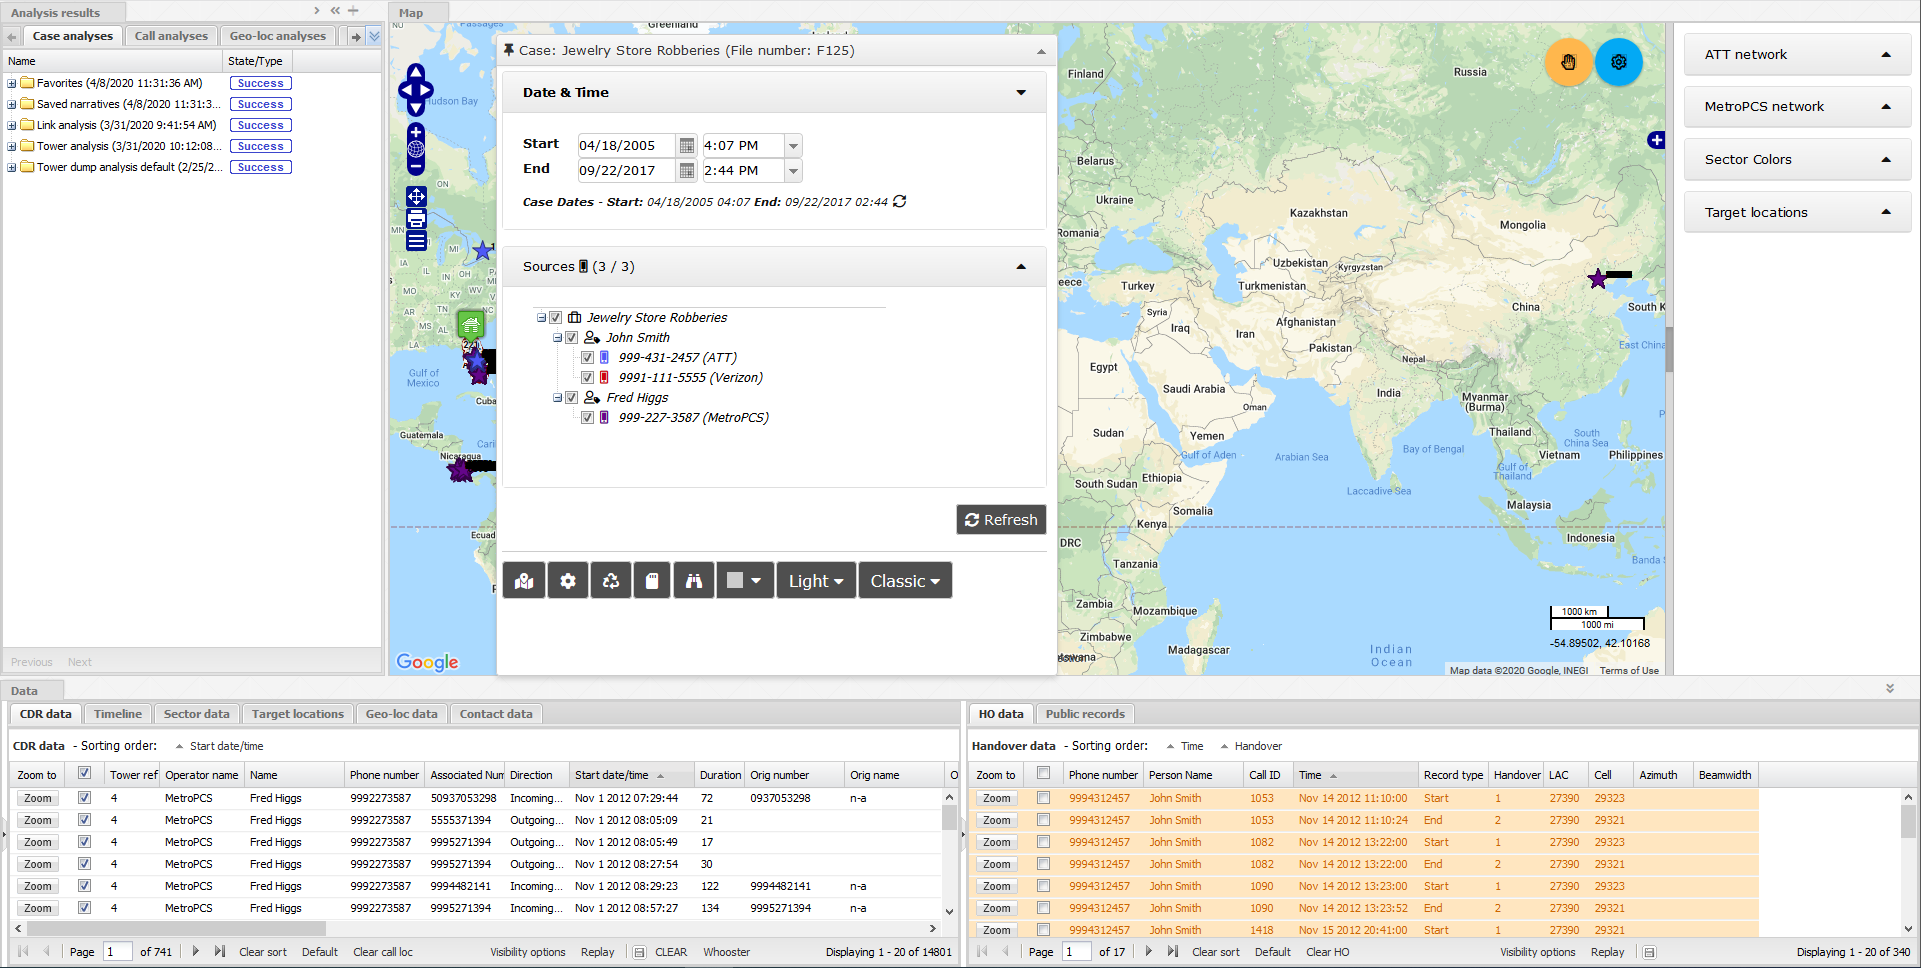
The Start and End dates and time used by default are those of the first and last records in all the source files uploaded to the case. If you want to change these dates enter your required dates, or alternatively you can select events from Event timeline.
-
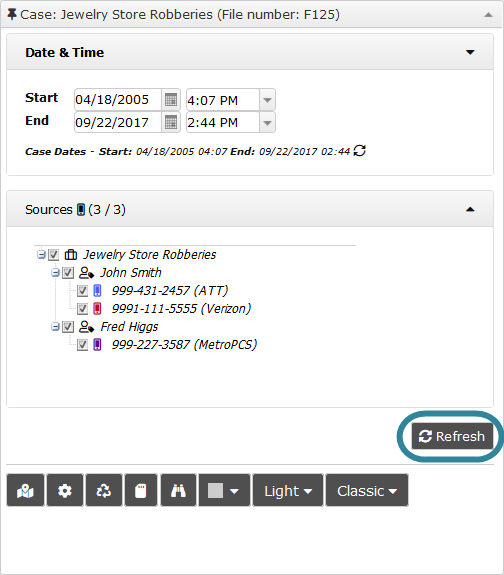
Select which sources you want to display data for. For example, if you believe there is a link between multiple phone users you may want to select them together or if you know there is no link you may only want to select one phone user at a time.
-
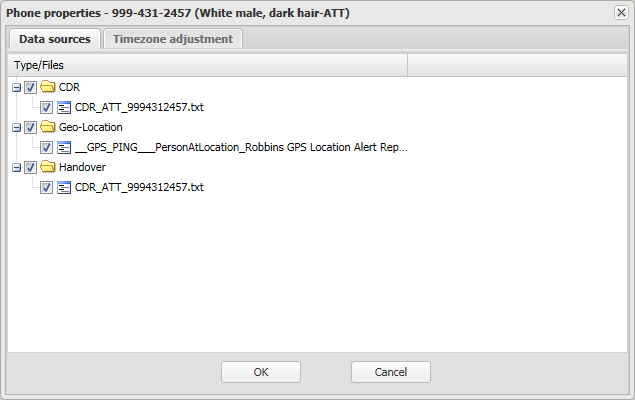
Initially you will likely want to use all of your data sources in your analysis and by default that is what is selected. However if you do not want to use them all then click the phone number to select which of them you want to use.
The Phone properties dialog box opens. Select the data sources you want to use then click OK.
-
Click Refresh.
OSS-ESPA retrieves the data for the phone numbers you selected within the selected time period.
On the central map view it displays, for example:
- All the target locations for the case.
- The sectors used by the selected phones within the selected time period.
- The networks for the phones you selected may be displayed, depending on the configuration of your account.
- A tower reference number for the used sectors.
On the Data view it displays:
- The CDR data for the selected phones within the selected time period.
- The sector data for the sectors used by the selected phones within the selected time period.
- All the target locations associated with the case.
- The Data view may optionally also display a timeline, contact data, public records, geo-location data, TA data and handover data.
On the Case management view it displays:
- The Case analyses tab which displays any analyses you have run. For further information refer to Using drive data and Using public record files when investigating a case.
- The Call analyses tab which displays a statistical analysis of the phone numbers you selected. For further information refer to Using call analyses.
- The Analysis reports tab which allows you to manage your advanced analysis reports. For further information refer to Using advanced analysis reports.
- The People and devices tab which allows you to view and edit targets and their associates, and add new targets. It also allows you to view which targets in other cases the associate has also been in contact with (ICW). For further information refer to Using the People and devices tab.
- The Locations tab which allows you to view, edit and add new locations. For further information refer to Using the Locations tab.
-
You can now use all the features on the ESPA analysis center screen to investigate your case. For further information refer to the other topics in Investigating case data visually on the ESPA analysis center.
NOTE: If information is not displaying on the map as expected, for example you have the network labels overlay selected yet the network labels are not displaying, then this is likely due to a previous internet connection issue. To resolve this you should delete your browsing history ensuring Cached images and files and Cookies and other site data are deleted. To do this in Chrome, click  then More tools, then Clear browsing history to open the Clear browsing history dialog box. On the Basic tab, ensure Cached images and files and Cookies and other site dataare selected then click Clear data.