Monitoring movement on the Sentinel screen
This topic describes how to use the Sentinel screen to monitor the ongoing communications and movement of a person. Prior to monitoring a person you must have created a case as described in Creating a case for intercept monitoring (PRTT and Wiretap).
This feature requires option E14 Sentinel. If you do not have this option this feature is not available.
-
Open the Sentinel screen. This screen can be opened in a number of ways, for example:
-
If you are on the Advanced view cases screen, in the Actions column click
 to open the Sentinel screen.
 - If you are on the View i-cases screen right click either a case, person, phone number or i-case and select Open Sentinel view.
-
If you are on the Manage case screen for a case click
which is at the top-right of every screen to open the Sentinel screen. 
-
- On the Input and Settings view, set Sentinel Mode to Real time.
- In Phones ensure all the CASEID (LIID) you want to monitor are selected.
-
In Date & Time use View the last x hours to enter the time period over which you want to view the communications for.
-
If you have changed Phones or Date & Time then you must click Refresh.
NOTE: If your Sentinel screen disconnects unexpectedly it may be due to your Web browser settings. For information on resolving this issue refer to How to stop Sentinel disconnecting.
-
If there are communications already available that occurred during the time period you selected then the screen will display the data and you can now monitor the movements on the map as new communications arrive.
- All the used sectors and GPS ping locations are displayed.
-
The person's last known call location is marked with a moving straight line
 . If the most recent location is a sector with no azimuth defined then this straight line is displayed moving over 360 degrees.
 -
The person's current activities are marked with moving curved lines
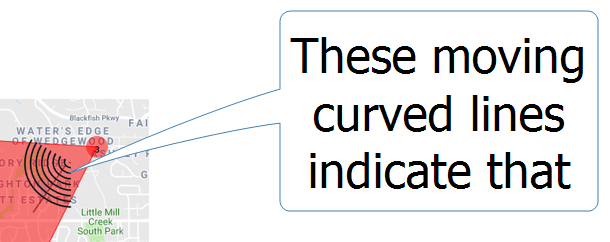 . If the current activity locations is a sector with no azimuth defined then these curved lines are displayed over 360 degrees. Current activities are defined as:
 - a call or data session in progress. Note, that the map displays all the sectors that have been used during the call, not just the call's latest sector. The sector that is currently being used is displayed like this , whereas the previous sectors show no moving curved lines.
- an SMS that occurred in the previous 60 seconds.
- GPS pings that occurred in the previous 60 seconds.
NOTE: By default this animation is configured to display. However if you want to switch them off then you can use the Show last known animation and Show current activities animation settings. To change these settings on the map click
 , click
  and click the Location events tab.
 -
If you have field units with GATA equipment installed then you can also use them to locate a device. To do this:
-
On the Map view select
then  .
.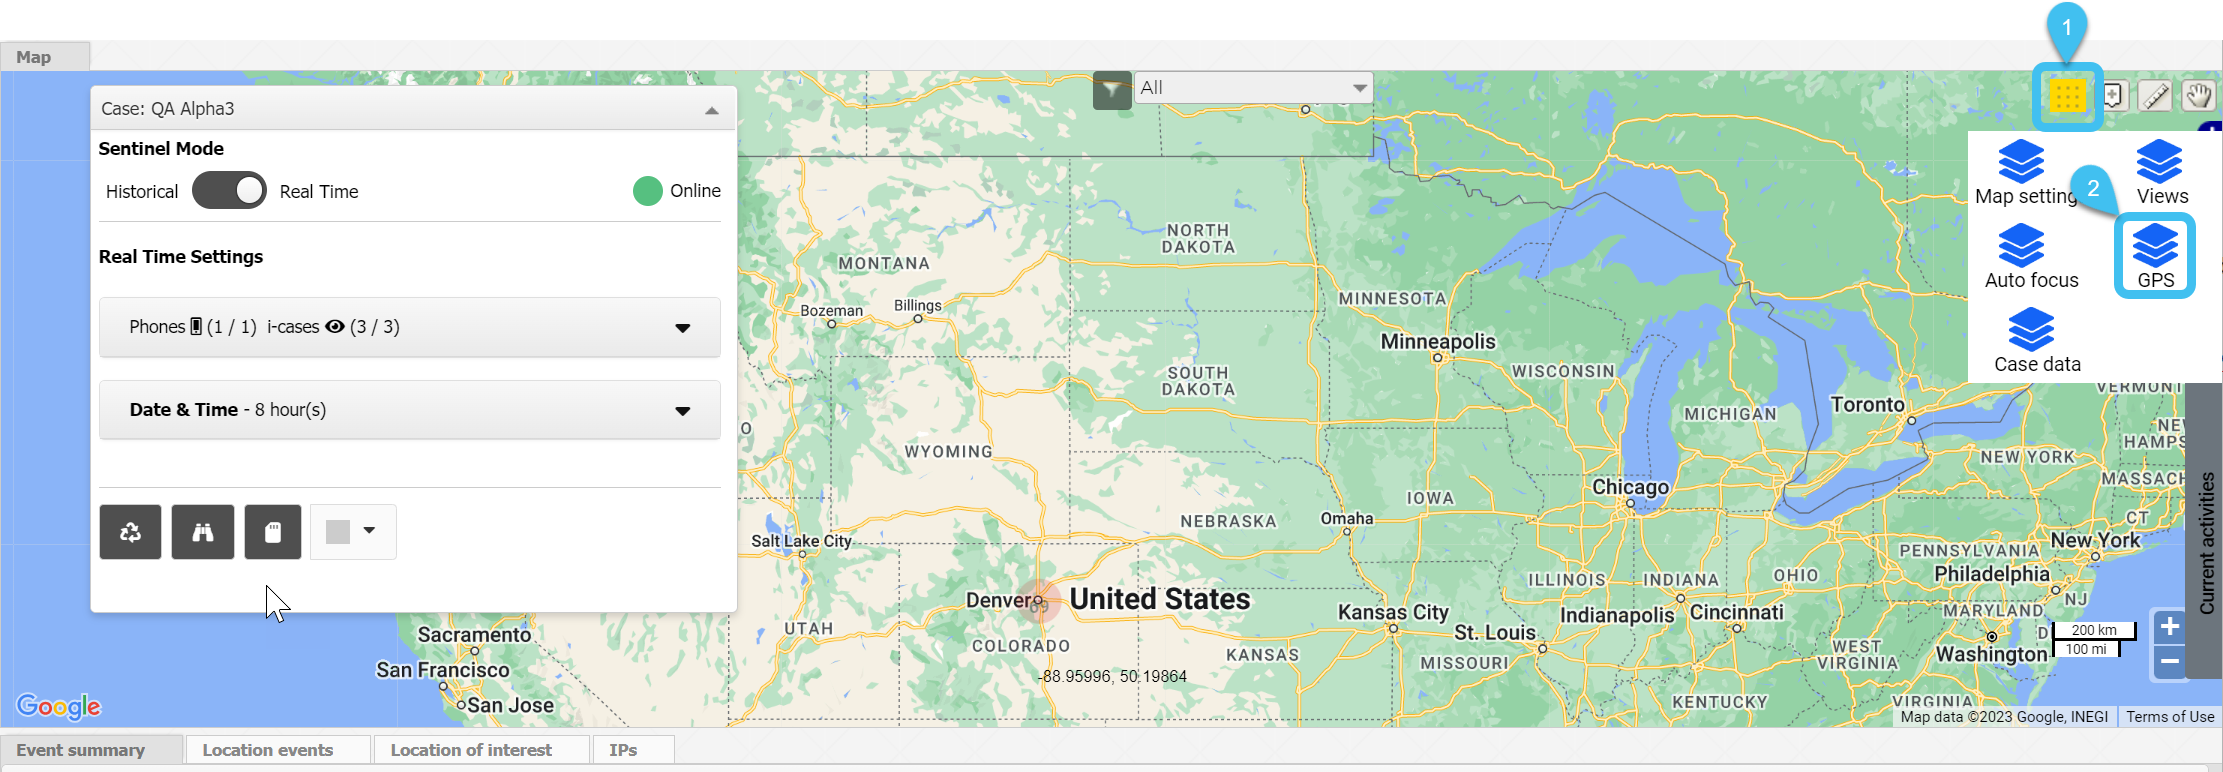
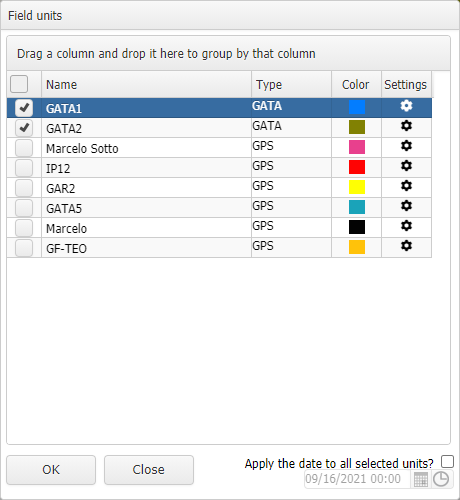
The Field units dialog box opens.
-
Using the check-boxes, select which units you want to view.
-
If you want to configure any settings associated with a field unit then click
 . The Field unit settings dialog box opens. Configure the settings as required then click Save. For further information on the settings refer to Field unit settings dialog box.
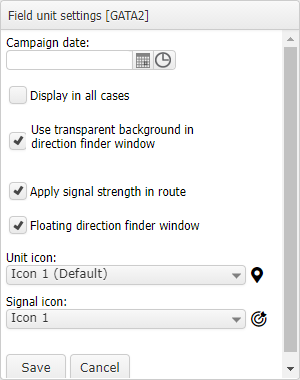
- Click OK to close the Field unit dialog box.
-
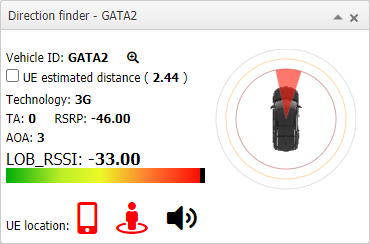
The Direction finder pop-up for the GATA field units that are currently active display on the screen. It displays information gathered from GATA (Gladiator Autonomous Target Acquisition) field units which can help you find devices of interest. For further information refer to Direction finder pop-up.
If the Direction finder pop-up does not display then click
, click  . On the Views dialog box, ensure that in GATA , Direction finder is selected.
-
-
If you want to analyze the existing data in further detail, for example to determine frequent locations or to determine where the person may sleep, then use the ESPA analysis center screen.
There are a number of additional tasks you may want to consider whilst using the Sentinel screen:
What is available to display on the Location events view and the map is dependent on the communications with location data that occur during the time you set in View the last x hours on the Input and settings view. You can filter these events further using either the Location events view and the map; which you use is irrelevant as they are synchronized. For example you may want to filter the events to only show the last known event, the current events or the recent events. To filter either on the:
- map click
 and select your required filter, or
 - Location events view click Filter and select your required filter.
For further information on each of these filter options refer to Filter.
You can set which of the available data is displayed on these views and what the data columns are named. You can also group, filter and sort the listings on the views. If you have a preferred layout you can also save it as your personal default and for use on every case. For further information refer to Using basic features of the Sentinel screen views.
Setting the colors of the views' borders for a case is useful if you are monitoring multiple cases and you are opening views in new windows. It means you can easily identify which views are for which case based on their color. To set the color, on the Input and settings view click  , select your color then click Apply.
If your workspace is large, possibly you have multiple monitors then you may prefer to open the views in individual screens, for example you may want to open the Location events view on a separate window. To do this, click  at the top-right of each view.
NOTE: You can only perform this when Sentinel Mode is set to Historical. Therefore if you are going to use the Sentinel screen in real time mode you must configure the separate windows as you require them first and then change the Sentinel mode to Real Time.
You may want the map location and zoom remain the same as you have them currently displayed on the map. This can be useful for a number of reasons, for example: you may wish to monitor movements around a specific location, or it may give you a better overall view of the location of a new event when it occurs rather than it zooming in closely to the event which may make it difficult for you to at first determine the new location relative to the previous one. To do this, set the map to your preferred location and zoom setting then click  .
.
You may want to add an important location to the map quickly so that you can easily jump to it. This can be done using an anchor.
- To add an anchor, right-click the map in the required location and select Add anchor. You can only add one anchor to the map. If you have multiple locations of interest then you must add them as locations and then you can click Zoom on the Locations of interest view to center them on the display. For further information on creating target locations refer to To create a new location.
- To jump to the anchor, click
 .
. - To remove an anchor, right-click anywhere on the map and select Remove anchor.
You may want to measure the distance between different locations, for example if you believe a person is heading for a particular location measuring the distance between their current location and their destination could give you an approximate time for their arrival.
With your map displaying the points you want to measure between:
- Click
 at the top-right of the map to ensure the map is in the measure distance mode. This icon is displayed in orange
  when you are in the measure distance mode.
 -
Left-click on the map to start measuring your distance. You can left-click to create another point on your distance measurement or double left-click to complete your distance measurement.
The distance is displayed in both miles and km at the bottom of the map.
Once you've completed your measurement right-click the map to return to the normal map mode which is indicated by the hand icon returning to orange
 .
.
You can configure how items are displayed on the map. For example, you can set whether or not sectors are displayed as solid wedges or with open arms, and whether call-outs are solid or transparent. To do this:
-
On the Map view select
then .The Map Settings dialog box opens.
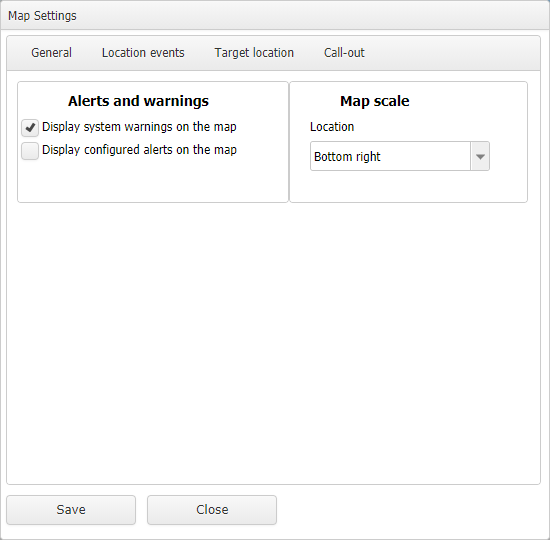
- Use the available settings on this dialog to configure how the various items display on the map. For further information on the available settings refer to the Map Settings dialog box.
You can add tags and notes to selected items on the Map view, the Event summary view and the Message summary view. You can then view and use these in other areas as described in Add tag and note dialog box. To add tags and note:
-
Right-click a communications item on the map or on the views.
The Add tag and note dialog box opens.
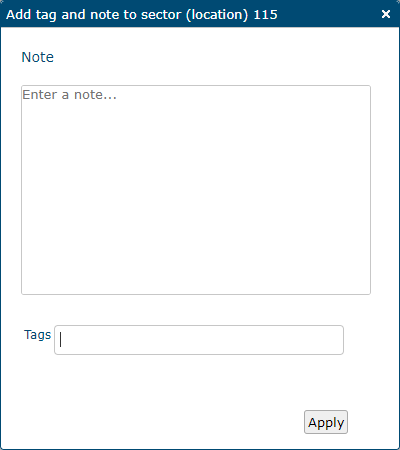
- Enter your notes or tags. Note, you cannot use spaces in tags.
- Click Apply.