WiFi footprint analysis dialog box
This topic describes the purpose of the WiFi footprint analysis dialog box, how to access it and all the settings and buttons on it.
This dialog box requires option E12 WiFi data/analytics. If you do not have this option you cannot access this dialog box.
The WiFi footprint analysis dialog box allows you to select the type of WiFi analysis results you require and to select applicable drive test devices to run your analysis on. The advanced settings allow you to edit settings associated with the output grids, signal coverage threshold and bands, or to generate a downloadable Google Earth output. Once you have made these selections it allows you to run your analysis.
The WiFi analysis creates results that detail:
- the WiFi networks of interest that you identified using this dialog box, such as the WiFi networks surrounding a target location. When you open the analysis these results are displayed on the WiFi coverage tab.
- all the WiFi networks identified during the drive for the area selected by the map zoom setting. When you open the analysis these results are displayed on the WiFi networks tab.
NOTE: The drive test files that are available for selection on this dialog box are also filtered by the map area that is displayed on the ESPA analysis center screen.
If you require information on running an analysis refer to Preparing WiFi footprint analysis evidence.
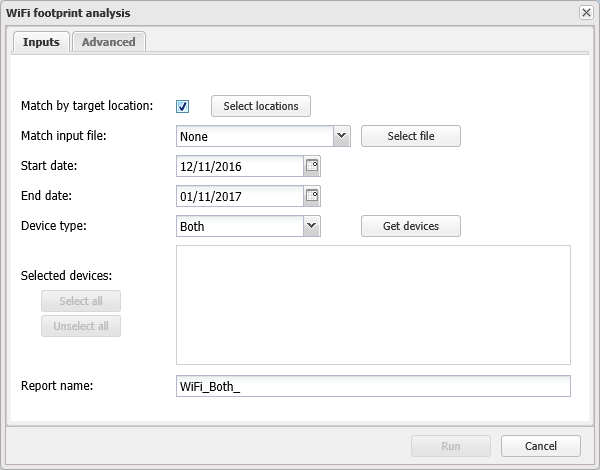
Select if you want the WiFi analysis to identify which WiFi network's have coverage at selected target locations. You can only select target locations that have a buffer specified or those which are of the polygon type. Once selected click Select locations to choose which target locations you want to include.
This is only available if Match by target location is selected. Click to open the Select locations dialog box which allows you to select which target locations you want included in the WiFi analysis. Only target locations that have a buffer specified or those which are of the polygon type are available to select. For the WiFi analysis to include the target location you must also select Match by target location.
When you select this, the WiFi analysis creates a Target location matches results folder which details the target location, the WiFi networks (SSID and MAC address) providing coverage to the target location, and each WiFi network's signal trail, and if available their signal area and signal contours.
If you have WiFi networks that you are specifically interested in then you can use this setting to select what identifier in your file you want to use to match with the drive data, either the MAC address, SSID or both.
As the SSID is defined by the owner of the router they can change it at any time. Therefore you may want to select to match with both the MAC address and SSID as this allows you to identify if the SSID has been changed.
Click to select the file containing the list of WiFi networks you are interested in. Windows Explorer opens. Navigate to the folder and select the required file then click Open. The file then automatically uploads. Once it is uploaded the file appears on the Manage files screen.
The file must be either a CSV or text with a "|" separator, and must have either a SSID identifier or MAC address identifier or both in separated columns.
This setting is mandatory. Select the start date you want used to filter the drive test devices that are available within the map area that is displayed on the ESPA analysis center screen.
This setting is mandatory. Select the end date you want used to filter the drive test devices that are available within the map area that is displayed on the ESPA analysis center screen.
This setting is mandatory. Select which type of device you want to run the analysis on; either 2.4 GHz, 5 GHz or Both. This setting is used to filter the drive test devices that are available within the map area that is displayed on the ESPA analysis center screen.
Click to display all the available drive test devices that match the criteria that you have selected on this tab in addition to them being within the map area that is displayed on the ESPA analysis center screen.
Displays all the available drive test devices that match the criteria that you have selected on this tab in addition to them being within the map area that is displayed on the ESPA analysis center screen. Use Select all, Unselect all and the check boxes to select which drive test devices you want used in the analysis.
NOTE: For a device to be displayed it must first be approved on the GAR drive management screen. If there are unexpected devices displayed they may be from invalid or test drives. If required, you can remove these drives using the GAR drive management screen.
This setting is mandatory. Enter a name for your analysis report. By default the report name is prefixed with WiFi and the device type you selected but you can change this if required. When this analysis is run this report name is then displayed on theCase management view's Case analyses tab.
Click to close the dialog box without applying any changes you may have made.
Click to run the selected analysis. Depending on the analysis being run it may take between 10 to 30 minutes. The status and results are displayed on the Case management view's Case analyses tab using the Report name you entered.
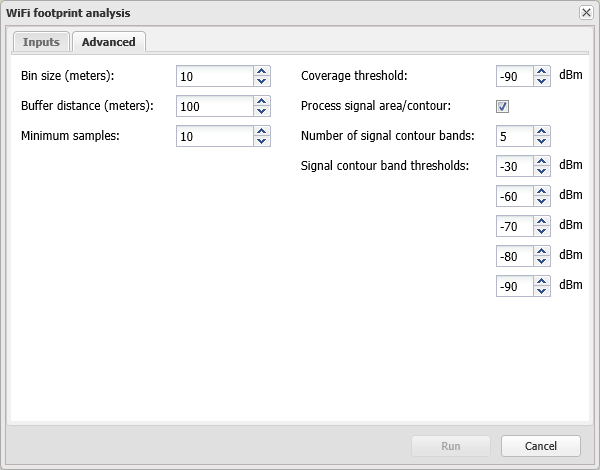
Enter the bin size of the output grids. This determines the output resolution of the WiFi footprint analysis. The higher the resolution the smoother the output coverage maps appear but the analysis will take longer to complete and the results will occupy more disk space. For example, if you only require a quick basic analysis you may want to use a bin size of 5 meters rather than the 10 meters default and in dense urban areas with a smaller WiFi cell coverage it is recommended you use a higher resolution, for example 5 meters.
Default: 10 meters
Enter the distance to be used outside the data points in the drive data file to create the grid boundaries used in the WiFi footprint analysis. The WiFi footprint analysis uses interpolation of drive test data to determine the coverage area of each cell. Buffer distance allows coverage areas to be extended outside of the drive test area up to the specified buffer distance using extrapolation.
Default: 100 meters
Enter the minimum number of drive test data points necessary to allow grid interpolation per WiFi cell. To allow accurate interpolation there must be sufficient data points. If the number of data points for a particular WiFi cell are limited it can impact the overall WiFi footprint analysis output, including the outputs of other WiFi cells. This setting allows you to ignore WiFi cells that do not contain the specified number of data points therefore preventing them impacting the overall WiFi footprint analysis output.
Default: 10
Select the minimum power level you want the analysis to display results for. This setting effects the Signal area result.
Select if you want your analysis to include the WiFi coverage areas and signal contours. If these results are not required, and you only require the list of identified networks and their estimated location based on the collected data, it is recommended that you clear this setting as your analysis will then complete in approximately 20% of the time which is significantly faster.
Select the number of signal contour bands you want the analysis to use then use Signal contour band thresholds to set the lower limit of each band. You can select a maximum of five. This setting effects both the Signal contours and Signal trail results.
Select the lower limit of each signal counter band. The number of bands you can select values for is defined by the setting of Number of signal contour bands. This setting effects both the Signal contours and Signal trail results.
Click to close the dialog box without applying any changes you may have made.
Click to run the selected analysis. Depending on the analysis being run it may take between 10 to 30 minutes. The status and results are displayed on theCase management view's Case analyses tab using the Report name you entered.