Precision location analysis dialog box
This topic describes the purpose of the Precision location analysis dialog box, how to access it and all the settings and buttons on it. However if you require a step-by-step procedure an using this analysis refer to Preparing and viewing a precision location analysis.
This feature requires option E7 Advanced CDRs. If you do not have this option this feature is not available.
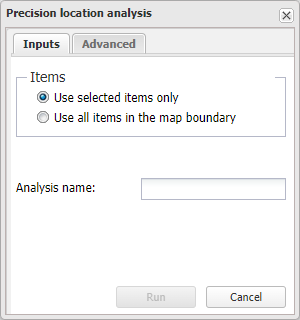
The Precision location analysis dialog box allows you to run a precision location analysis for either all geo-location and TA arc data displayed within the map boundaries or for just the data that you select. This data can either be selected on the Geo-loc data and TA data tabs, or on the map. This analysis helps you prioritize searches and identify likely locations if a device based on the available TA arcs and geo-location data.
If you require information on running an analysis refer to Preparing and viewing a precision location analysis.
-
Use selected items only: select if you only want to include the items that you currently have the check-box selected for on the Geo-loc data and TA data tabs. You may have used either these tabs or the map to select them.
-
Use all items in the map boundary: select if you want to include all the items displayed within the map boundary.
This setting is mandatory. Enter a name for your analysis report. When this analysis is run this report name is then displayed on the Case management view's Case analyses tab.
The precision location analysis breaks down the area into 100 meter bins. It calculates the total number of TA arc and GPS ping intersections, and the number in each bin. You can choose two types of calculations for displaying your analysis:
-
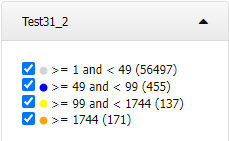
Use equidistant calculation: with this calculation, the number of intersects in each color level are specified by OSS-ESPA and you cannot edit them. After the analysis is complete, you can view it on the map, where it displays the bins with the highest intersections in red, and the lowest in gray. The Legend/FIlter view displays the ranges and the number of bins in each range.
-
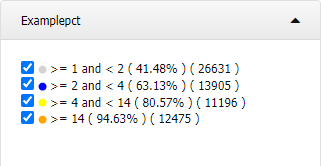
Use percentile calculation: this calculation uses the Excel percentile function. A percentile is a value below which a given percentage of values in a data set fall. You can set four percentile calculations, however the default values are 40%, 60%,80% and 95%. After the analysis is complete, you can view it on the map, where it displays the bins with the highest percentile in orange, and the lowest in gray. The Legend/Filter view displays the exact percentage and the total number of intersections in the range.
This percentile method of displaying the analysis can be more useful if the area you are running your analysis over does not have a wide range of intersections in the bins. This is because it allows you to spread the color levels over the range of intersections in your specific area, whereas with the equidistant calculation they may all occur in the same level and therefore be displayed with the same color.
-
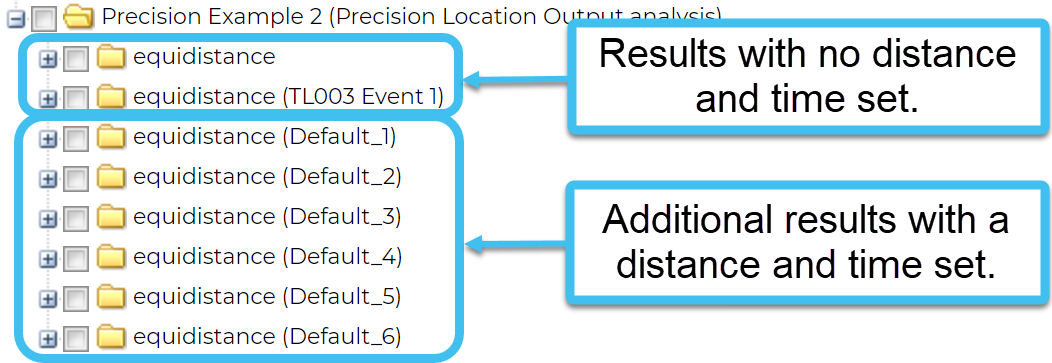
Distance and Time: you can optionally select to enter a distance and time from the target location events. Each time the analysis is run, if new data is available within either the distance or time values you set, then a new analysis result folder is created. The allowable distance range is 5 to 20 miles, and the time range is 30 to 120 minutes.
After the analysis is complete you can use the Precision location tab to view the precision level color codes and select which ones you want to view. This allows you to view and prioritize the areas with the highest number of intersects. You can also use the Legend/Filter view to view the color codes.
Click to run the precision location analysis. Typically the analysis takes only a few minutes. The status and results are displayed on the Case management view's Case analyses tab using the Analysis name you entered.
Click to close the dialog box without applying any changes you may have made.