Map Settings dialog box
This topic provides an overview of the Map Settings dialog box and all the settings and buttons on it.
This feature requires option E14 Sentinel. If you do not have this option this feature is not available.
The Map Settings dialog box allows you to set how items are displayed on the map. For example, you can set whether or not sectors are displayed as solid wedges or with open arms, and whether call-outs are solid or transparent. For further information on all the available settings refer to Settings and buttons.
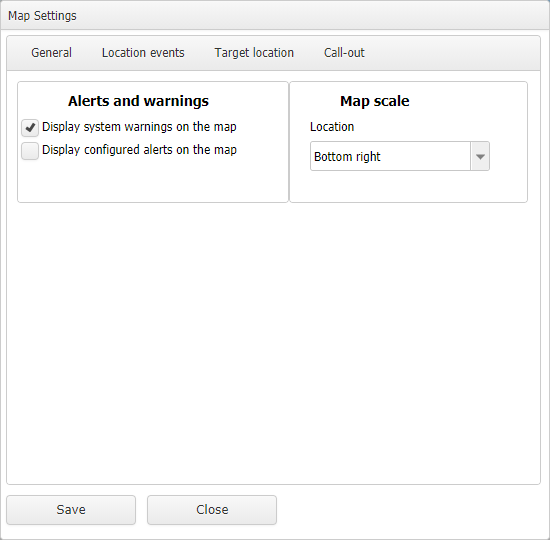
Select these settings if you want to display details on the map of any system warnings or smart track triggered alerts.
- Display system warnings on the map: select if you want to display the warning messages on the map. Normally you will want these to display, however you may want to disable them when you are taking screen captures of the map.
-
Display configured alerts on the map: if selected and if your case has smart track alerts configured on the Smart Track alerts & notifications screen then when one is triggered it is displayed on the map as a comma separated list.
Select the location where you prefer your map scale to be positioned.
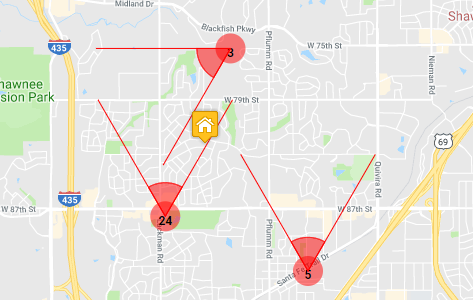
Select if you want to display the sectors as open sectors where they are only 20% partially filled. You may want to do this so that you are not showing an exact theoretical cell boundary in your report. Showing an exact theoretical cell boundary could cause people to incorrectly believe that the cell coverage ends exactly where the displayed theoretical pie cell boundary ends.
Select a zoom level between 0 and 10. This zoom level is only applied when you select to zoom to an item on the various Sentinel screen's views.
Use the slider to change the transparency of the sectors, geo-location buffers, cell coverage maps, and other call data such as TA arcs that are displayed on the map. Reducing the transparency level is useful if you have multiple items overlapping each other as it makes it easier to read the underlying map layers and street names.
Select the size that you want the sector radiuses displayed on the map. The available range is 0.1 to 30 miles. This sets the radius for all the sectors.
Select if you want to specify the default sector beam width in Sector beam width (degrees).
This setting is only available if Set default beam width on load is selected. Select the size that you want the sector beam widths displayed on the map. The available range is 1 to 360 degrees. This sets the beam width for all the sectors
Select if you want the call-outs of all the current events to be displayed automatically. Current activities are defined as:
- a call or data session in progress. Note, that the map displays all the sectors that have been used during the call, not just the call's latest sector. The sector that is currently being used is displayed like this
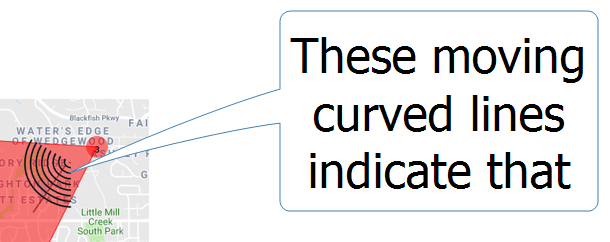 , whereas the previous sectors show no moving curved lines.
 - an SMS that occurred in the previous 60 seconds.
- GPS pings that occurred in the previous 60 seconds.
Select if you do not want the surrounding towers displayed by default. This helps improve the performance when you initially load a case. Surrounding towers can also be manually displayed in the case after it has loaded.
Select if you want the current activities to be displayed with animation.
The person's current activities are marked with moving curved lines . If the current activity locations is a sector with no azimuth defined then these curved lines are displayed over 360 degrees. Current activities are defined as:
Current activities are defined as:
- a call or data session in progress. Note, that the map displays all the sectors that have been used during the call, not just the call's latest sector. The sector that is currently being used is displayed like this , whereas the previous sectors show no moving curved lines.
- an SMS that occurred in the previous 60 seconds.
- GPS pings that occurred in the previous 60 seconds.
Select if you want the last known activity to be displayed with animation.
The person's last known call location is marked with a moving straight line  . If the most recent location is a sector with no azimuth defined then this straight line is displayed moving over 360 degrees.
Select if you want GPS pings from the carriers that do not have any location information displayed on the Location events view.
Select if you want to improve the performance of the Sentinel screen. This stops older data from currently active calls being loaded if the data occurred before the date and time you selected on the Input and settings view.
Select if you want to display the target location information in a format which allows you to move the pop-up around the map. This gives you the flexibility to position it on an area of the map that you want to view which would otherwise be hidden by the default target location pop-up. All the target location information is displayed including the detailed description, however the pop-up is scalable so you can also size it to not display the detailed description if required.
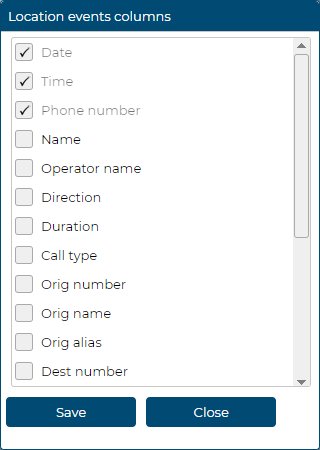
Click Edit to edit which information you want displayed in the event pop-ups. The Location events columns dialog box opens which allows you to select which call information you want displayed in the event pop-ups. The date, time and phone number are mandatory but you can select to display other details such as those shown in the following dialog box.
Click Font to edit how the call information is displayed in the event pop-ups. The Location events font dialog box opens.
Select if you want to display the details in the location events pop-up by cell then date/time. If this is not selected the details are displayed by date/time.
Select if you want to display the time in the location events pop-up using a different format to that which you set as your default in the Time settings on the Sentinel user preference screen.
Select if you want to display all the map pop-ups, such as the target location and sector location pop-ups, with a transparent background. This gives you the flexibility to view the area of the map immediately under the pop-up that would otherwise be hidden.