Understanding each IQ packet
This topic describes the various sections within an IQ packet, including the purpose of each section and where you entered the information for it to appear in the IQ packet.
NOTE: This feature requires option E15 IQ Packets Reports. If you do not have this option this feature is not available.
Understanding each IQ packet
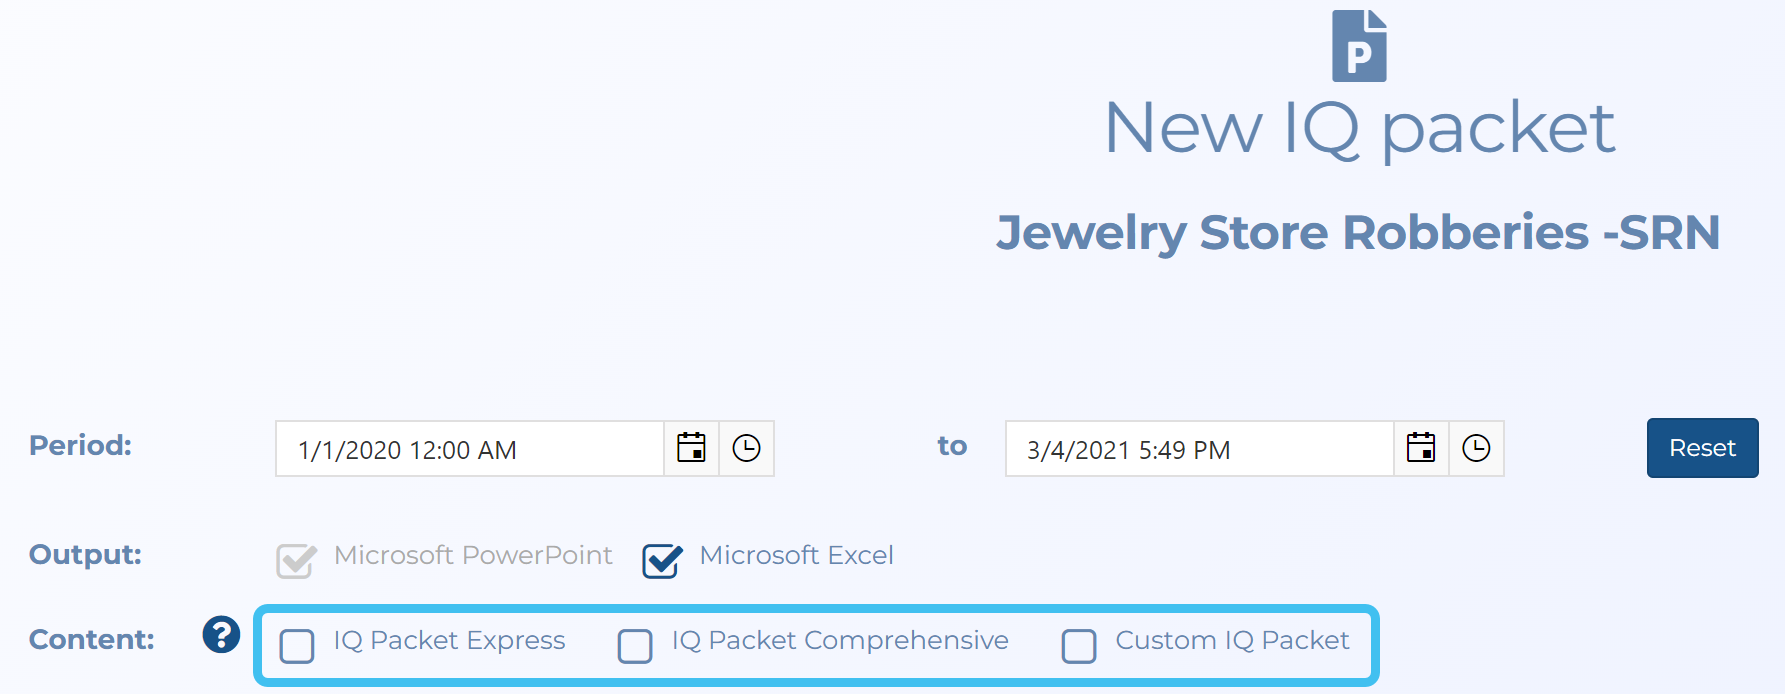
When you create an IQ packet report you can choose three options: IQ packet express, IQ packet comprehensive and Custom IQ packet. For further information on each of these refer to Content.
If you require information on how to create and download IQ packets refer to To create an IQ packet for an existing case.
Click here for a description of all of the sections that can be added to an IQ packet report.
You can also click here for a short video showing an example of the IQ packet contents.
The content of an IQ packet is dependent on the configuration you selected when you run the IQ packet, however an IQ packet can contain the following sections:
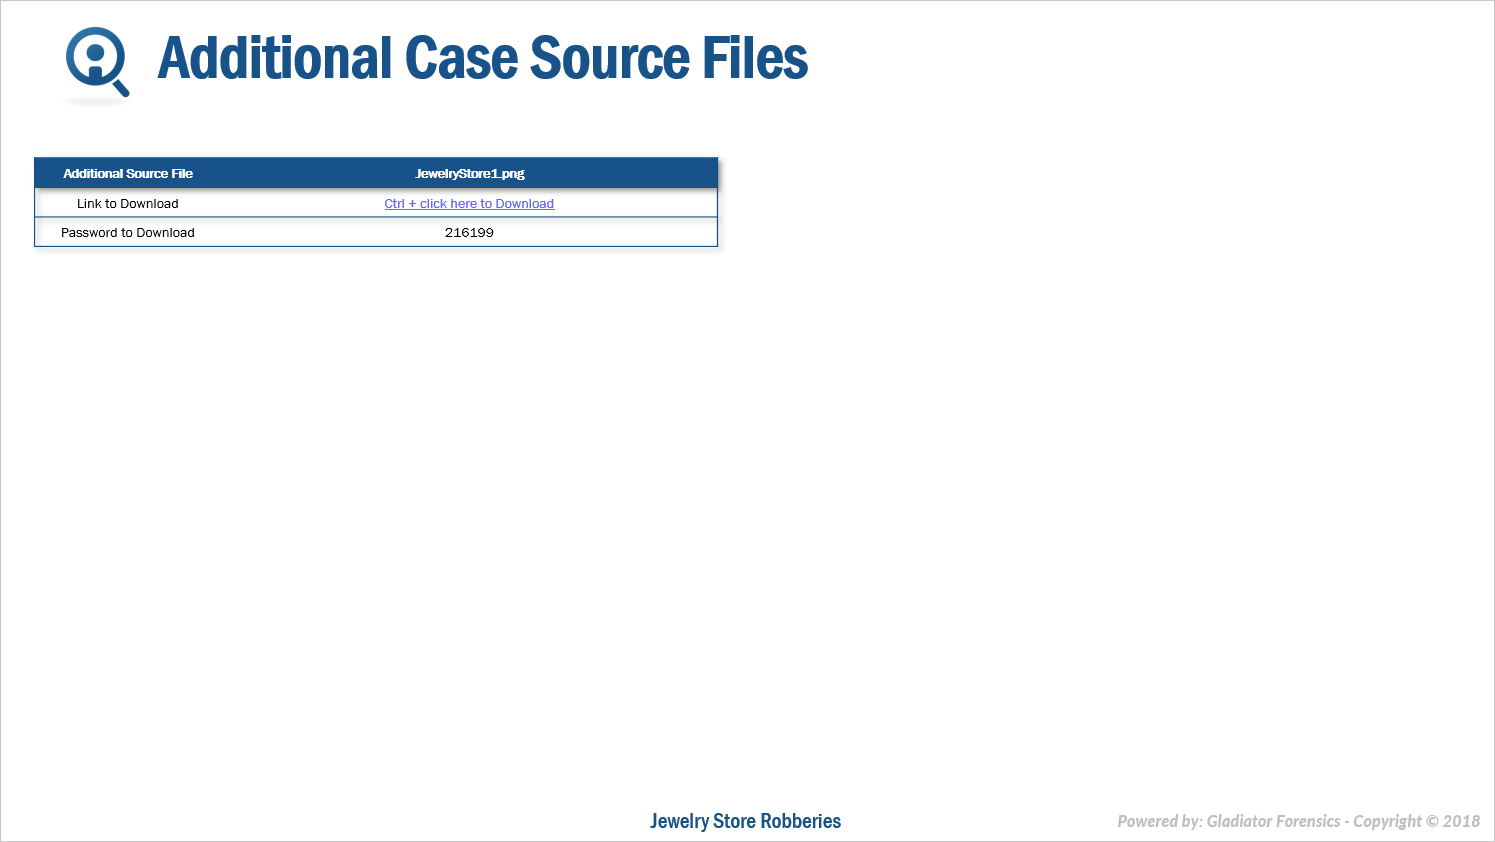
This section of the IQ packet displays a link and password which allows you to download the additional files that you uploaded to the case. The additional files that are available in this section of the IQ packet are:
- those for the persons and locations you selected to include in your IQ packet on the New IQ packet screen and
- all the other additional files that you uploaded to your case where the Type of file was set to "none" or "Cell tower".
This section
You can configure settings associated with this analysis using Call by Hour.
For each of the people you selected to include on the New IQ packet screen this section of the IQ packet displays a break down of the number of calls by the hour from 00 (00:00 - 00:59) through 23 (23:00 - 23:59).
In the IQ packet each result displays both a table and a graph detailing the number of voice and SMS calls by the hour.
The following graphic provides an example of this section in an IQ packet report which was output in the Microsoft PowerPoint format.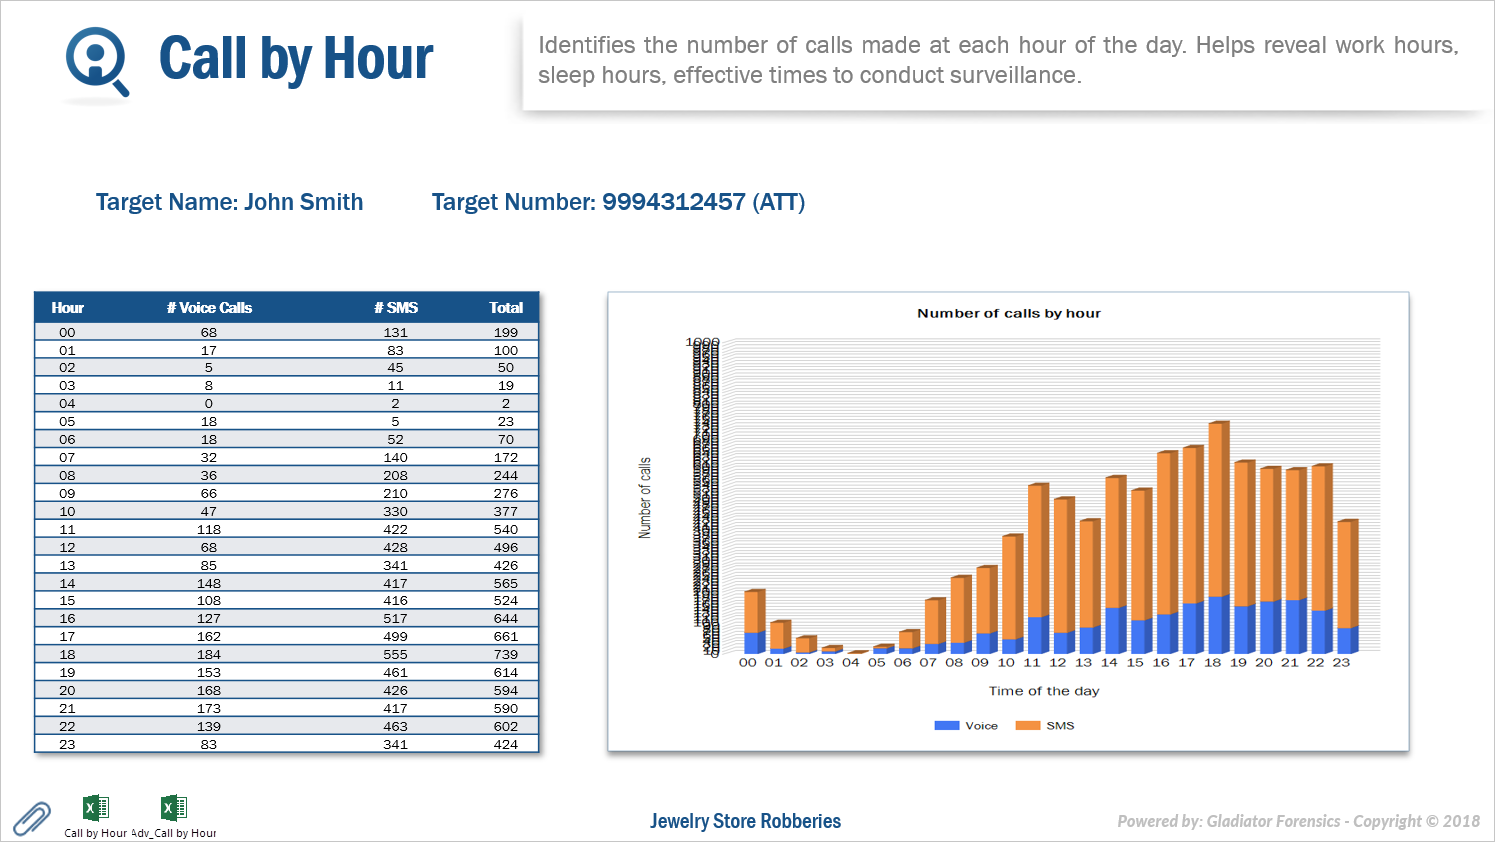
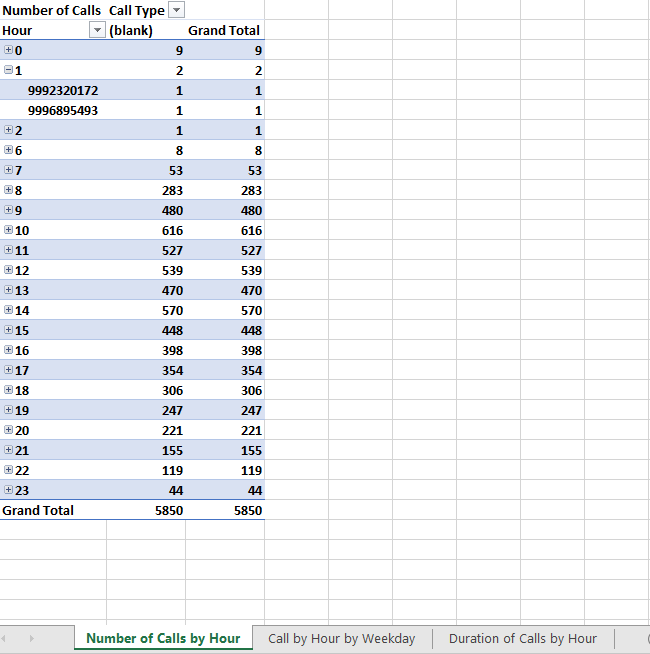
If you selected "Microsoft Excel" as an Output then this IQ packet section also provides two Microsoft Excel attachments that allow you to analyze this data further if required. The following graphic provides an example of the Microsoft Excel attachment.
The Call by hour attachment provides a list of all the calls by hour, by hour per weekday and the duration of the calls by hour.
The Adv_Call by Hour attachment provides a graphic representation of the calls by hour and allows you to configure filters to display the breakdown of the results to suit your needs.

For each of the persons you selected to include on the New IQ packet screen this section of the IQ packet displays each person and their associated phone numbers along with a link and password which allows you to download the associated files.
The following graphic provides an example of this section in an IQ packet report which was output in the Microsoft PowerPoint format.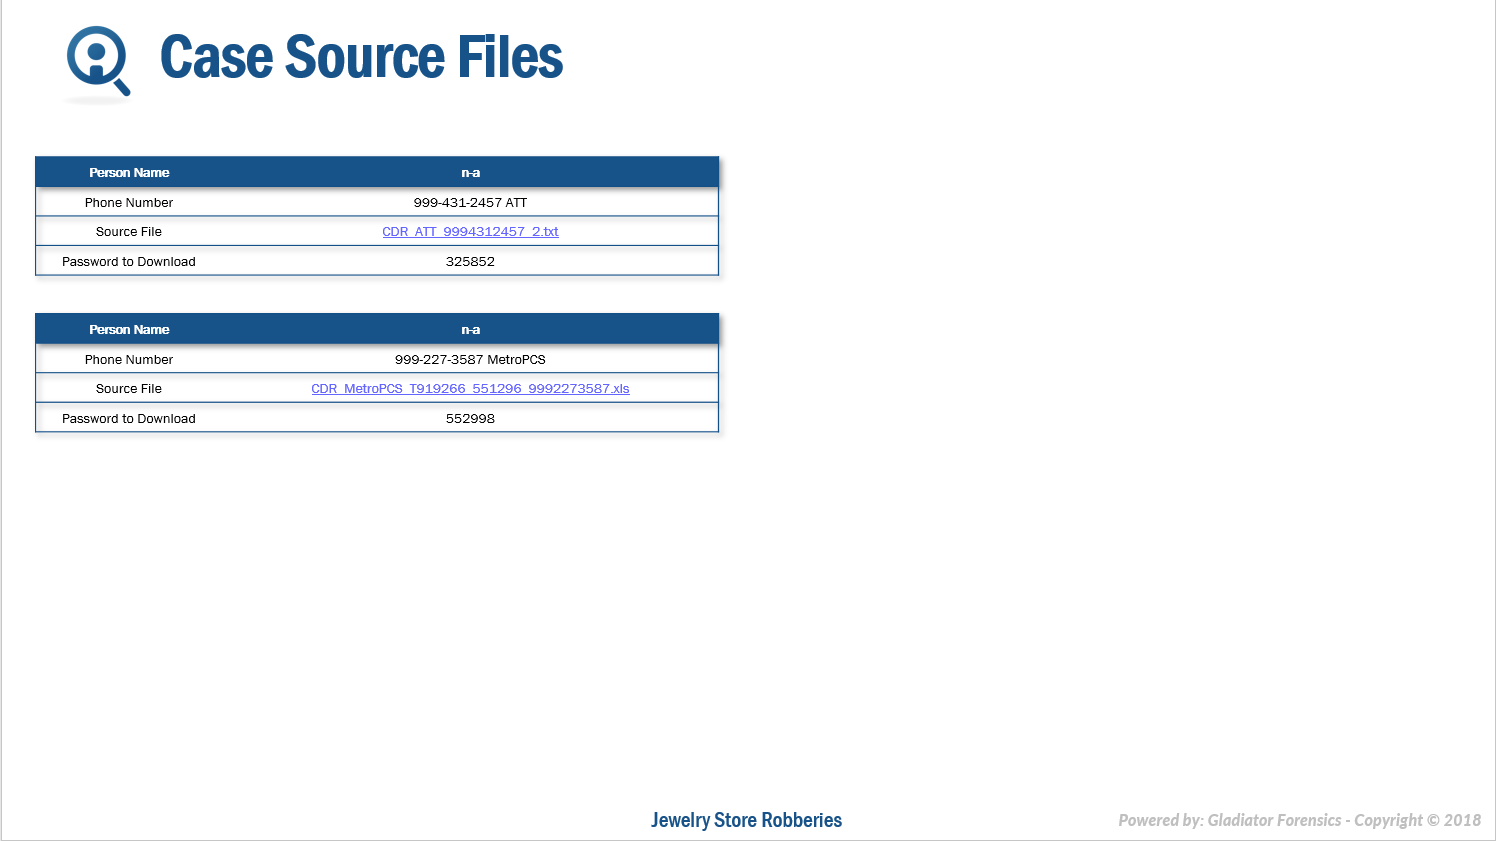
This section in the IQ packet displays a table containing the case File number and Case type along with the details you primarily entered on the Key facts tab of the Edit case information screen.
The following graphic provides an example of this section in an IQ packet report which was output in the Microsoft PowerPoint format.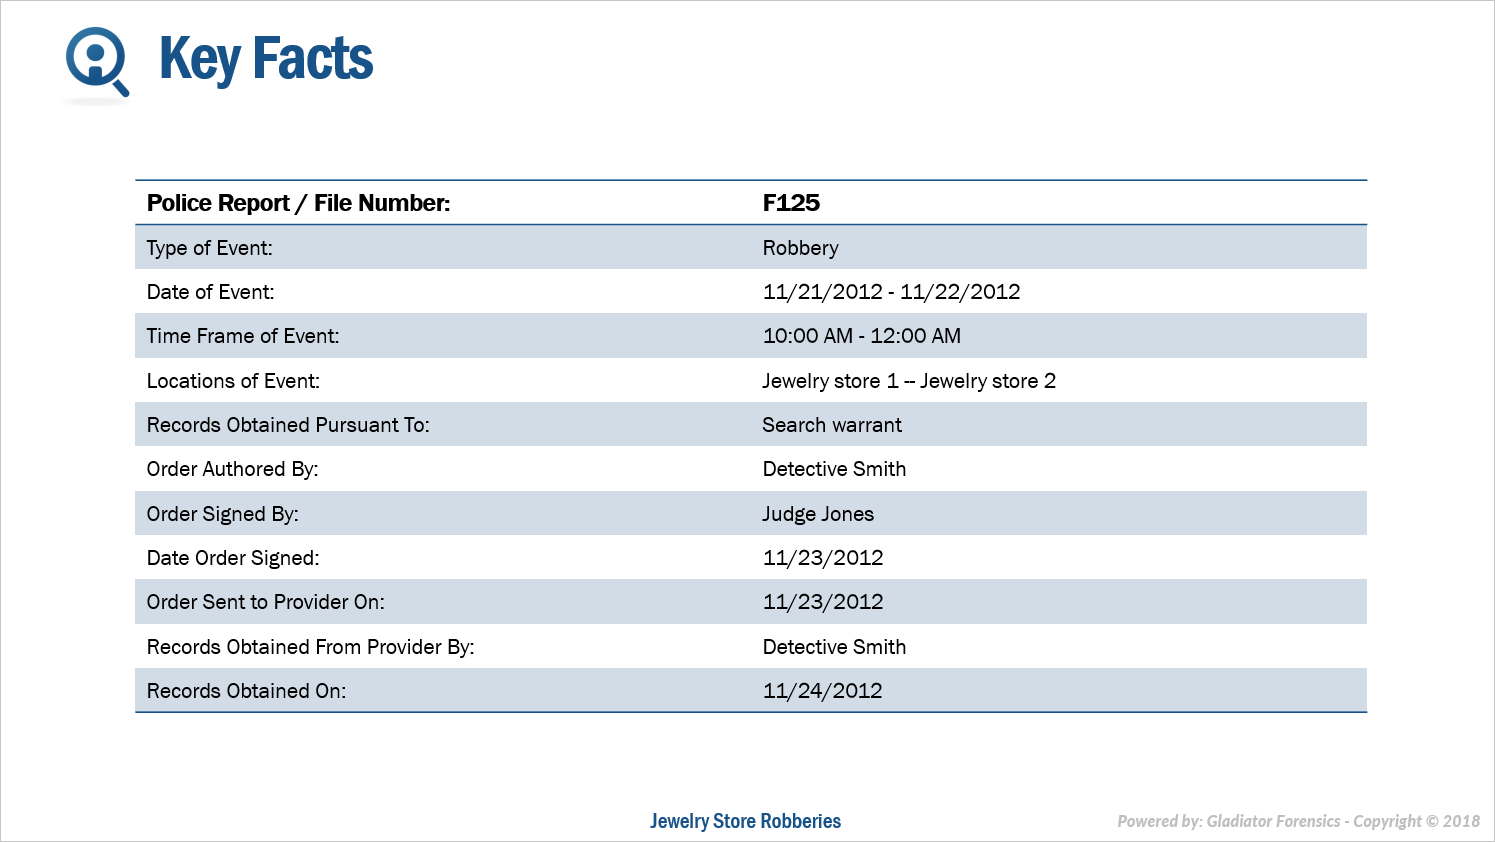
This section in the IQ packet displays the details you entered on the Summary tab of the Edit case information screen.
The following graphic provides an example of this section in an IQ packet report which was output in the Microsoft PowerPoint format.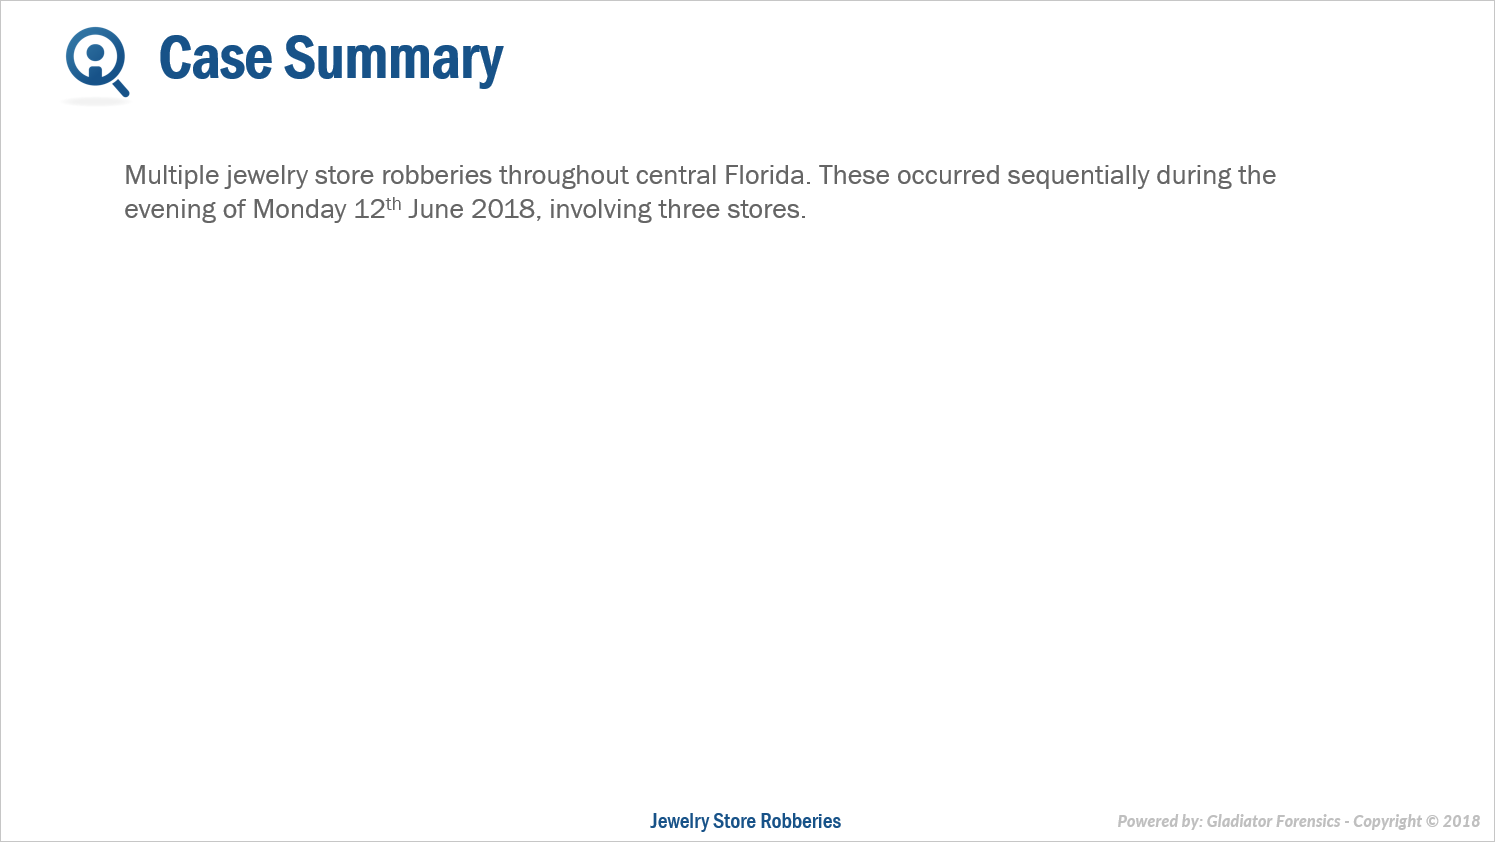
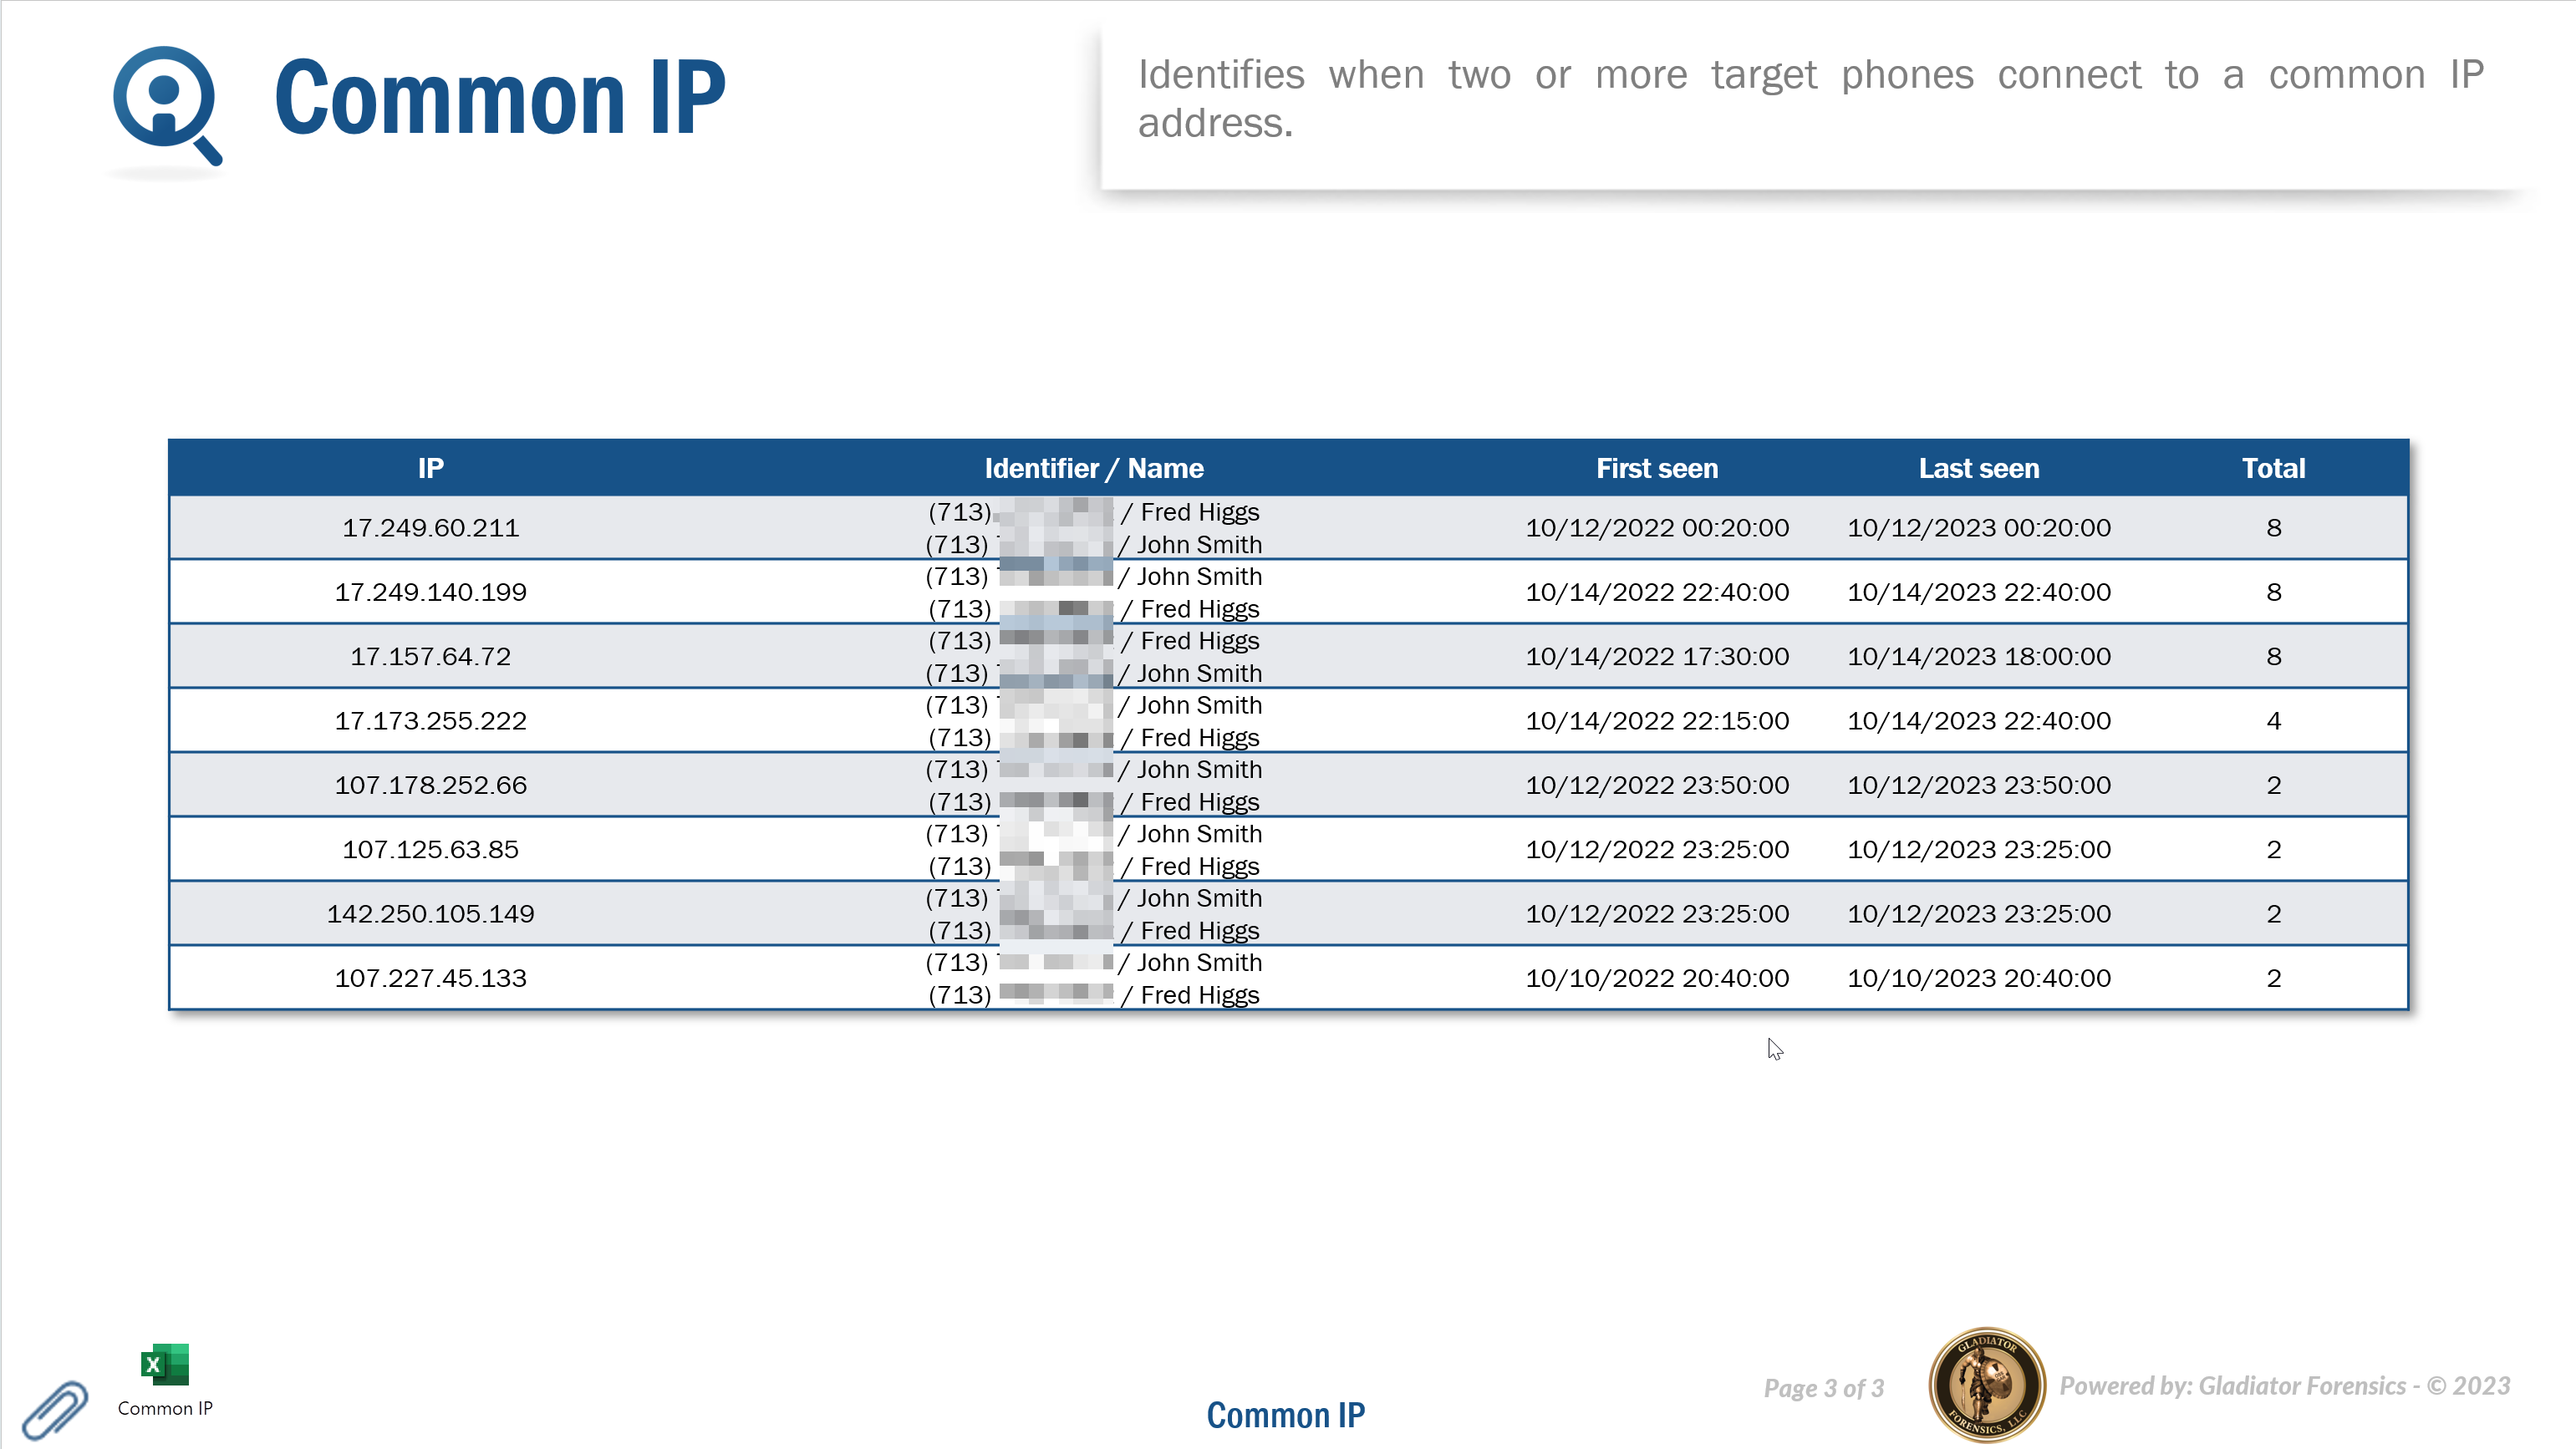
This section of the IQ packet identifies when two or more target devices connect to a common IP address. These IP addresses may be either the person's location or the location of the IP address they are accessing.Common IP addresses can indicate common contacts such as where they are ordering online drug supplies. This IQ packet is designed to be sent to the operator for the purposes of performing a secondary search so that you can resolve a phone number or location of the IP address.
With social media, if an IPv4 address comes in, you may want to resolve the IP address to an actual phone number or location. Operators such as Verizon often do not supply IPv6 for social media communication for example, Facebook and Instagram. They commonly provide an IP and port number. However they can provide a secondary search and provide you with a new phone number for a person if you provide them with the target's IPv4 address, port number and an exact time. The data that you download from the Frequent IP and Common IP analyses is what you can send them when you request a secondary search.
For each of the devices the IQ packet lists the top 10 common IP addresses, the device identifier and person name, the first and last time the IP addresses were used, and the total number of times they were used.
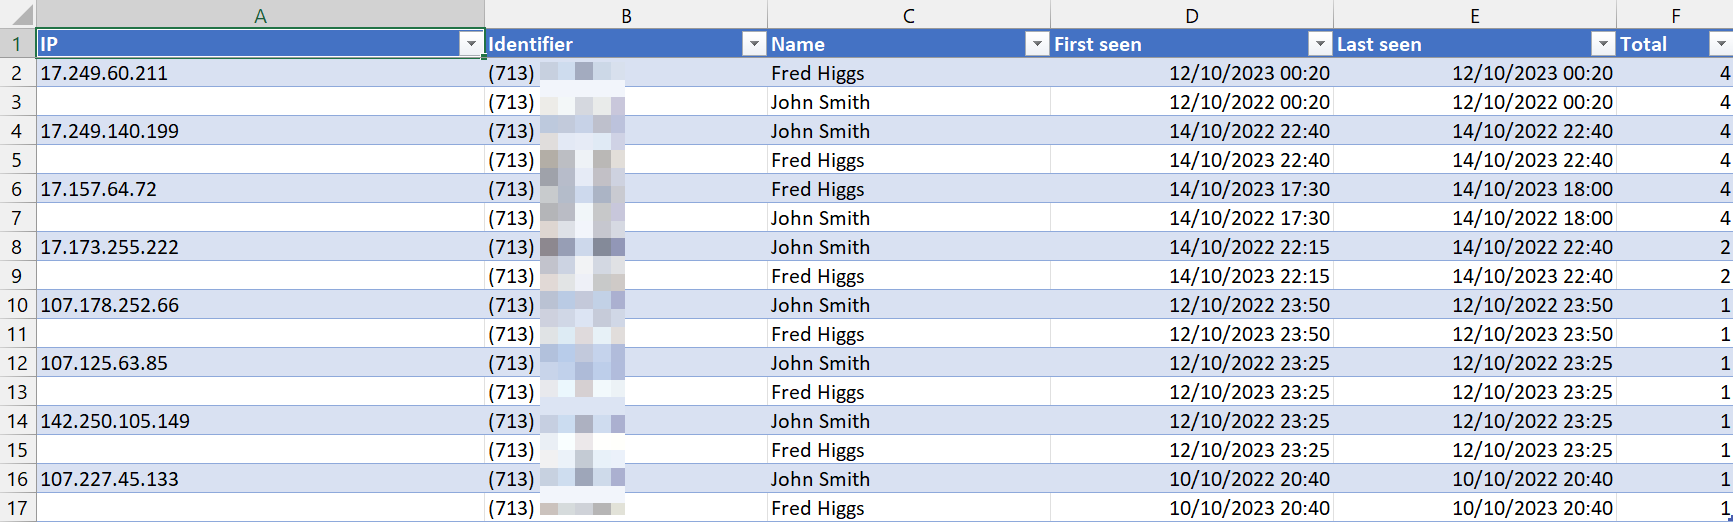
If you selected "Microsoft Excel" as an Output then this IQ packet section also provides a Microsoft Excel attachment which includes all the common IP addresses. The following graphic provides an example of the Microsoft Excel attachment.
This section of the IQ packet is designed to help you identify people who were physically close to each other during similar times. This can help you determine if two or more suspects were together in the same location at the same time, for example at a crime scene, or if a suspect and victim were together in the same location at the same time.
You can configure settings associated with this analysis using Common locations.
For each of the people you selected to include on the New IQ packet screen this section of the IQ packet displays the people who are using sectors within a specified distance of each other within a specified time interval, for example at a crime scene or a meeting area.
In the IQ packet there is a summary slide which contains the statistics of common locations of the people. Next, there is a slide per person which includes their common locations details. If you want to include all the common locations on maps, which can generate a large number of slides, then select Add common location maps.
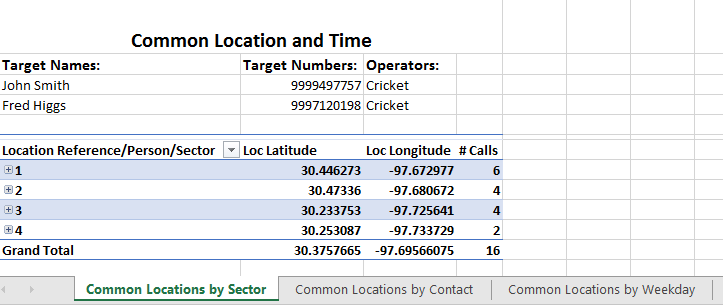
If you selected "Microsoft Excel" as an Output then this IQ packet section also provides two Microsoft Excel attachments that allow you to analyze this data further if required. The following graphic provides an example of the Microsoft Excel attachment.
-
The Common locations attachment provides a list of all the common locations including by sector, by contact and by weekday.
-
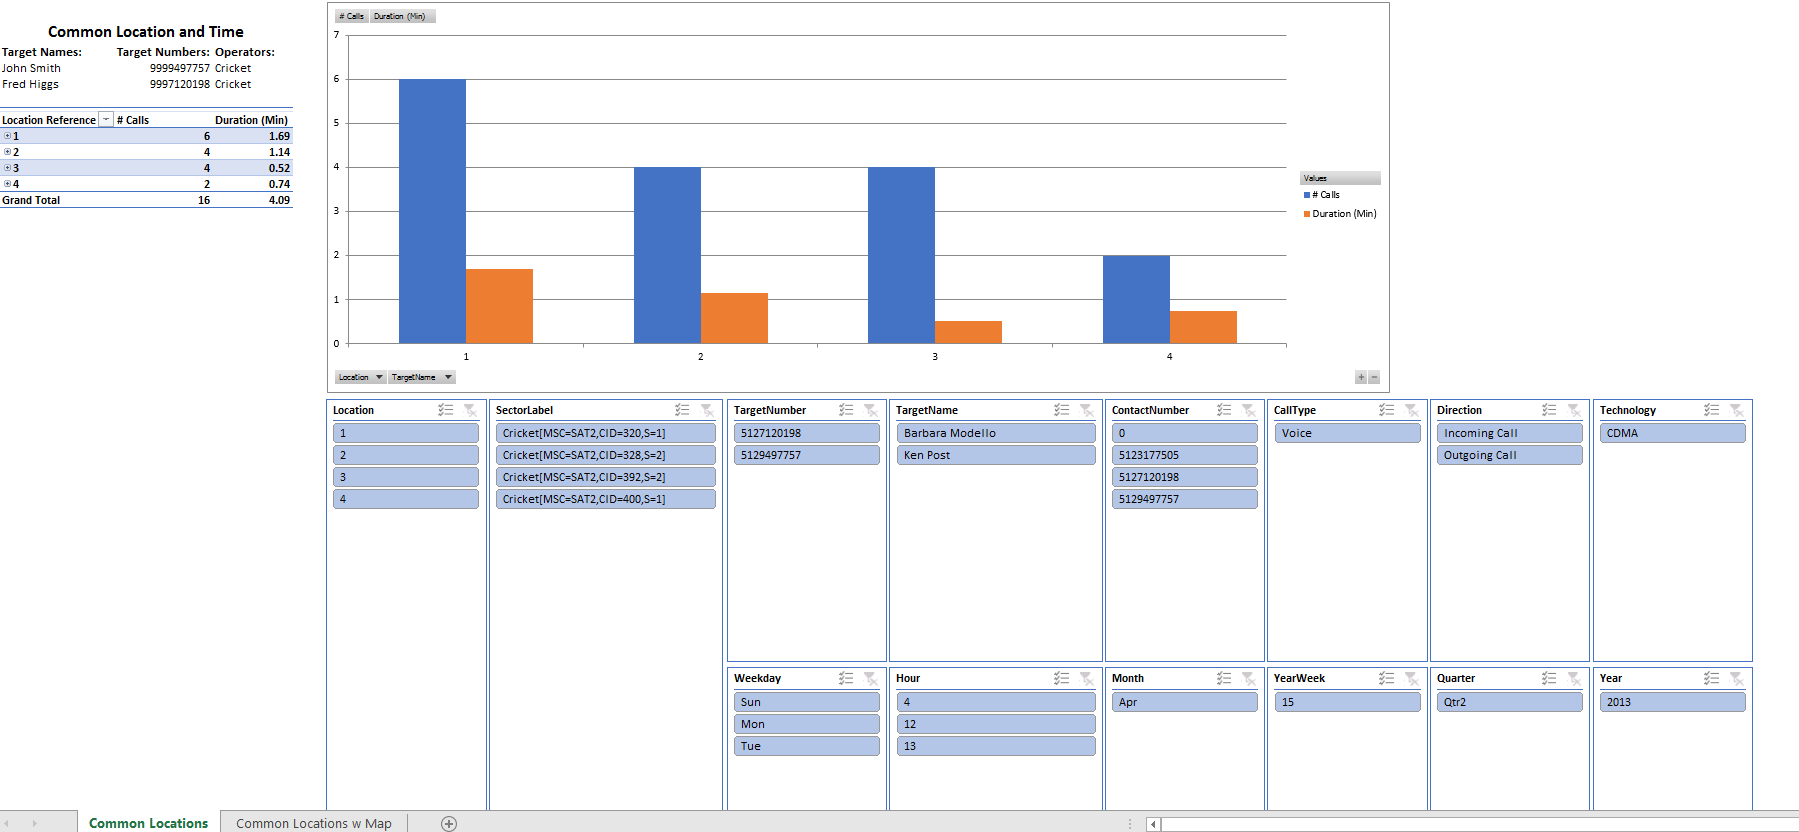
The Adv_Common locations attachment provides a graphic representation of the common locations and allows you to configure filters to display the breakdown of the results to suit your needs.
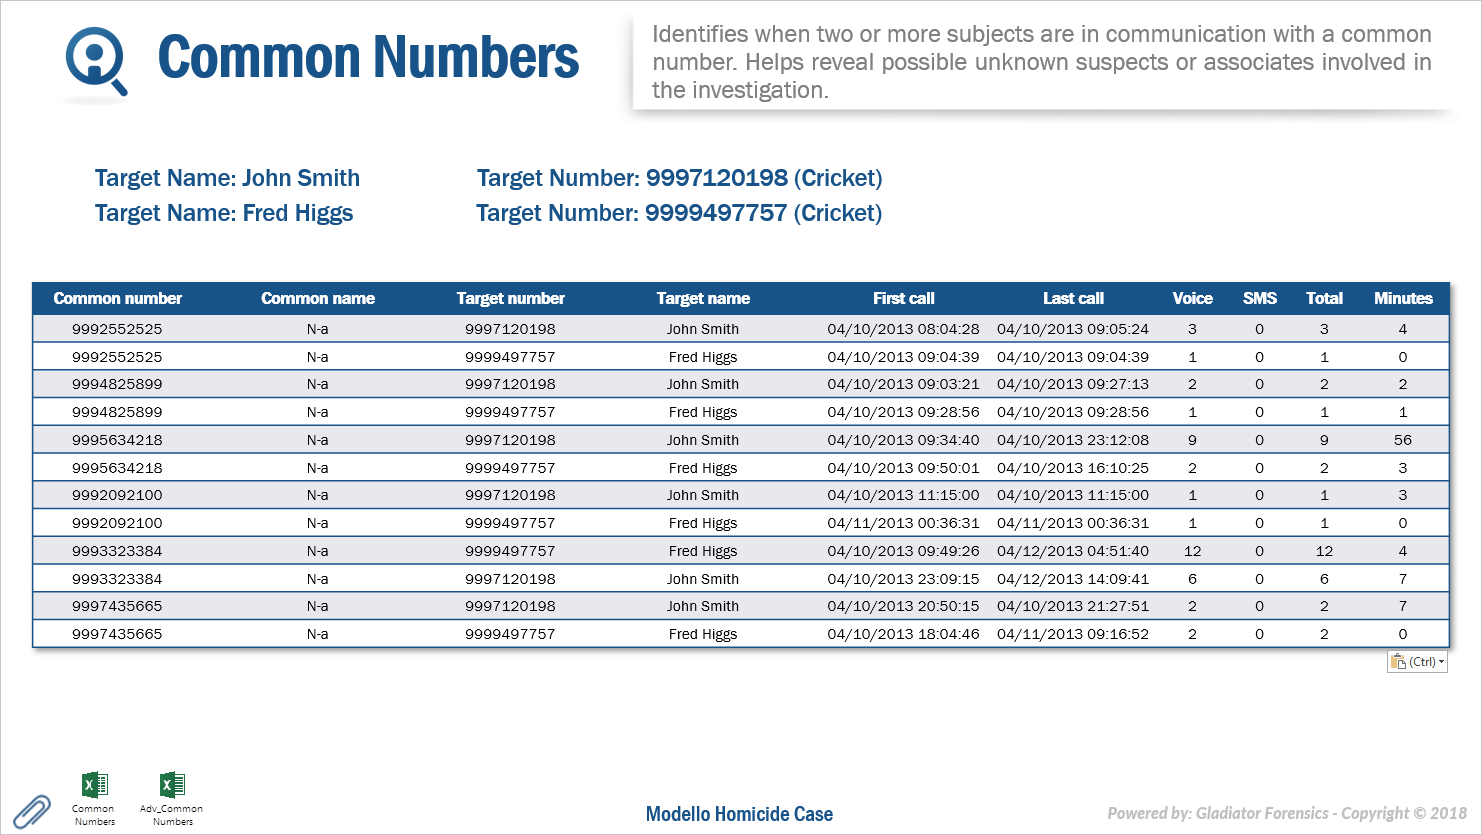
This section of the IQ packet is designed to help you investigate contacts that two or more people have in common. You can then use this information to search for phone numbers in a public record database to determine the phone users names and addresses. This then provides you with additional interview leads, suspects or victims. In addition, the First call along with Last call also allows you to investigate the calling pattern between the two phone numbers. The following are examples of how this data may help your investigation:
- This data can be used in a similar way to the first and last calls in Frequent numbers, however additionally you can analyze multiple suspects together, or the suspect's and victim's calling pattern with a common number.
- If a person is calling both the suspect and the victim after the crime to find out the location of the victim it may suggest they are unaware of the crime. You may therefore decide to exclude the person as a suspect.
-
If a person is calling the suspect, but has stopped calling the victim it may indicate that they knew of the murder and they therefore may be an accomplice. You may therefore decide to include the person as a suspect.
You can configure settings associated with this analysis using Common Numbers.
This section of an IQ packet requires you to have selected a minimum of two phone numbers on the New IQ packet screen. For the phone numbers you selected, this displays all the common phone numbers which all the phone numbers have communicated with. The following information is displayed:
- Common number: this displays the contact phone number the target phones have in common.
- Common name: this displays the names that have come from case files such as phone data and public record data.
- First call: this displays the first time a call or SMS was made or received between the two phone numbers. This, along with Last call allows you to investigate the calling pattern between the two phone numbers.
- Last call: this displays the last time a call or SMS was made or received between the two phone numbers. This, along with First call allows you to investigate the calling pattern between the two phone numbers.
- Voice: this displays the total call count between the two phone numbers. Either phone number may have originated the call.
- SMS: this displays the total SMS count between the two phone numbers. Either phone number may have sent the SMS.
- Total: this displays the combined voice call and SMS call counts between the two phone numbers.
- Minutes: this displays the total number of minutes for all voice calls between the two phone numbers.
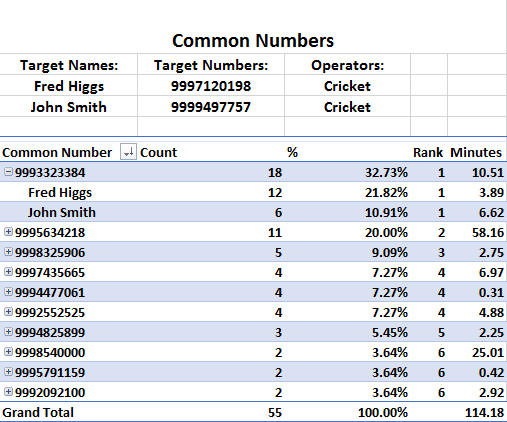
If you selected "Microsoft Excel" as an Output then this IQ packet section also provides two Microsoft Excel attachments that allow you to analyze this data further if required. The following graphic provides an example of the Microsoft Excel attachment.
The Common Numbers attachment provides a list of all the common phone numbers and the amount of time that they were in contact with the common numbers.
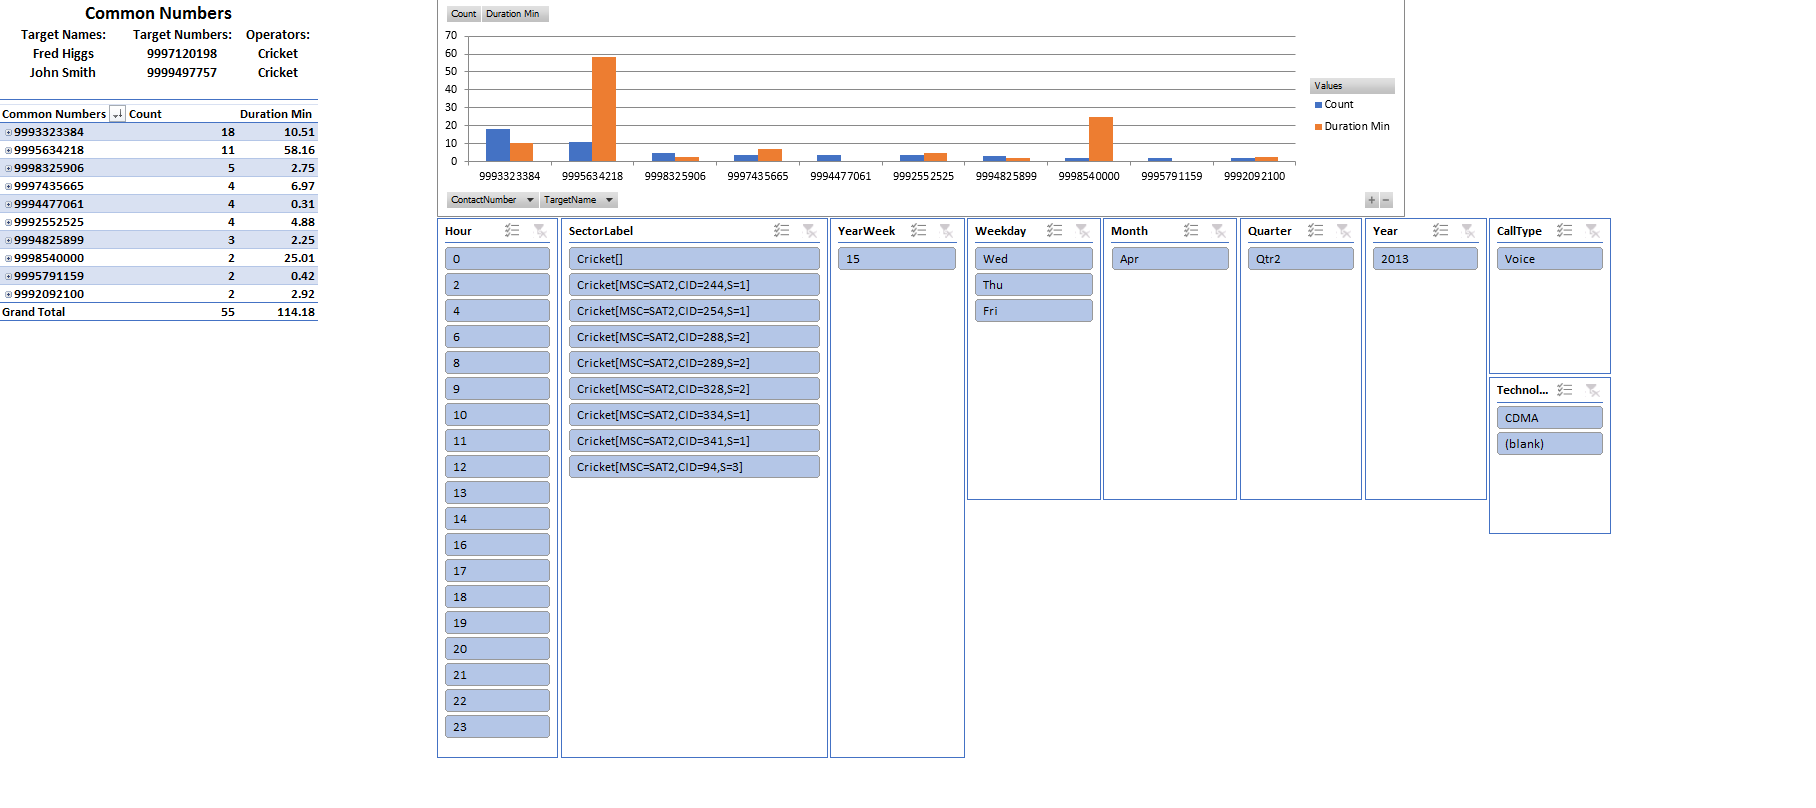
The Adv_Common Numbers attachment provides a graphic representation of the common numbers and allows you to configure filters to display the breakdown of the results to suit your needs.
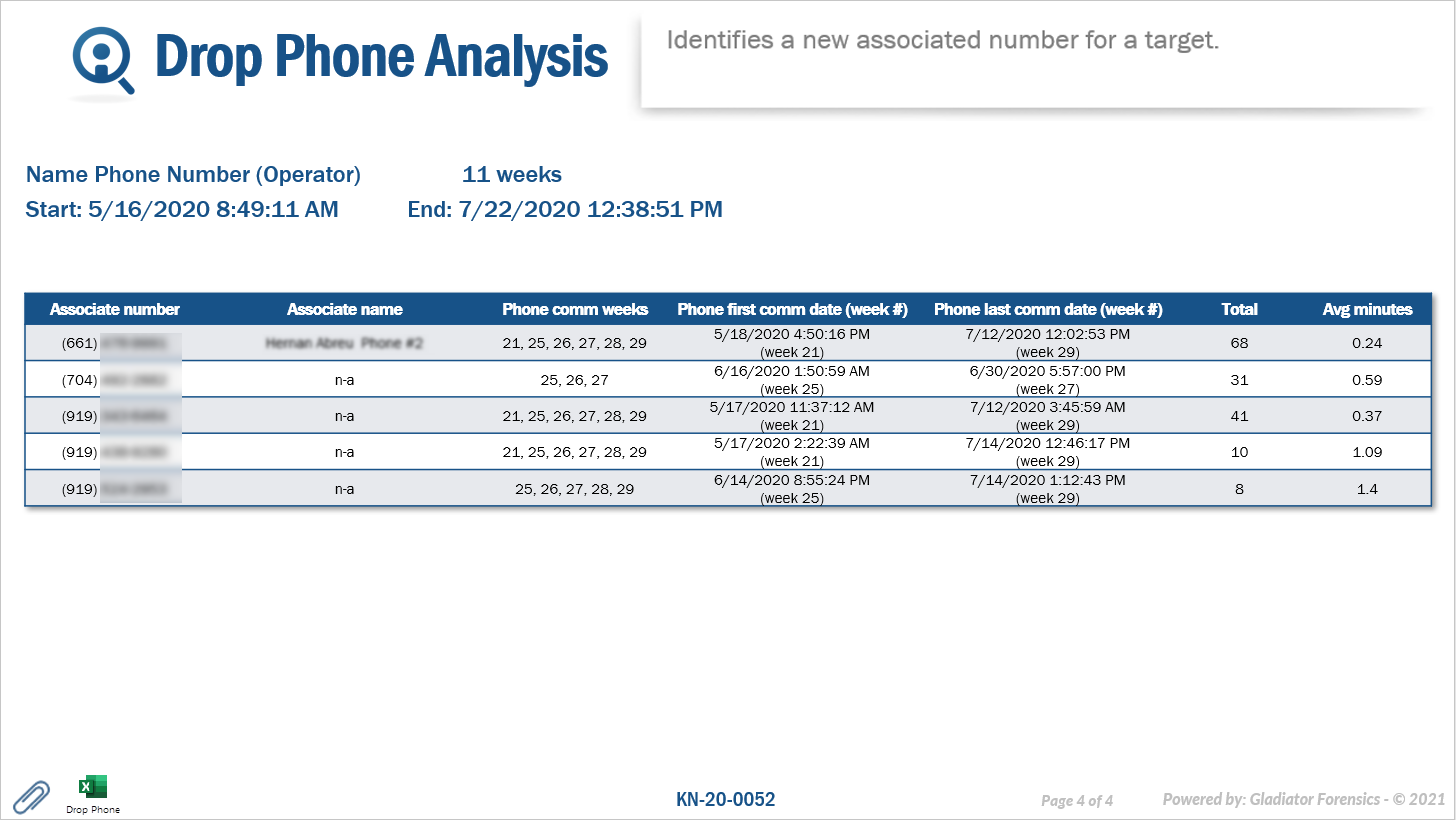
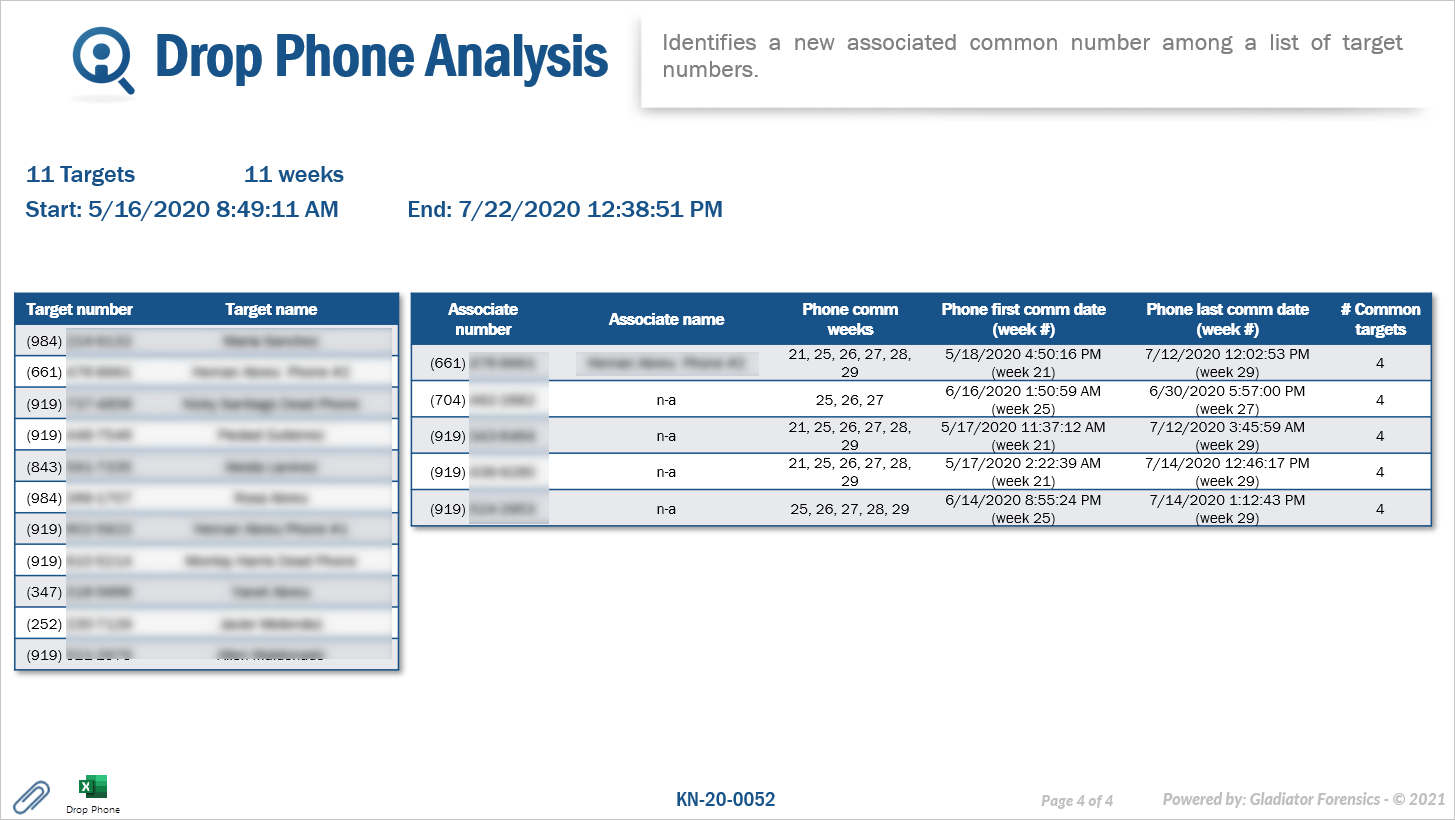
This section of the IQ packet is designed to highlight new associates during the selected time period. As they are new associates during this period they may be of significant interest to you. If the IQ packet report is being run for:
-
one target person, then the packet includes: all the new associate phone numbers for that target, listing the date/time and week number of the first and last communication, the number of communications and the average number of minutes for a communication. If the name of new associate number is already known to OSS-ESPA then it is also displayed.
-
multiple target people, then the packet includes: all the new associate phone numbers that are common to at least two targets, listing the date/time and week number of the first and last communication, the number of common targets. If the name of new associate number is already known to OSS-ESPA then it is also displayed.
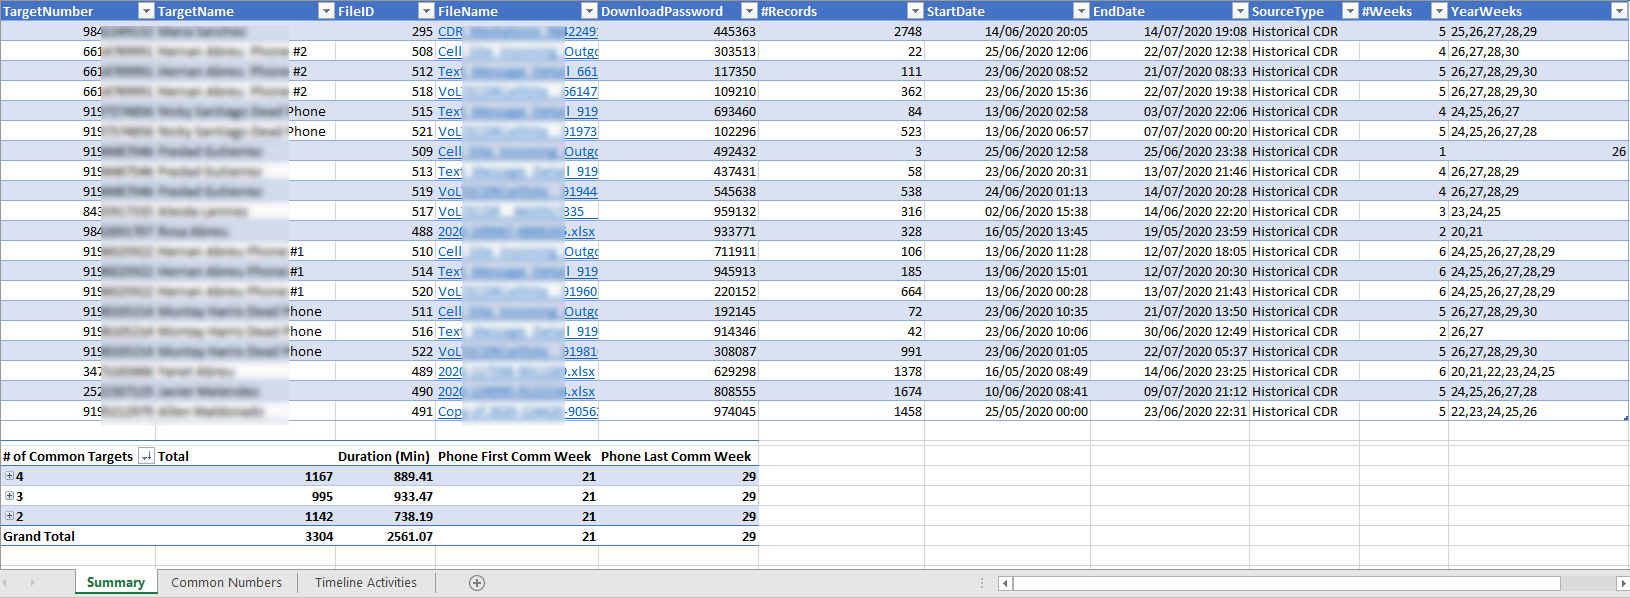
If you selected "Microsoft Excel" as an Output then this IQ packet section also provides a Microsoft Excel attachment that allows you to analyze this data further if required. The following graphic provides an example of the Microsoft Excel attachments.
This section of the IQ packet is designed to help you identify where the person is potentially sleeping or hiding, or it can help you determine multiple properties the person owns, or regularly frequents. For this analysis to be of use there must be a significant amount of calls and the calling period must be greater than 24 hours, however the recommended minimum period is one week. If OSS-ESPA determines the number of calls is not significant to give valid results then no information is displayed for the person.
You can configure settings associated with this analysis using First/Last Sectors.
For each of the people you selected to include in your report on the New IQ packet screen this section of the IQ packet displays the ten most frequent first-last sectors.
In the IQ packet a map displays the sector location alongside the sector details and its usage. A link is provided within the map allowing you to view the sector in greater detail on a browser along with the calls made by the person using the sector. The Time interval displays the range of dates a call or SMS was made or received using the sector. These allow you to investigate the calling pattern using that specific sector.
The following graphic provides an example of this section in an IQ packet report which was output in the Microsoft PowerPoint format.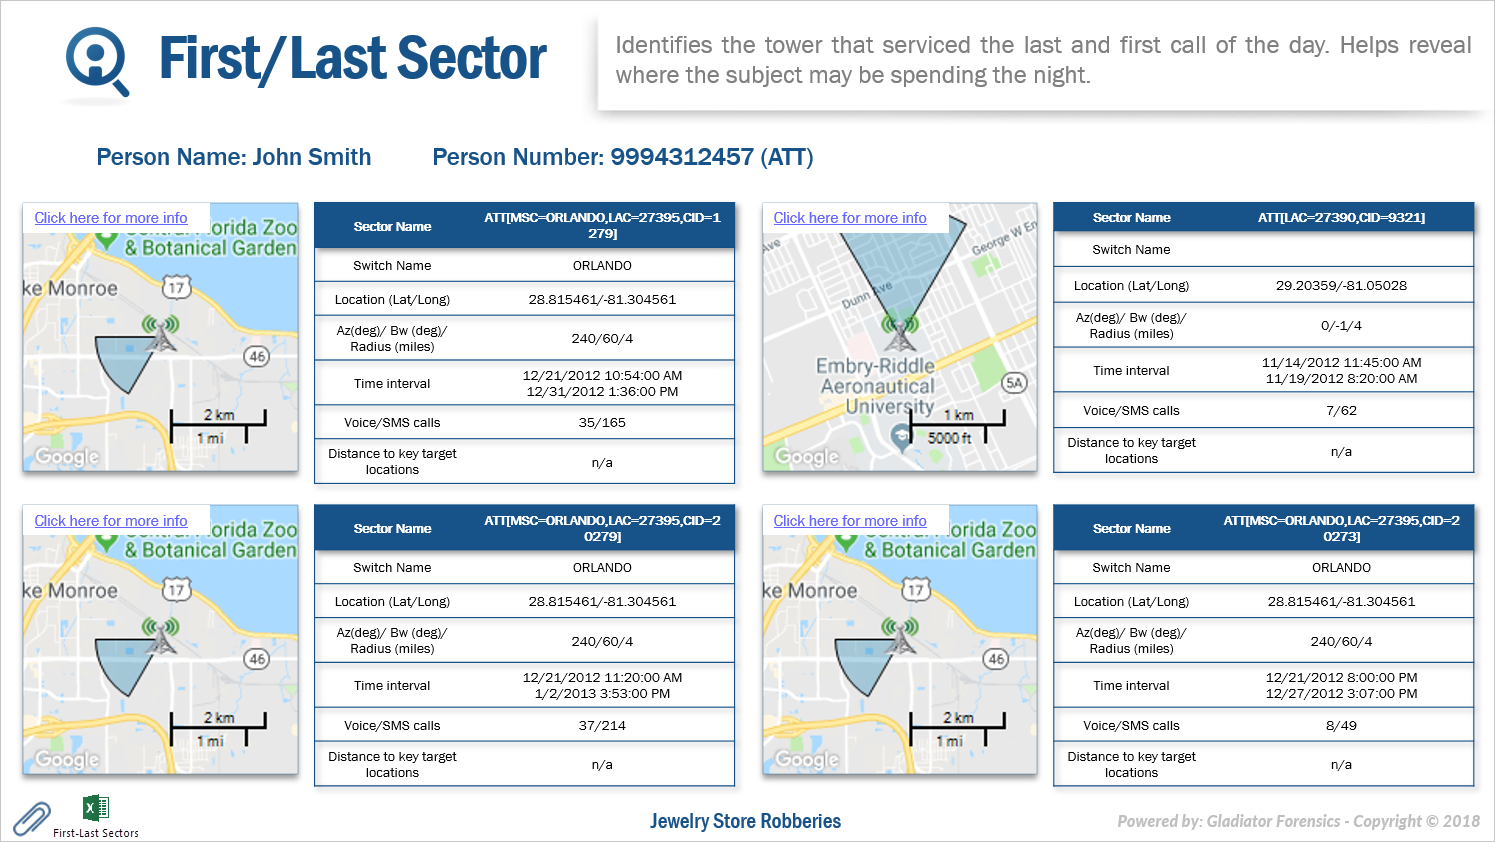
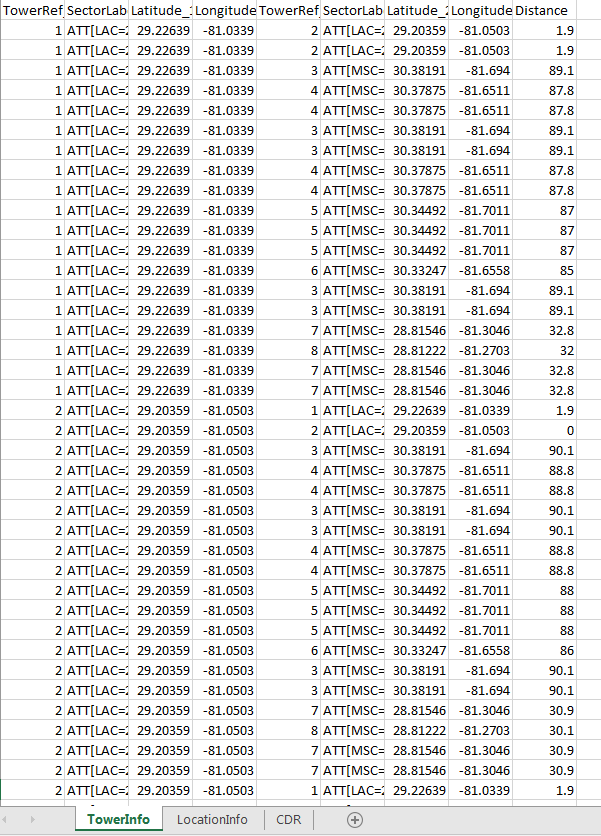
If you selected "Microsoft Excel" as an Output then this IQ packet section also provides a Microsoft Excel attachment that allows you to analyze the data further if required. The following graphic provides an example of the Microsoft Excel attachment.
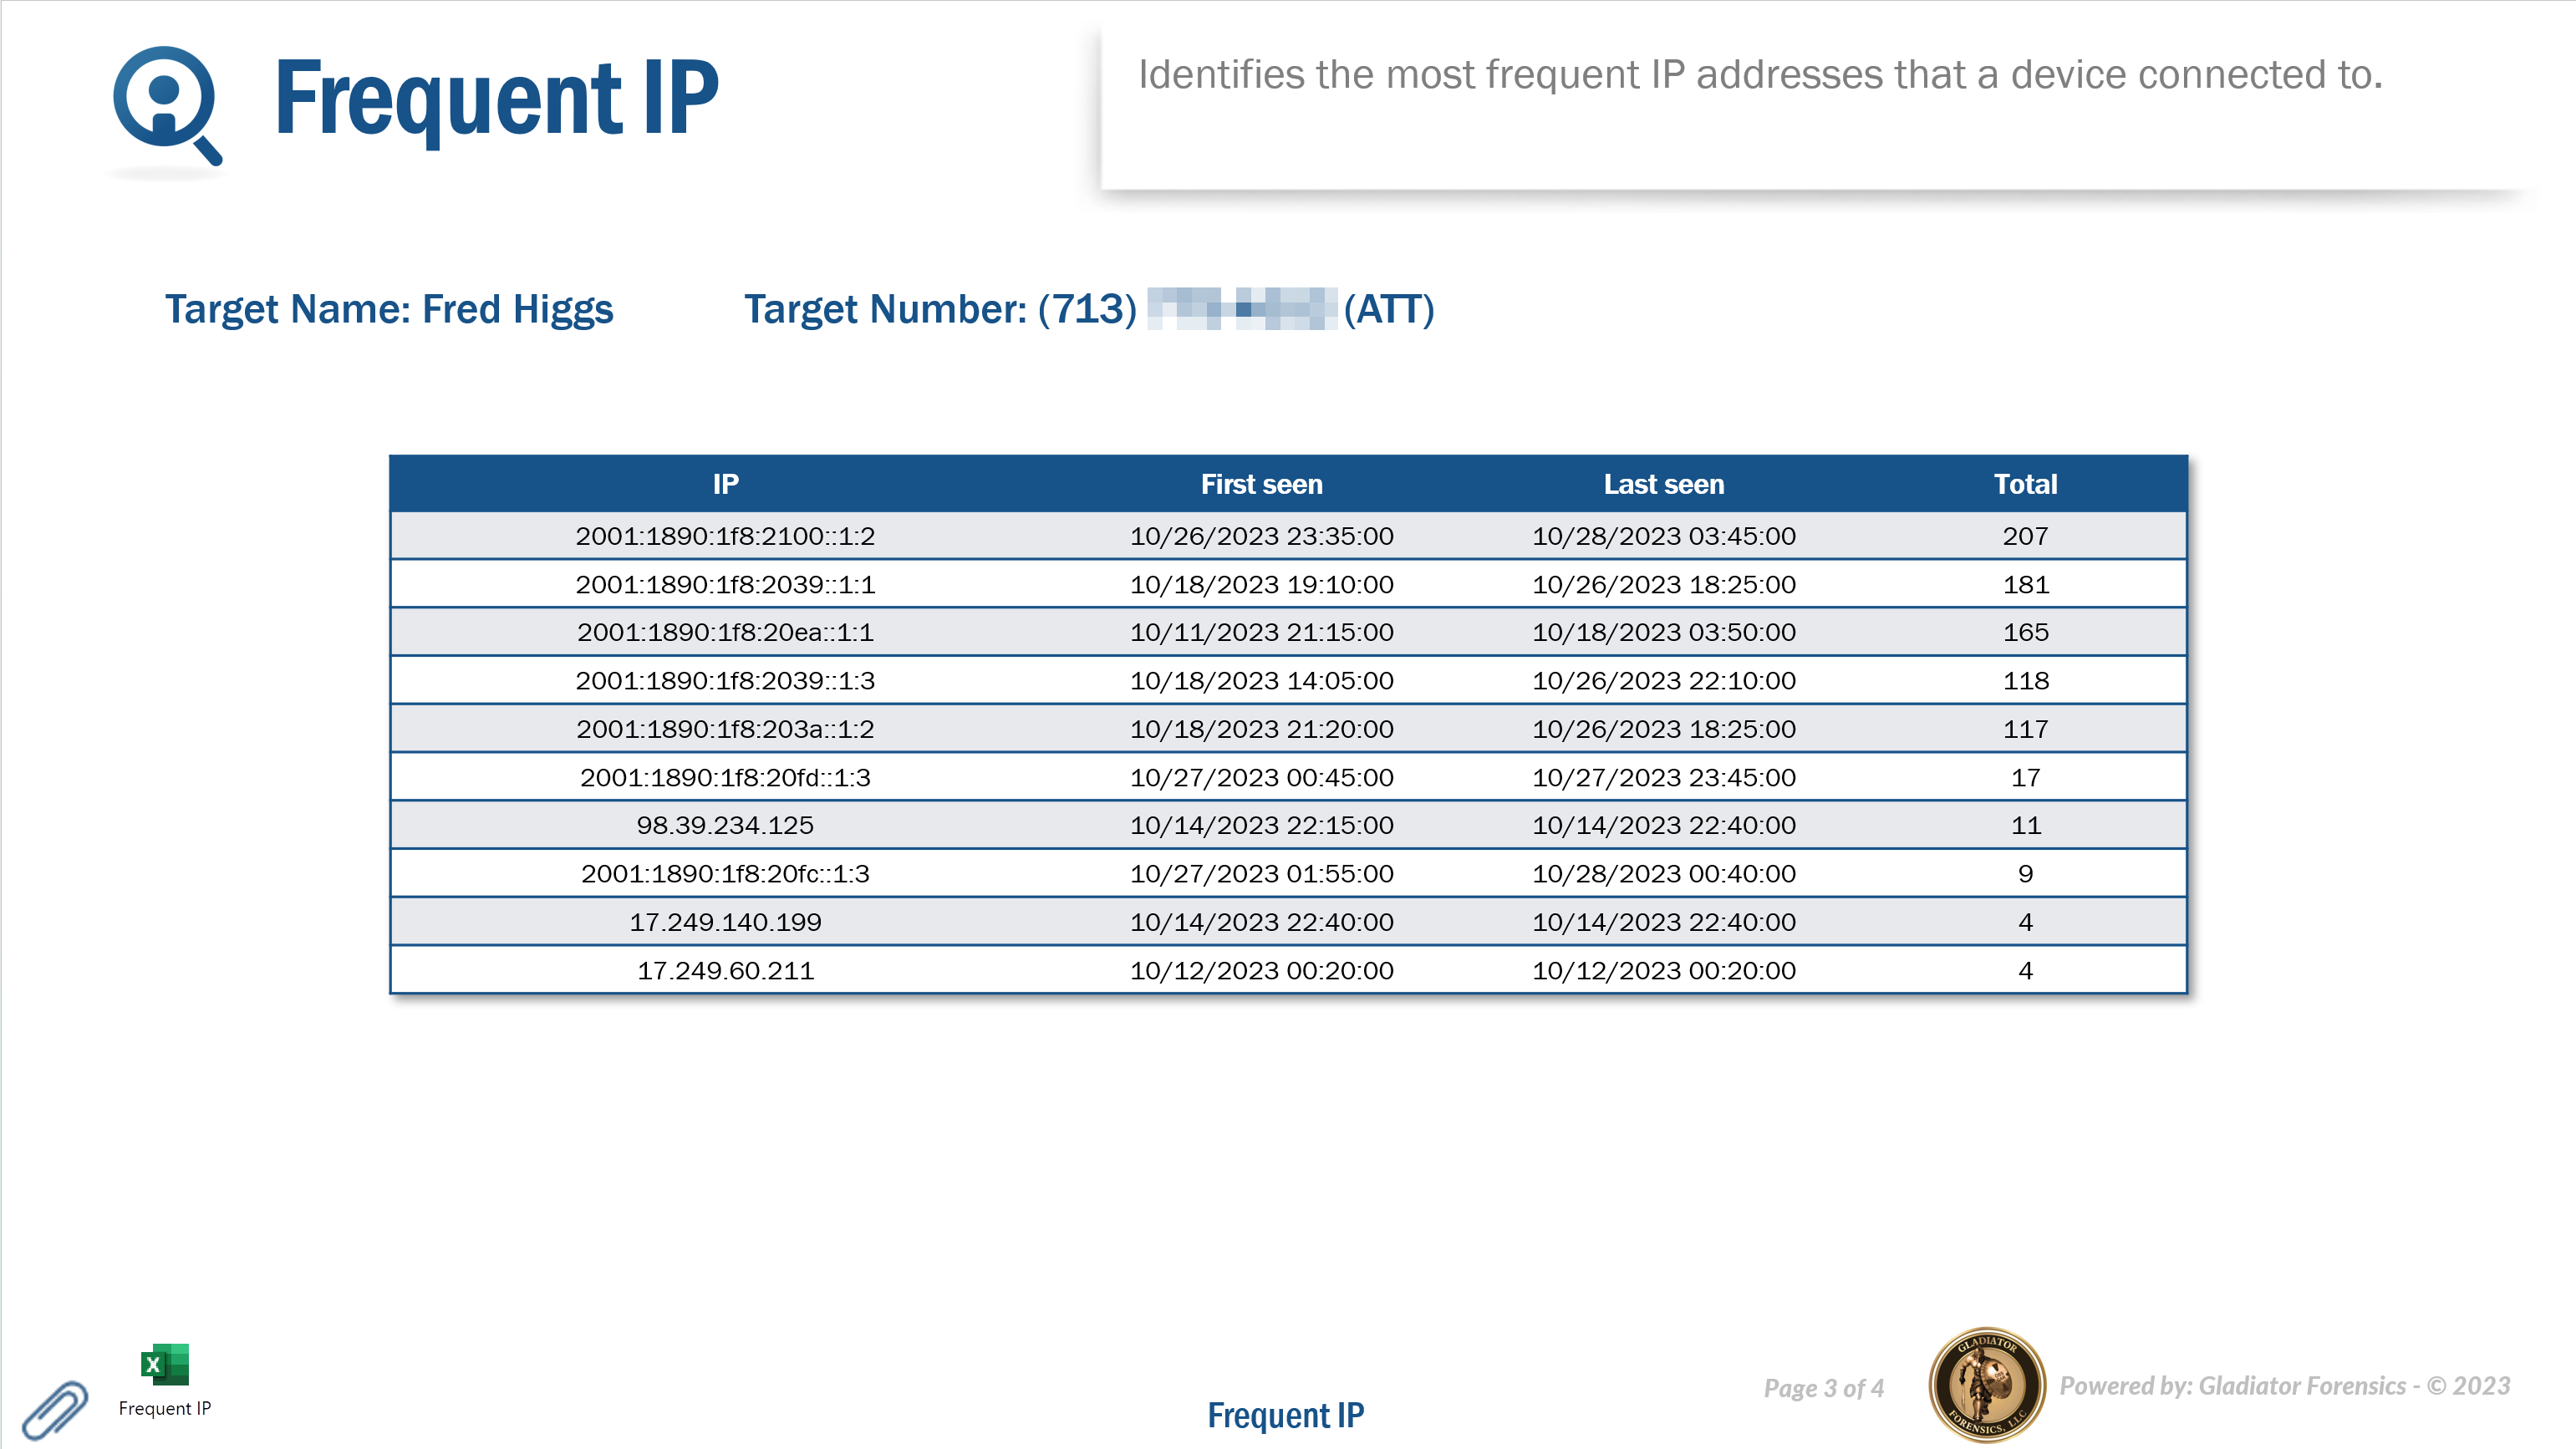
This section of the IQ packet identifies the most frequent IP addresses that a device connected to. It is designed to be sent to the operator for the purposes of performing a secondary search so that you can resolve a phone number or location of the IP address. These IP addresses may be either the person's location or the location of the IP address they are accessing.
With social media, if an IPv4 address comes in, you may want to resolve the IP address to an actual phone number or location. Operators such as Verizon often do not supply IPv6 for social media communication for example, Facebook and Instagram. They commonly provide an IP and port number. However they can provide a secondary search and provide you with a new phone number for a person if you provide them with the target's IPv4 address, port number and an exact time. The data that you download from the Frequent IP and Common IP analyses is what you can send them when you request a secondary search.
For each of the devices the IQ packet lists the top 10 frequently used IP addresses, along with the first and last time they were used and the total number of times they were used.
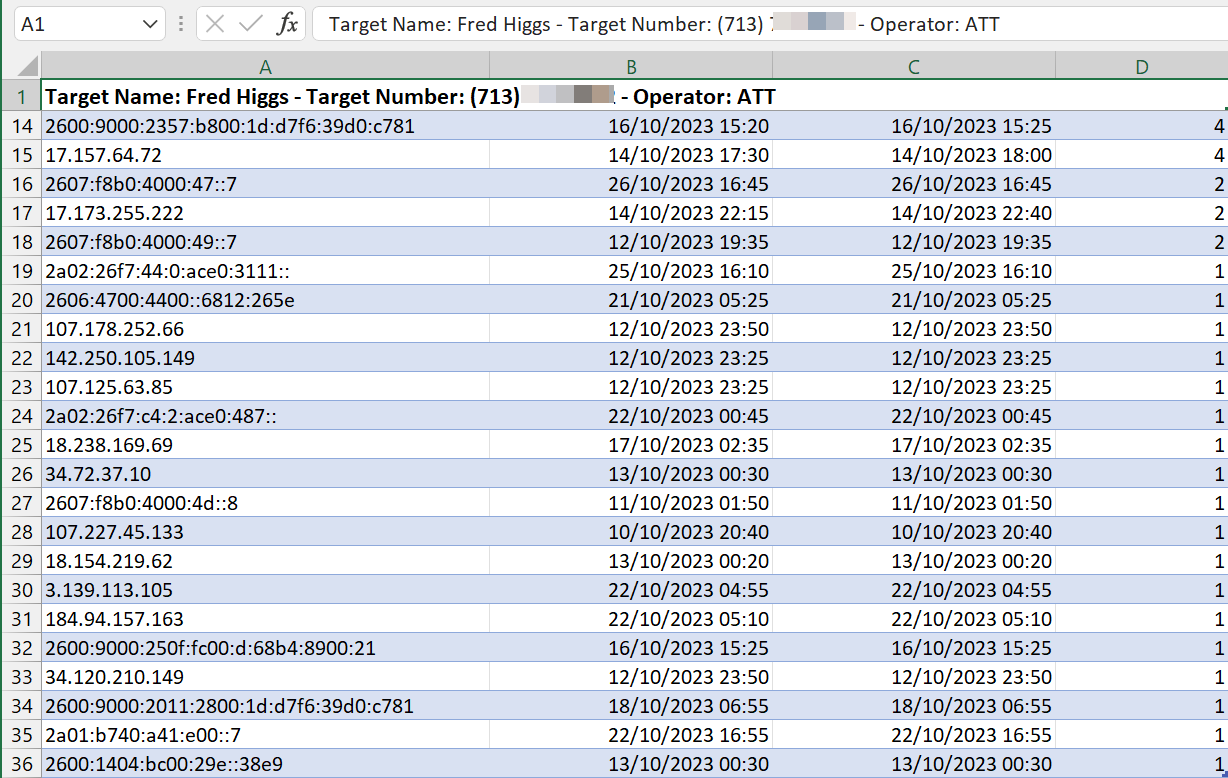
If you selected "Microsoft Excel" as an Output then this IQ packet section also provides a Microsoft Excel attachment which includes all the frequent IP addresses. The following graphic provides an example of the Microsoft Excel attachment.
This section of the IQ packet is designed to help you investigate the location pattern using the most frequent GPS ping locations. The Time interval displays the first and last time of a GPS ping in the location. The following are examples of how this data may help your investigation:
- A map location may be in this most frequently used location list but only because there were many geo-location events in the map location during the time of the crime and outside of that time the map location has no geo-location events.
-
If the last geo-location event from a frequent map location is around the time of the crime, it may indicate that the suspect fled the area or left the area, for example to hide evidence.
-
If a suspect’s first geo-location event from a frequent map location is located near the victim’s home or the victim’s travel location, it may indicate that the suspect has traveled to this location to commit the crime, for example to defraud a victim or to commit murder.
You can configure settings associated with this analysis using Frequent Locations.
For each of the target phone numbers and license plates you selected on the New IQ packet screen this section of the IQ packet displays by default the top ten most frequently visited map locations. The map locations are created and named automatically by OSS-ESPA using the format GL<n>. Each of these map locations are a defined by OSS-ESPA using a default bin size of 500m2.
A link is provided within the map allowing you to view the location in greater detail on a browser.
The following graphic provides an example of this section in an IQ packet report which was output in the Microsoft PowerPoint format.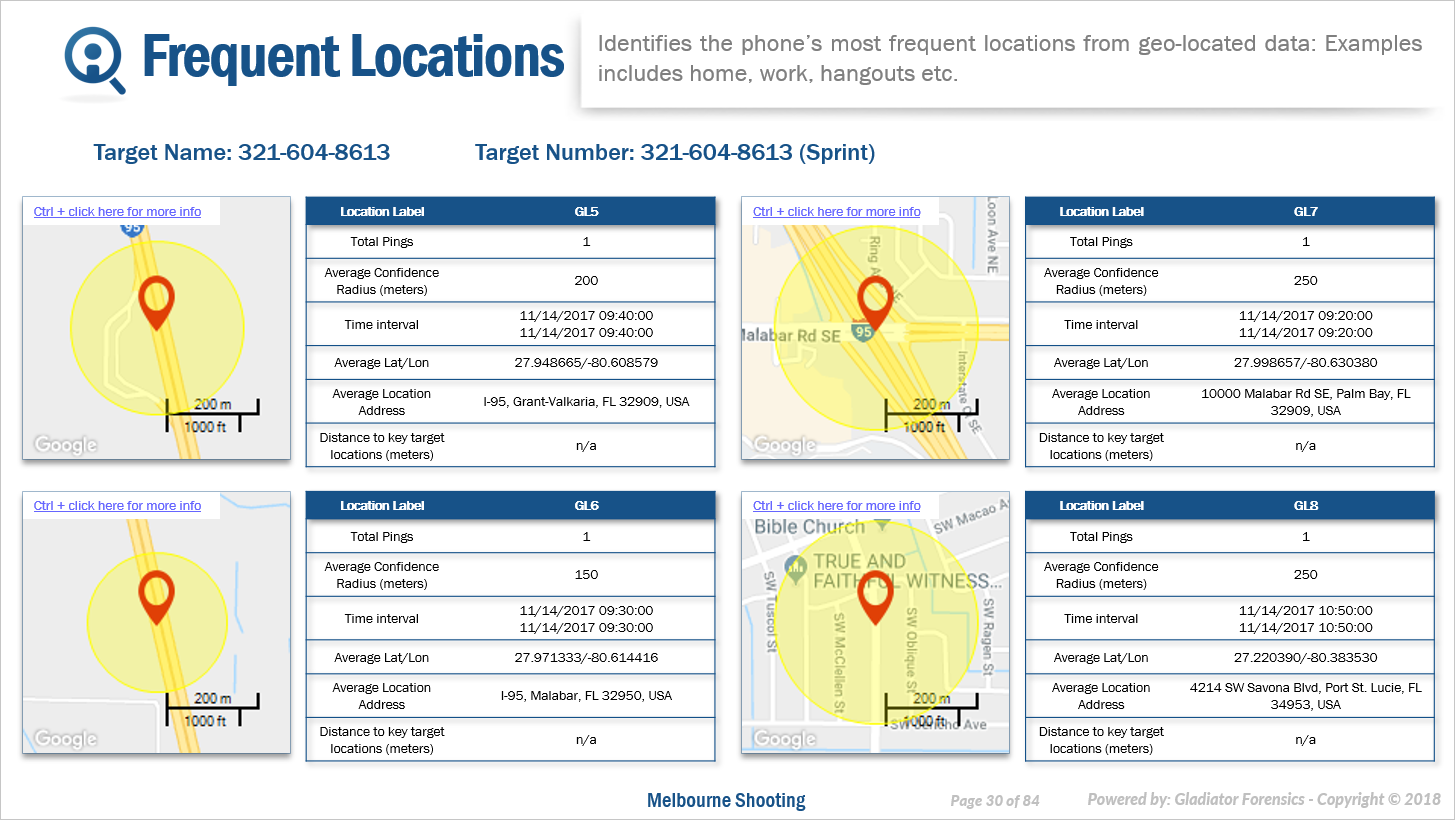
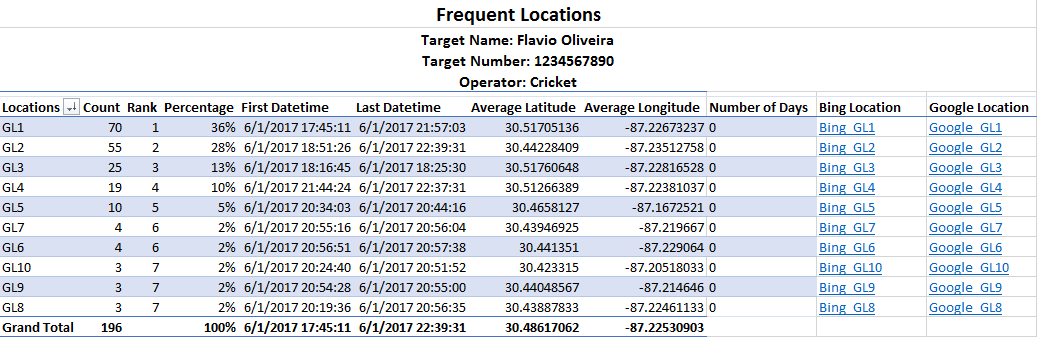
If you selected "Microsoft Excel" as an Output then this IQ packet section also provides a Microsoft Excel attachment that allows you to analyze the data further if required. The following graphic provides an example of the Microsoft Excel attachment. It includes all the locations' details and a number of tabs that allow you to view the data by timeframe.
This section of the IQ packet is designed to help you investigate regular contacts. You can then use this information to search for phone numbers in a public record database to determine the phone users names and addresses. This then provides you with additional interview leads, suspects or victims. In addition, the First call along with the Last call allow you to investigate the calling pattern between the two phone numbers. The following are examples of how this data may help your investigation:
- The number may be in this most frequently called phone numbers list but only because there were many calls during the time of the crime and outside of that time there was no phone contact. Depending on your crime this may indicate they were an accomplice.
- Anyone who calls often but stops calling around the time of a crime, for example a murder or an abduction, is a potential suspect. For example, a boyfriend may call his girlfriend frequently, but if his last call is immediately before the time his girlfriend is murdered then this may indicate that he knew of the murder and therefore he stopped calling her.
- A new frequently called contact may be a potential suspect. For example, the time of the first call may indicate that a victim just met the contact a few days prior to the crime.
You can configure settings associated with this analysis using Frequent Numbers.
For each of the people you selected to include on the New IQ packet screen this section of the IQ packet displays their name and phone number along with a table detailing the top ten most frequently called phone numbers. Any additional phone calls are grouped under the result titled Other.
The following graphic provides an example of this section in an IQ packet report which was output in the Microsoft PowerPoint format.
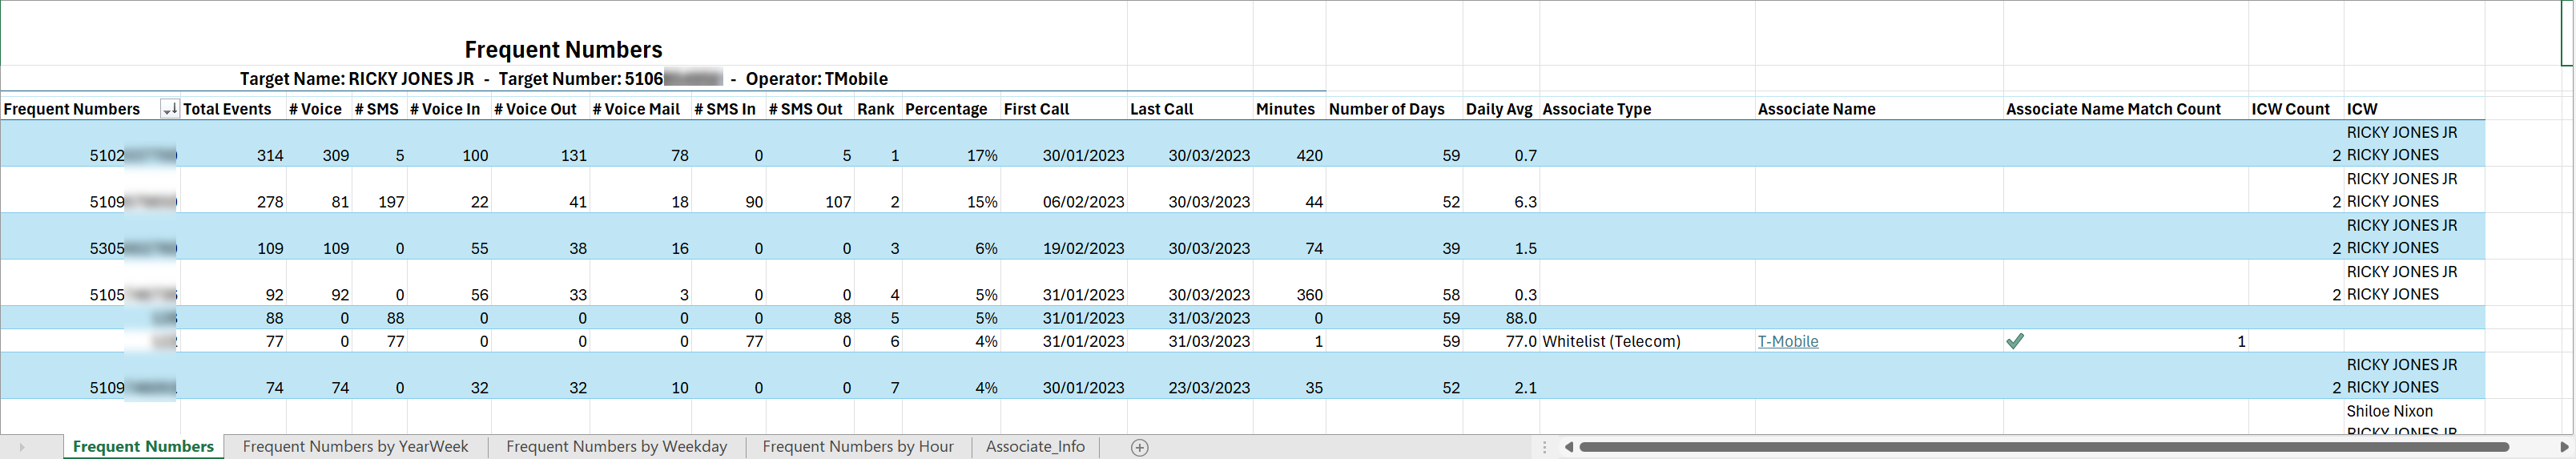
If you selected "Microsoft Excel" as an Output then this IQ packet section also provides two Microsoft Excel attachments that allow you to analyze this data further if required. The following graphic provides an example of the Microsoft Excel attachment.
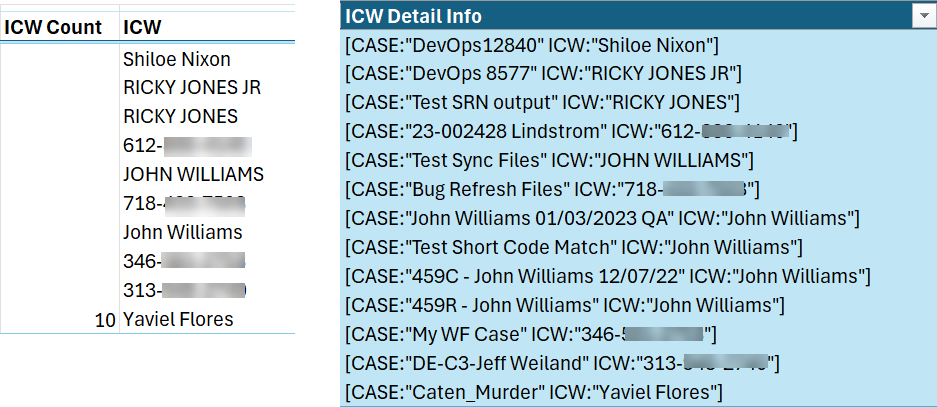
The Frequent Numbers attachment provides a list of all the contact phone numbers, and a number of tabs that allow you to view the data by year/week, weekday and hour. The Associate_Info tab provides more details on any of the frequent numbers which include the associate's name.
If you run the IQ packet with Show ICW info on excel output selected then these additional ICW (in contact with) details are included:
ICW Count and ICW columns are included on the Frequent numbers tab of the Excel output, displaying the number of other targets the frequent number was in contact with and the target names respectively.
an ICW Detail Info column is included on the Associate_Info tab of the Excel output, which details the case names and the target names.
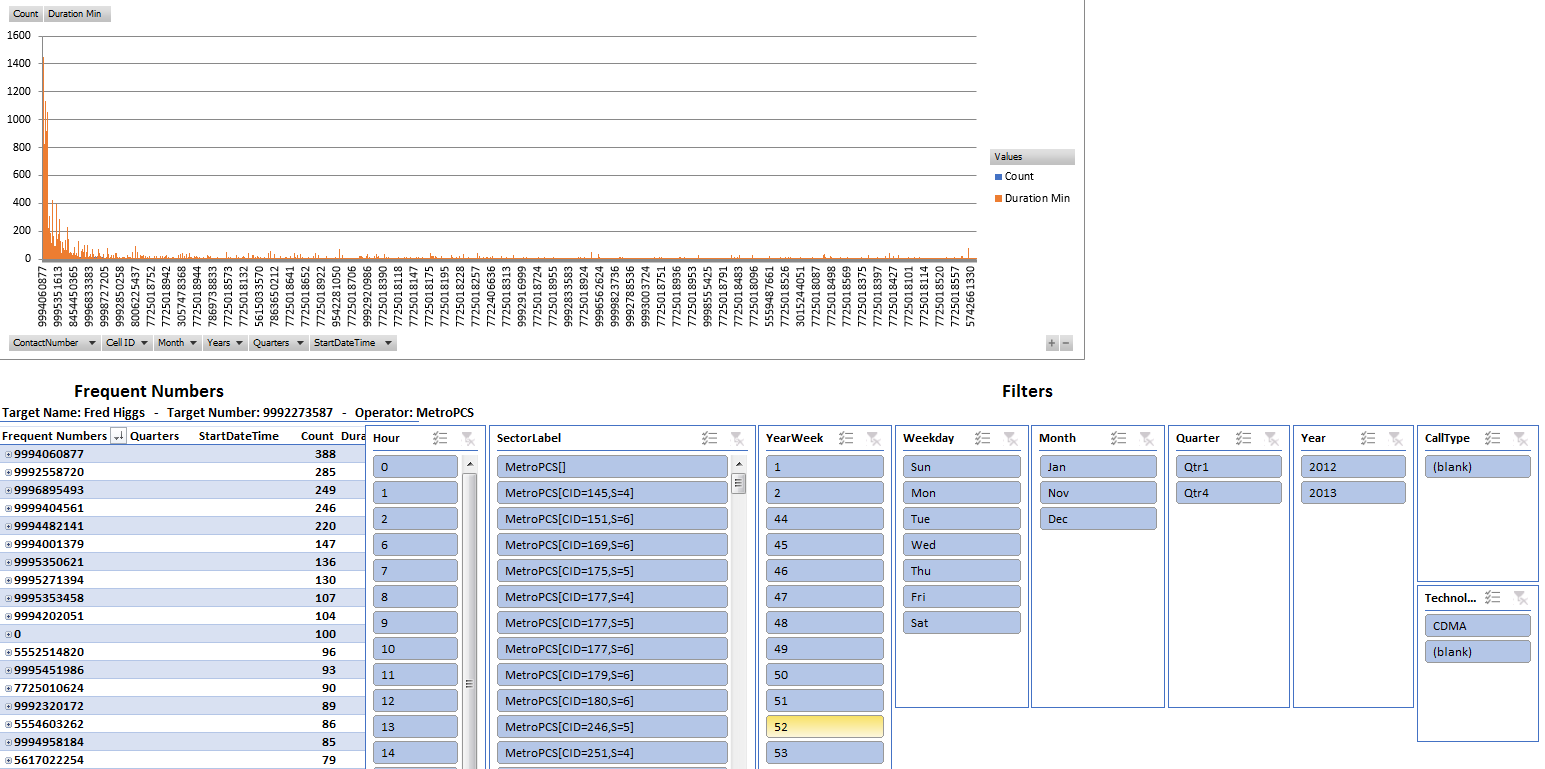
The Adv_Frequent Numbers attachment provides a graphic representation of the frequent numbers and allows you to configure filters to display the breakdown of the results to suit your needs.
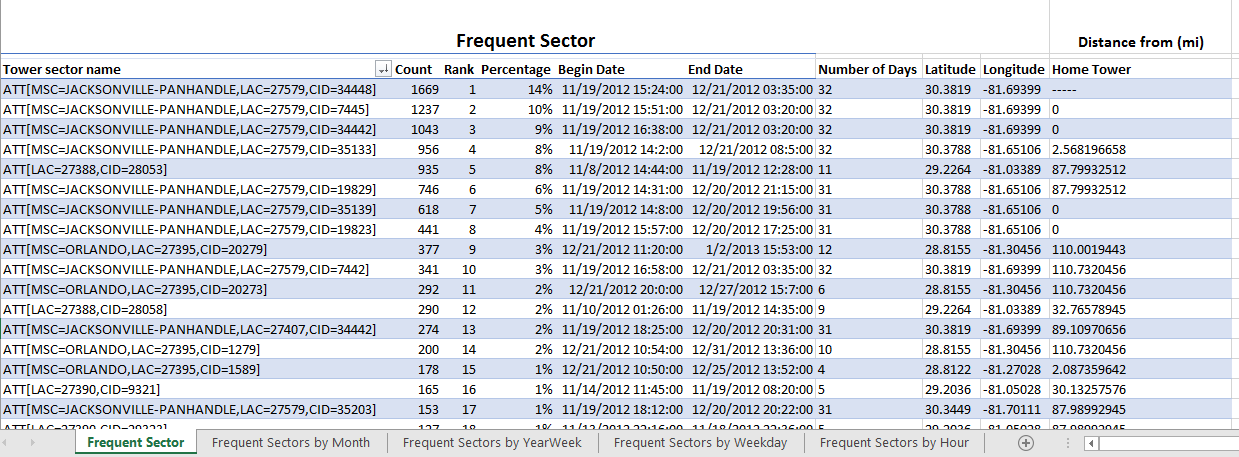
This section of the IQ packet report is designed to help you investigate the calling pattern using the most frequently used sectors. The Time interval displays the first time a call or SMS was made or received using the sector. The following are examples of how this data may help your investigation:
- A sector that is frequently used over a long time interval may indicate where a person spends a lot of time such as their home, place of work or a regular meeting place. This can help you find a person and it may be somewhere you want to search or perform surveillance at if you determine the location is a place of interest, for example a partners or parents home.
- A sector may be in this most frequently used sector list but only because there were many calls using the sector during the time of the crime and outside of that time the sector was not used.
-
If the last call from a frequent sector is around the time of the crime, it may indicate that the suspect fled the area or left the area, for example to hide evidence.
-
If a suspect’s first call from a frequent sector is located near the victim’s home or the victim’s travel location, it may indicate that the suspect has traveled to this location to commit the crime, for example to defraud a victim or to commit murder.
You can configure settings associated with this analysis using Frequent Sectors.
For each of the phone numbers you selected on the New IQ packet screen this section of the IQ packet displays a map of each of the top ten most frequently used sectors along with a table including the sector and its usage. A link is provided within the map allowing you to view the sector in greater detail on a browser. How each sector is titled depends on what information is available in the CDR. The operator name is always displayed. The following details are optional: MSC (switch) name; LAC; Cell id (CID); and Sector id (S). For example, an ATT sector with a LAC of 12345 and a Cell ID of 98765 is titled “ATT[LAC=12345,CID=98765]”. Any sectors without correlated latitude/longitude values include "(no location)" at the end of the title. For example "Sprint[LAC=987](no location)”.
Voice/SMS calls displays the total call and SMS count made or received using the sector, and Distance to key target locations displays the closest of the target locations along with the distance in miles.
The following graphic provides an example of this section in an IQ packet report which was output in the Microsoft PowerPoint format.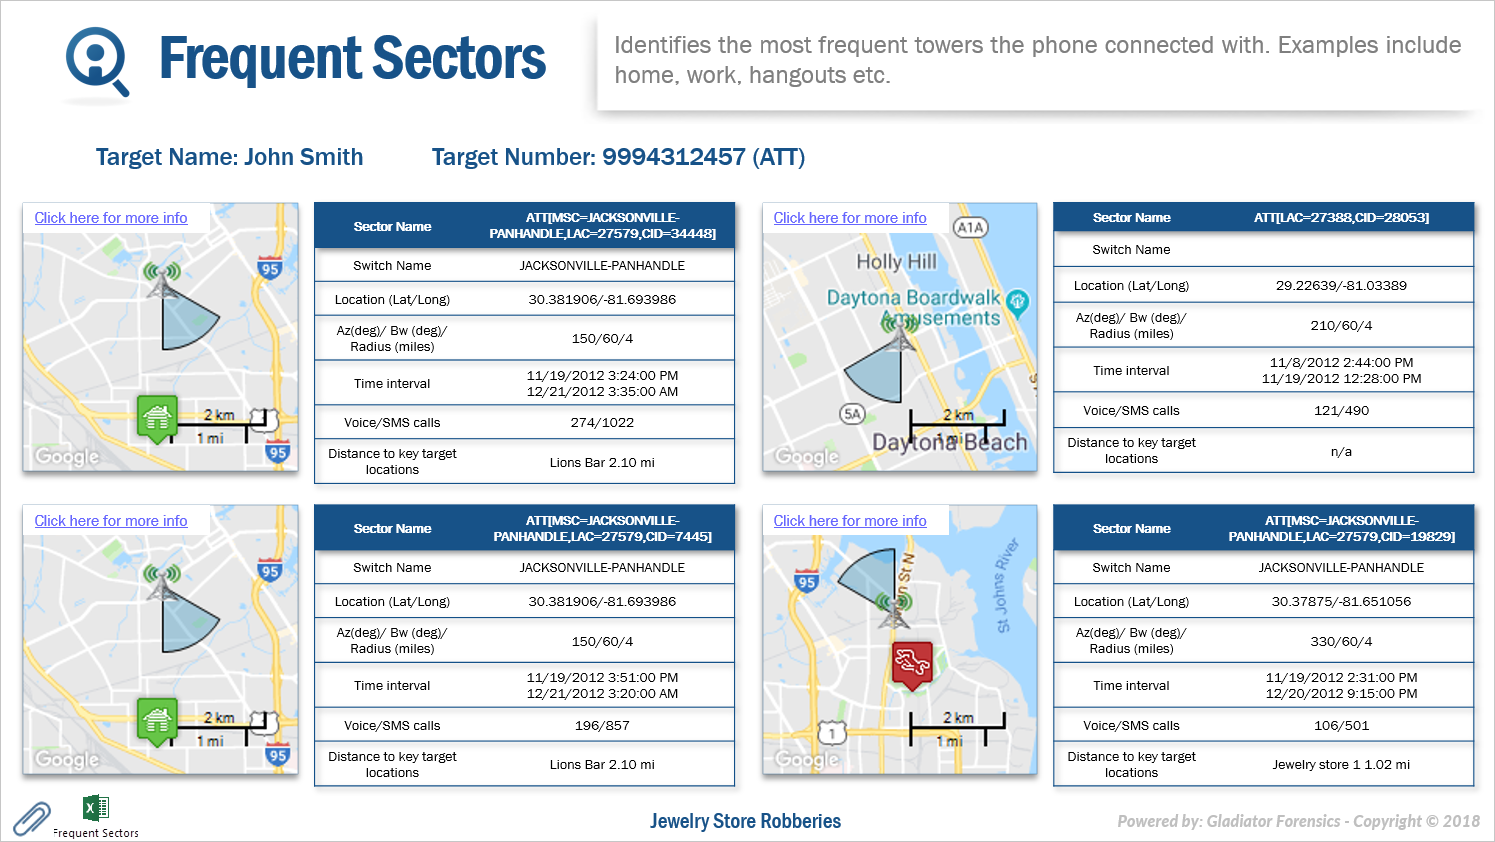
If you selected "Microsoft Excel" as an Output then this IQ packet section also provides a Microsoft Excel attachment that allows you to analyze the data further if required. The following graphic provides an example of the Microsoft Excel attachment. It includes all the sectors' details and a number of tabs that allow you to view the data by month, year/week, weekday, and hour.
For each of the persons you selected on the New IQ packet screen this section of the IQ packet displays a link and password which allows you to download a CDR output that you can use in Google Earth.
The following graphic provides an example of this section in an IQ packet report which was output in the Microsoft PowerPoint format.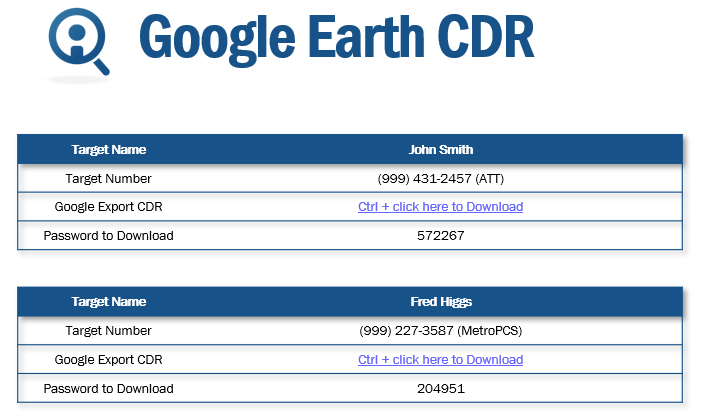
This section of the IQ packet is designed to help you identify where the person is spending long periods of time but not using their phone, for example where they are potentially sleeping or working. For this analysis to be of use there must be a significant amount of calls and the calling period must be greater than 48 hours, however the recommended minimum period is one week. If possible uploading historical data for at least one month will give you a more useful result.
You can configure settings associated with this analysis using Idle Sectors.
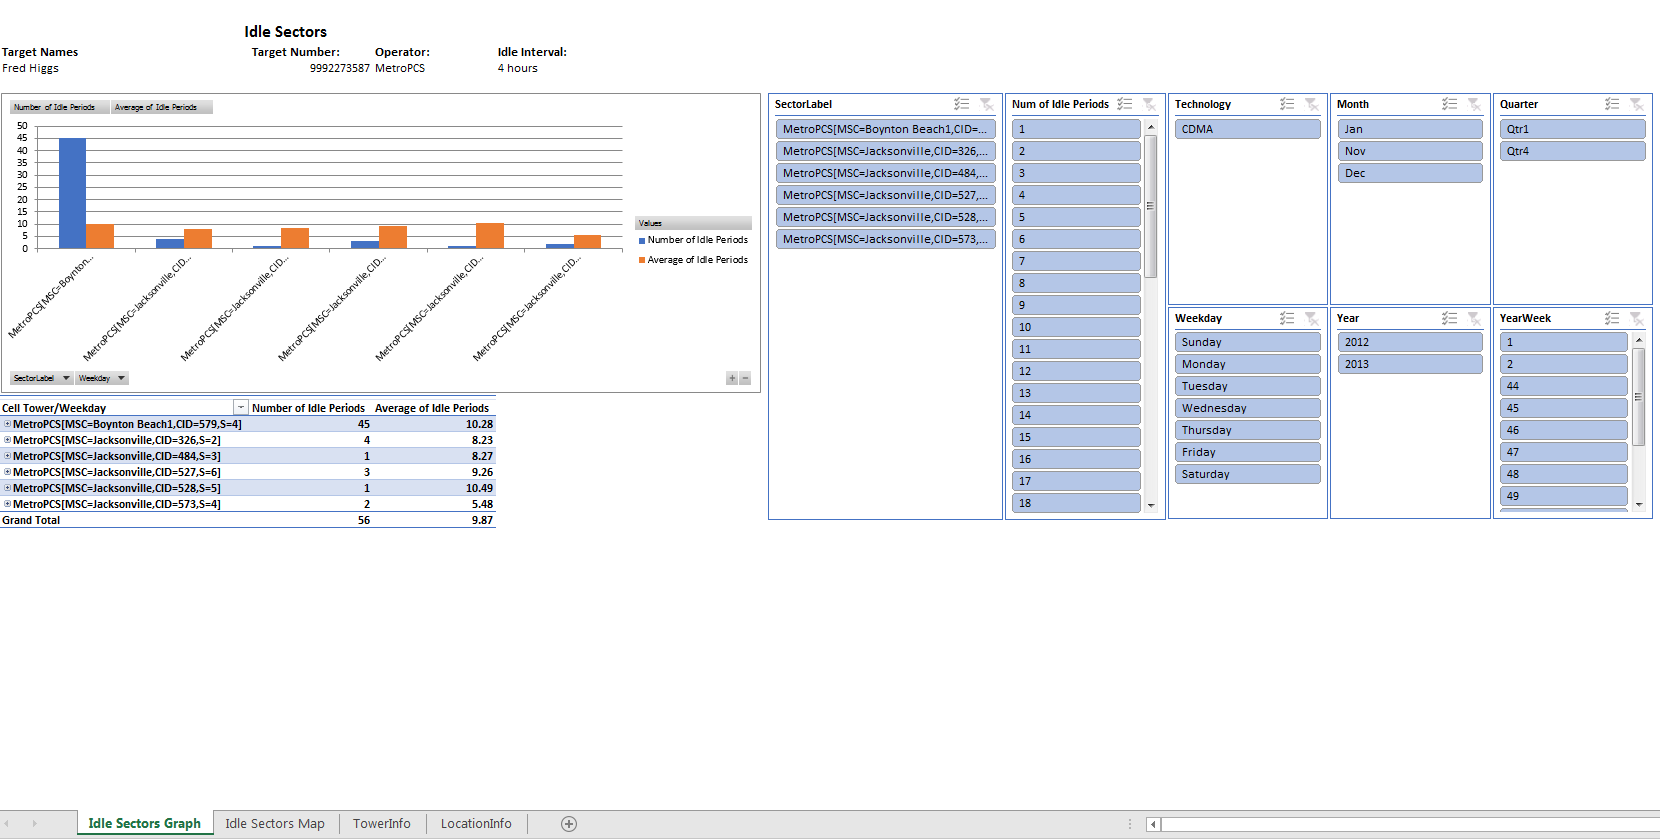
For each of the people you selected to include on the New IQ packet screen this section of the IQ packet displays by a maximum of the top ten sectors where the phone is located for a long period of time without making or answering any calls or sending any SMS messages. Note, if a phone never meets the criteria set for this analysis then the phone number will not display in the analysis.
The following graphic provides an example of this section in an IQ packet report which was output in the Microsoft PowerPoint format.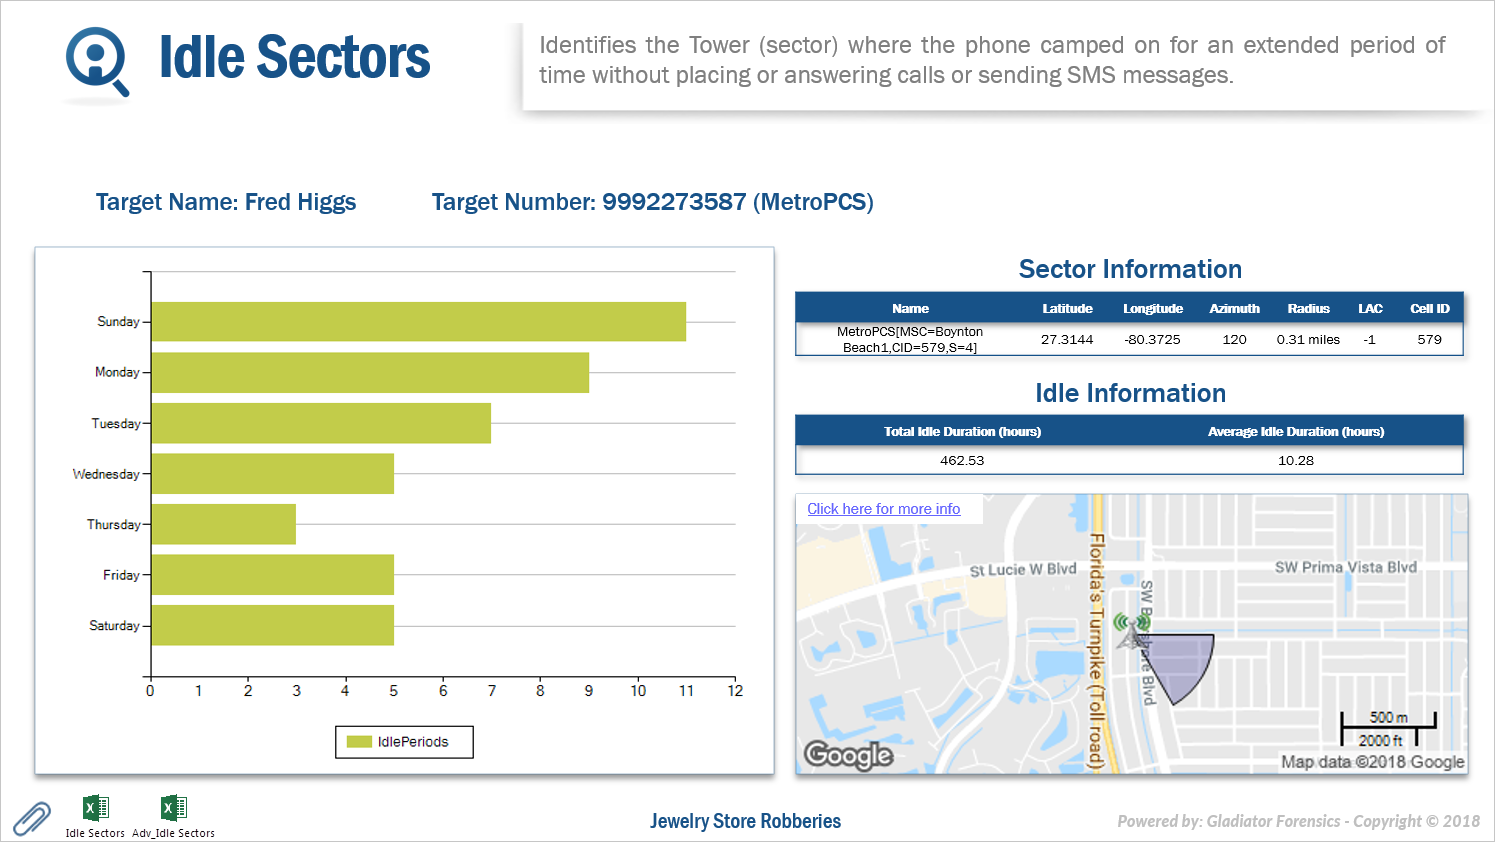
If you selected "Microsoft Excel" as an Output then this IQ packet section also provides two Microsoft Excel attachments that allow you to analyze this data further if required. The following graphic provides an example of the Microsoft Excel attachment.
The Idle sectors attachment provides a list of all the idle sectors including the cell tower and location details.
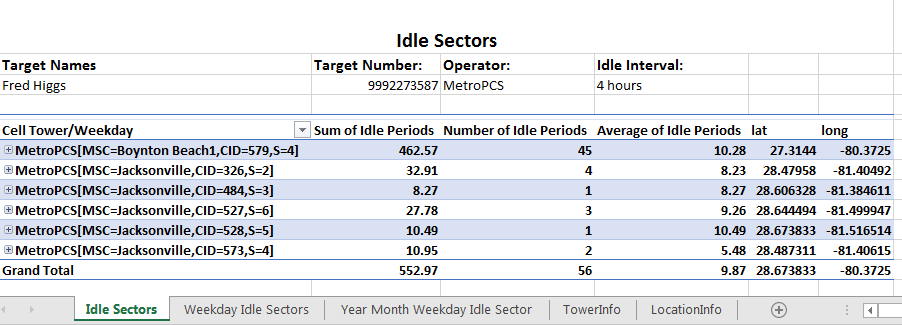
The Adv_Idle sectors attachment provides a graphic representation of the idle sectors analysis and allows you to configure filters to display the breakdown of the results to suit your needs.
You can configure settings associated with this analysis using Live Target Summary.
This section of the IQ packet is designed to help you identify phone users who were close to a target location during similar times.
For each of the target phone numbers you selected, this displays the locations where two or more target phones were close to a target location within a specified time interval. The analysis is performed using the same method used in the common-location time analysis to determine if the target phones were using sectors within a specified distance of each other within a specified time interval; it then additionally analyzes whether or not the sector is located within the target location's buffer.
You can configure the time interval and sector inclusion distance associated with this analysis using Location with common location-time.
This section of the IQ packet displays for each result the target location and the time interval and the phone users involved.
The following graphic provides an example of this section in an IQ packet report which was output in the Microsoft PowerPoint format.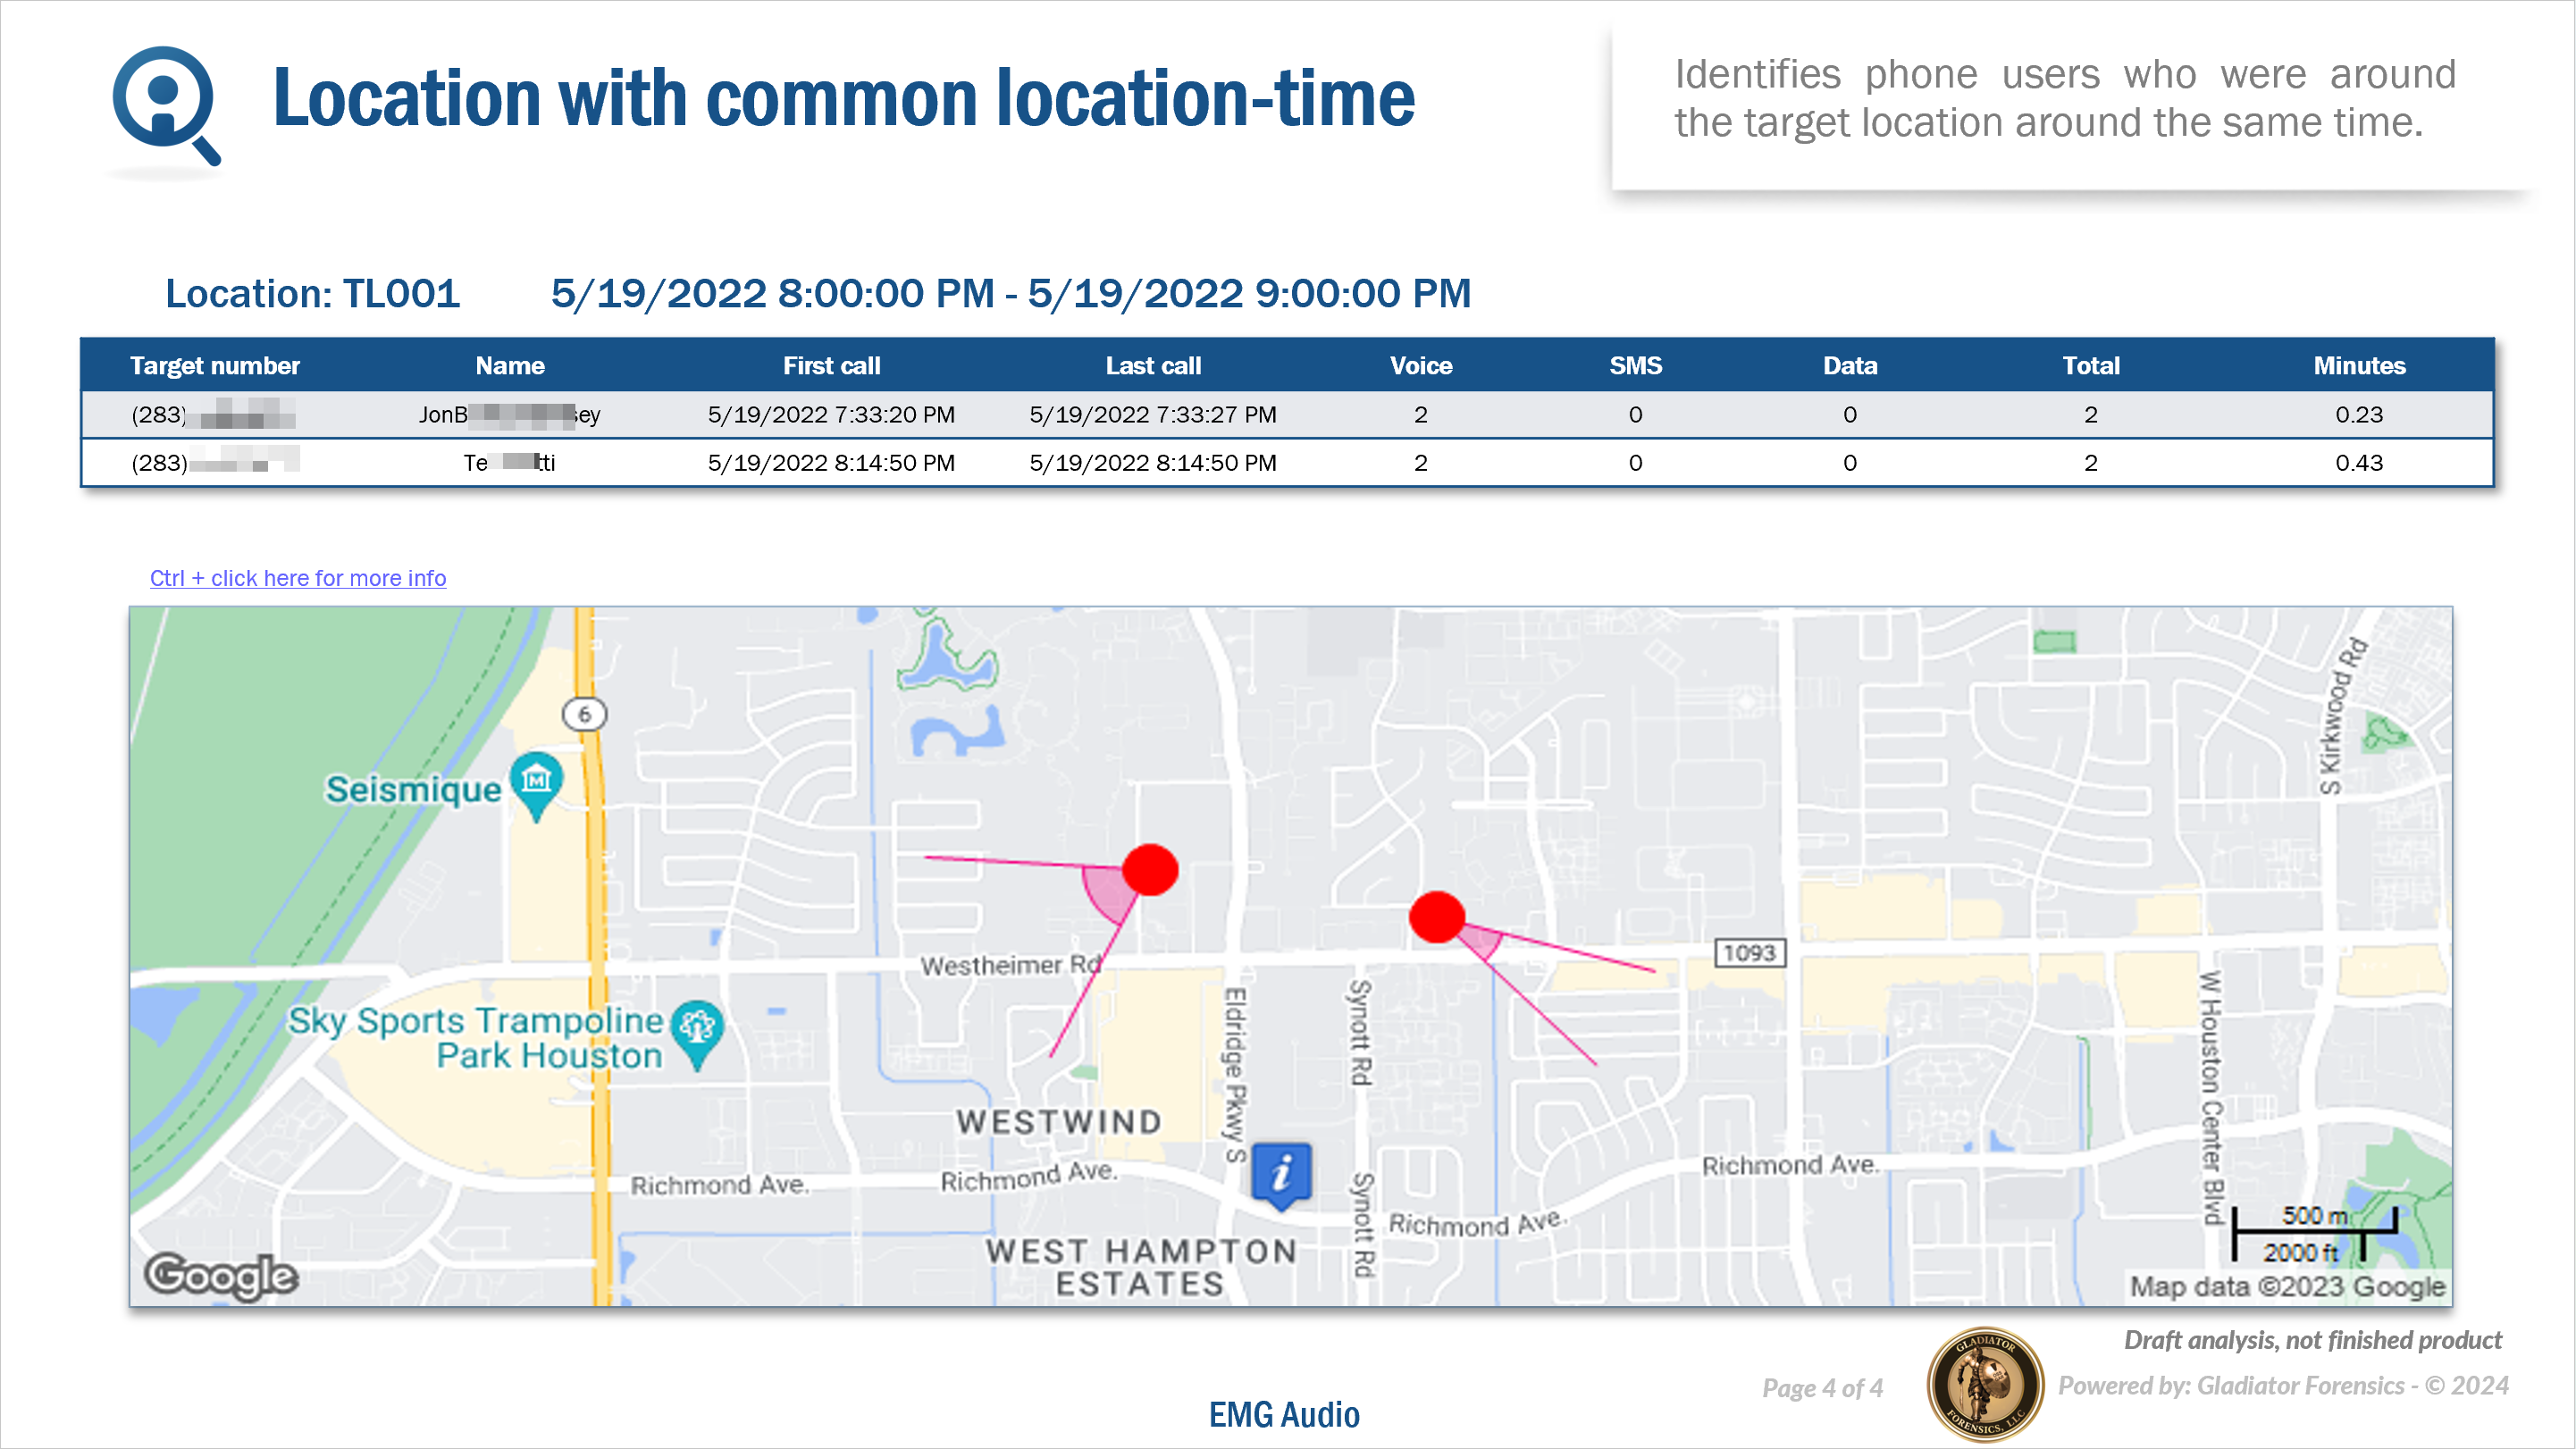
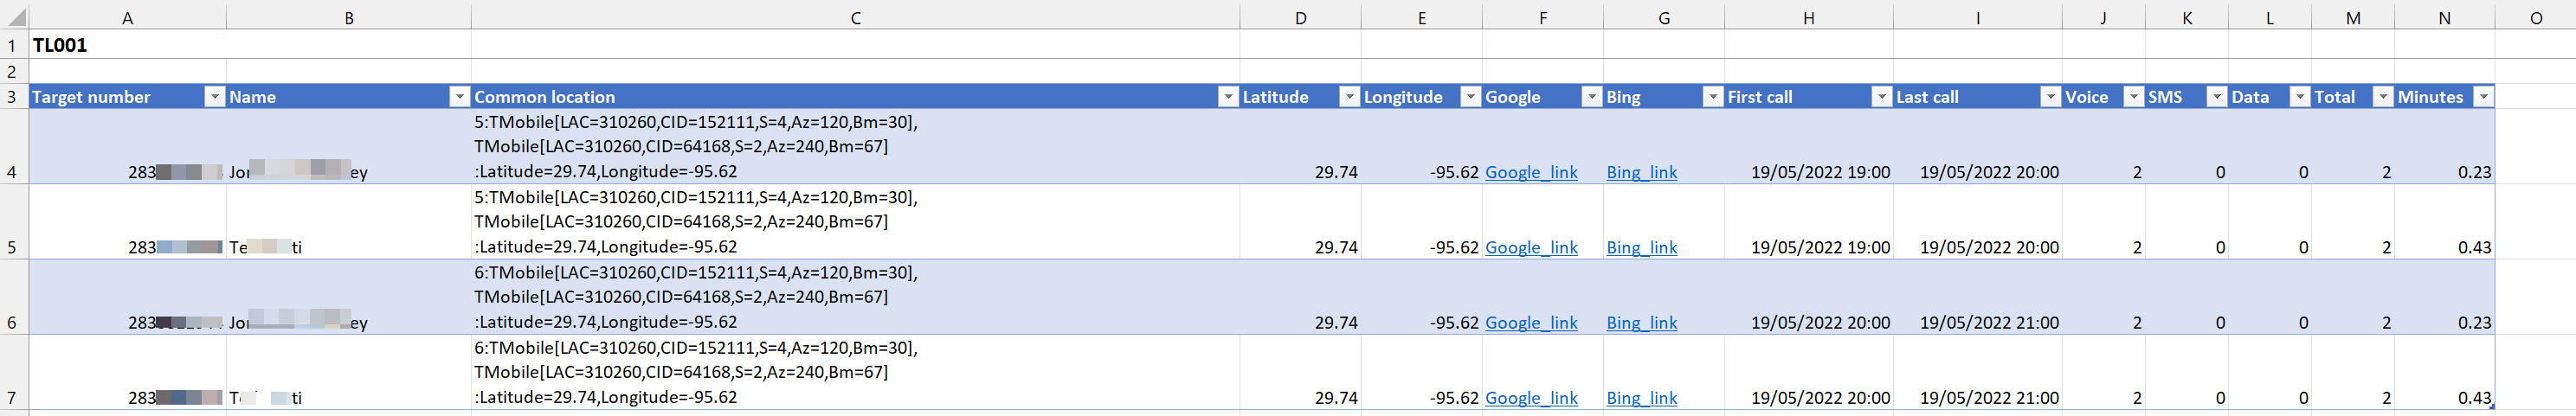
If you selected "Microsoft Excel" as an Output then this IQ packet section also provides two Microsoft Excel attachments that allow you to analyze this data further if required. The following graphic provides an example of the Microsoft Excel attachment.
This section of the IQ packet is designed to help you identify all the devices that were at each location.
You can configure settings associated with this analysis using Location with Person's Device.
For each of the people and locations you selected to include on the New IQ packet screen this section of the IQ packet displays all the people that were at each location. The analysis only includes analysis locations which are those that have a Location buffer, Event start and Event end time defined on the Locations of interest screen (Case management).
This section of the IQ packet displays for each location with person's device:
-
a map displaying the sectors used by the person at the location. The location is defined by the Latitude /Longitude and its surrounding perimeter which is specified by the Location buffer. A link is provided within the map allowing you to view the map in greater detail on a browser along with the calls made by the person while in the location. There are also tables detailing the location information and the sector information.
The following graphic provides an example of this section in an IQ packet report which was output in the Microsoft PowerPoint format.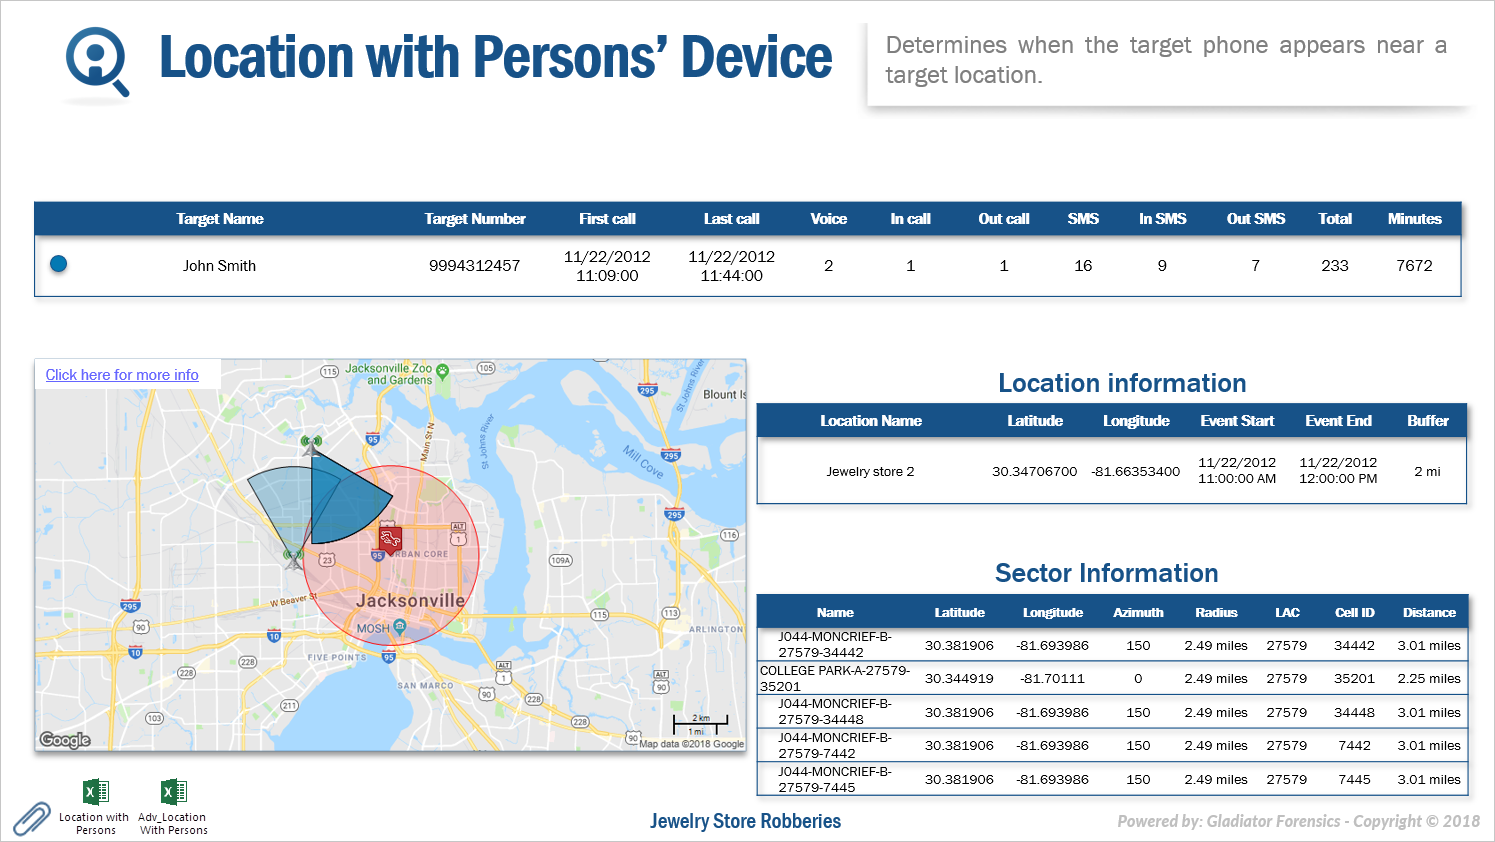
-
tables detailing all the calls made or received by the person at each location during the event time.
The following graphic provides an example of this section in an IQ packet report which was output in the Microsoft PowerPoint format.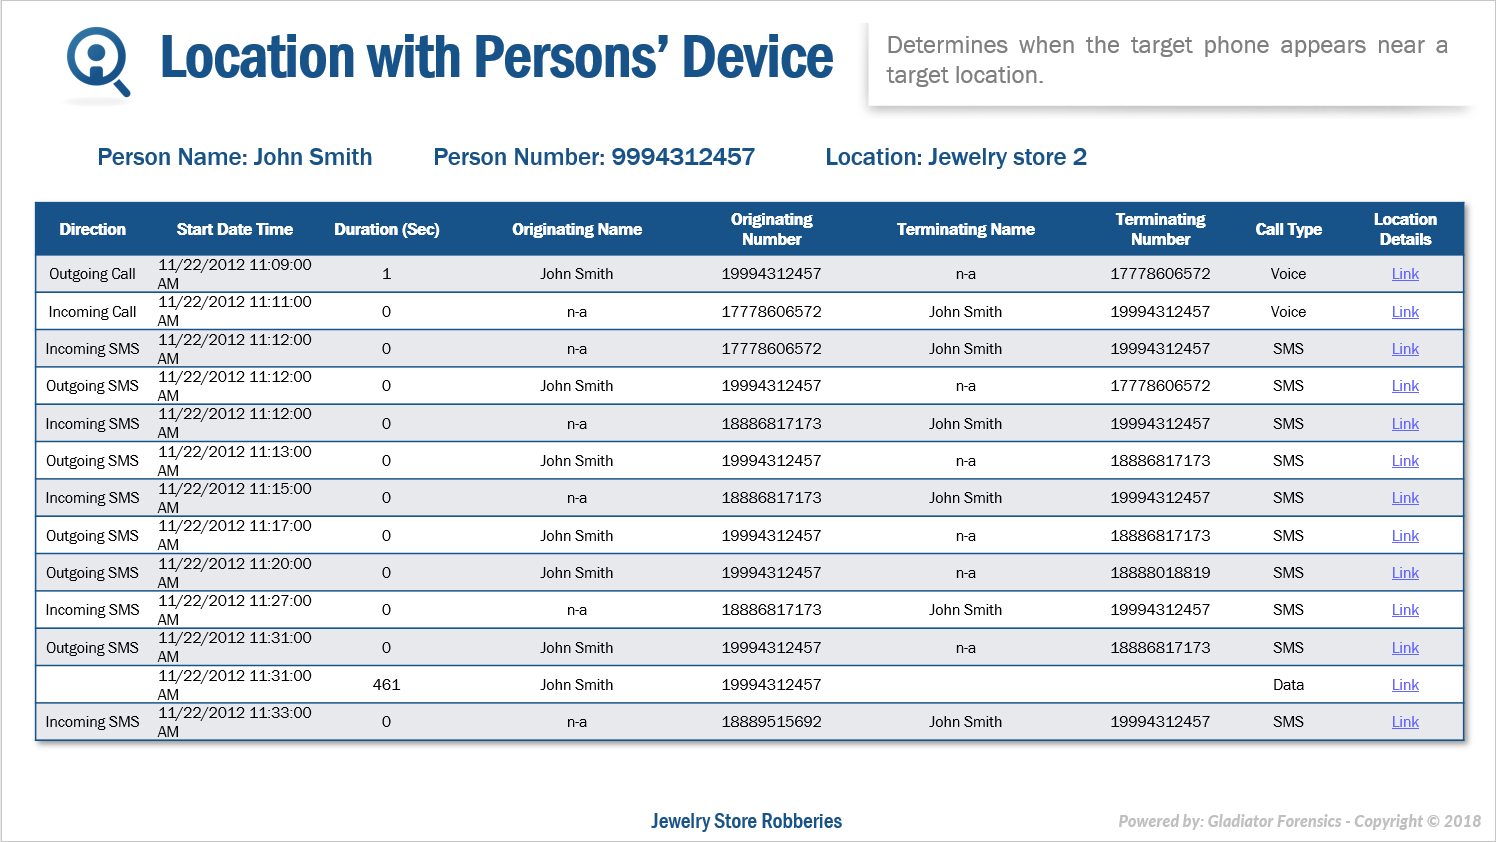
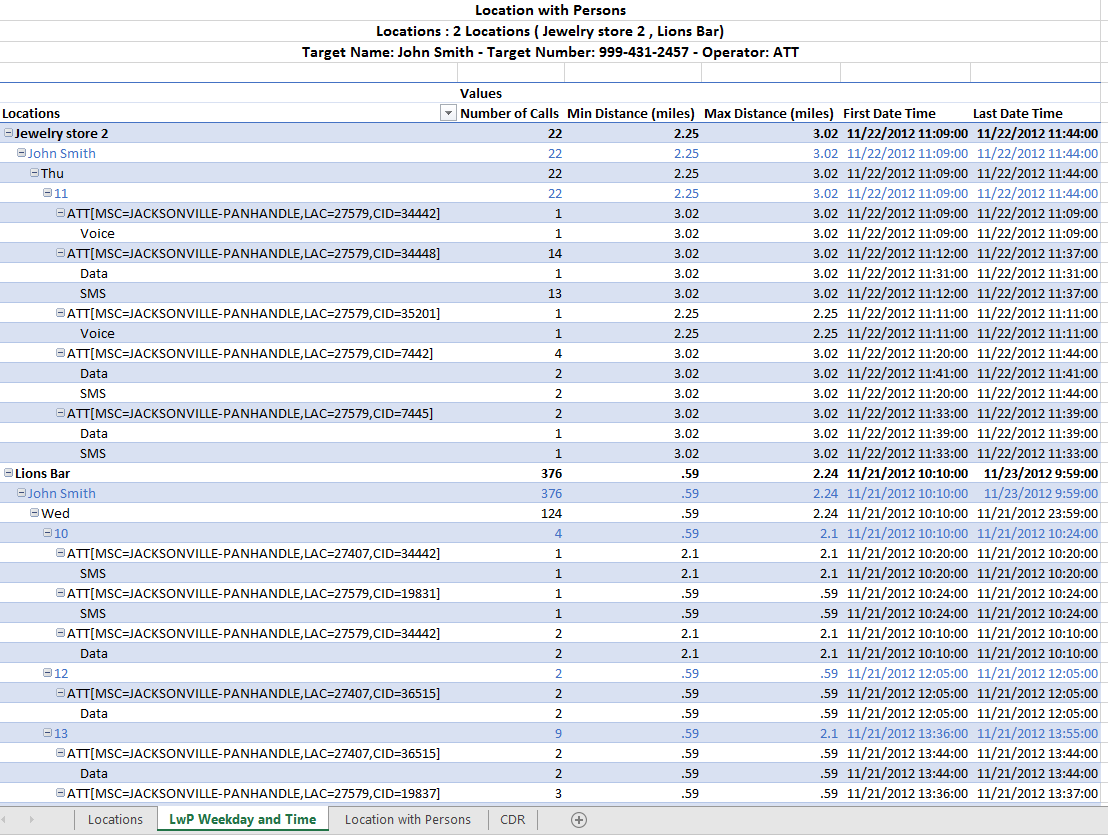
If you selected "Microsoft Excel" as an Output then this IQ packet section also provides two Microsoft Excel attachments that allow you to analyze this data further if required. The following graphic provides an example of the Microsoft Excel attachment.
-
The Location with Persons attachment provides a list of all the locations the person was at along with the call data.
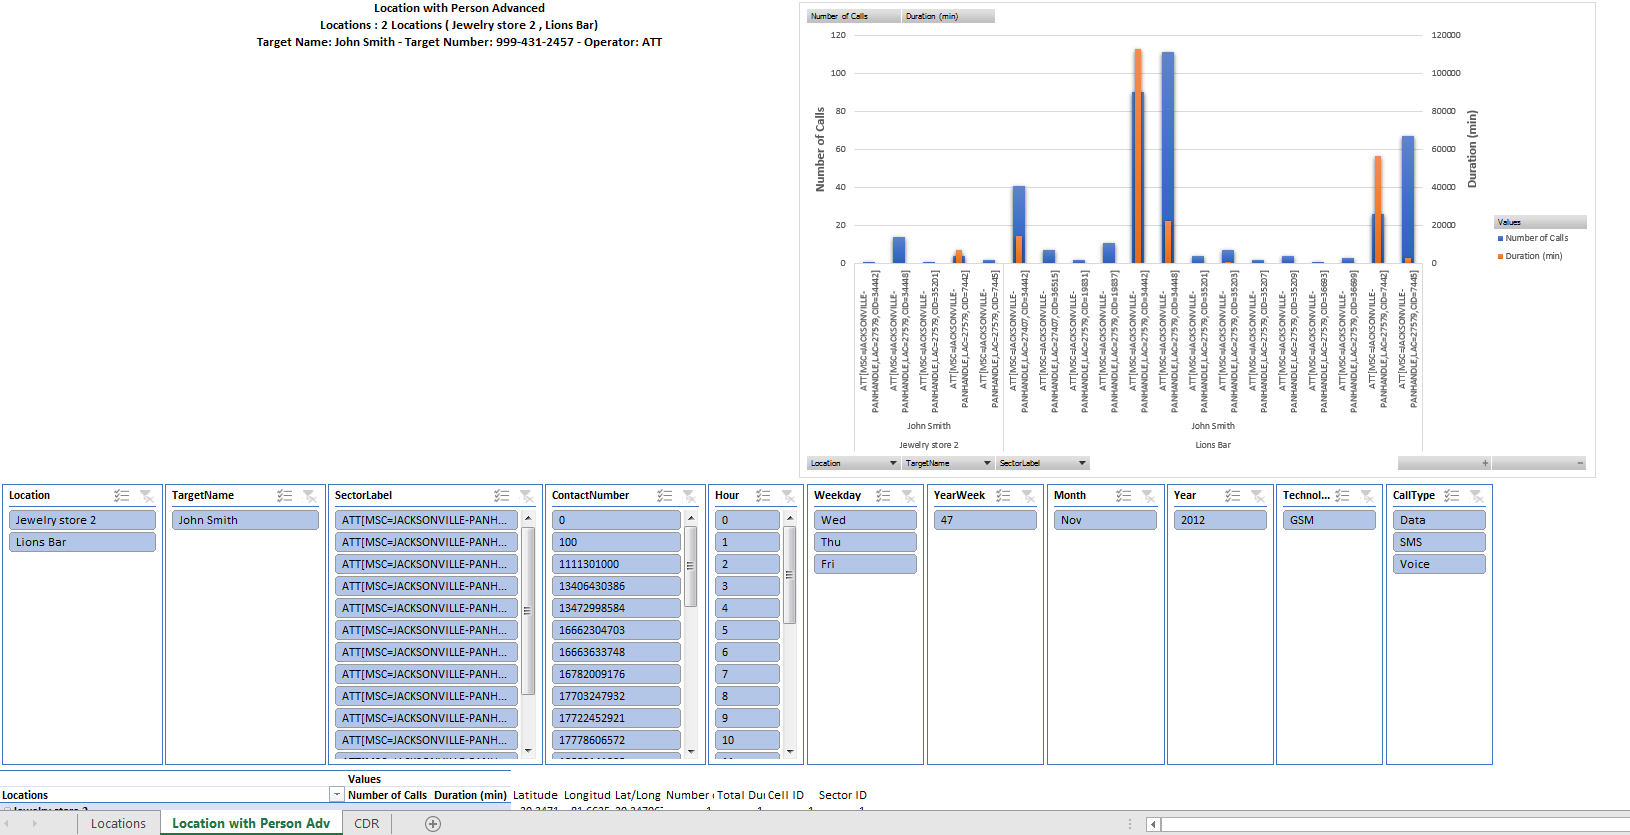
-
The Adv_Location with Persons attachment provides a graphic representation of the location with person's device analysis and allows you to configure filters to display the breakdown of the results to suit your needs.
This section of the IQ packetaids with fugitive apprehension as it helps you identify the most likely locations to find a person based on the uploaded CDR and geo-location data.
For each of the persons you selected to include on the New IQ packet screen this section of the IQ packet displays:
-
An executive summary table listing the people and the likely locations to find them an various days. This table also provides a link to a subsequent section in the IQ packet showing the apprehension (pattern of life) analysis for each phone number which is described in the following bullet.
The following graphic provides an example of this section in an IQ packet report which was output in the Microsoft PowerPoint format.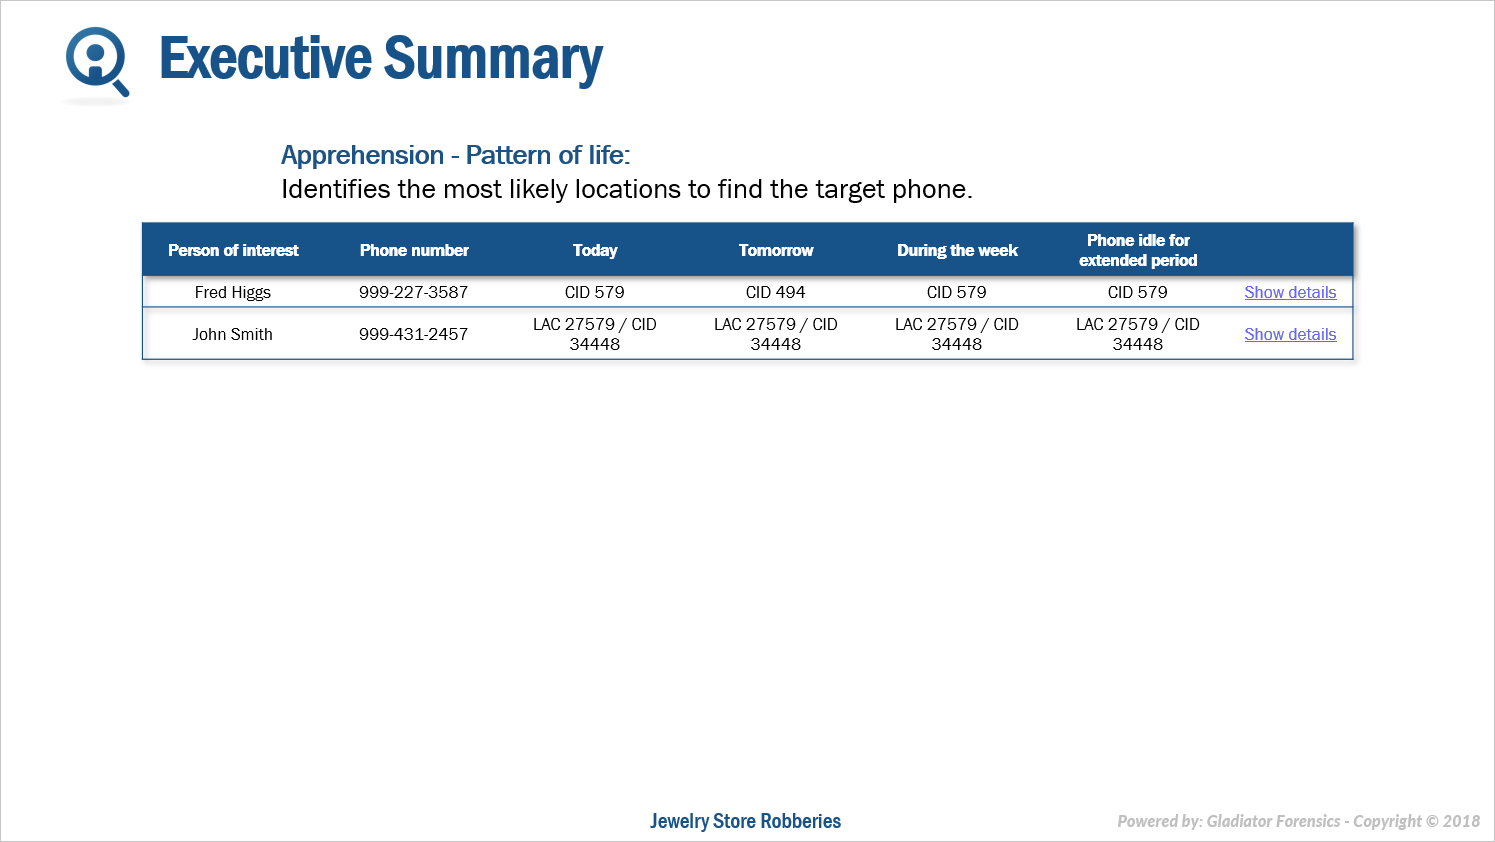
-
An apprehension (pattern of life) analysis for each phone number which contains maps of the location of the cell tower and the cell tower details. There are four maps which provide the analysis results on where you are most likely to find the person: today, tomorrow, and any day of the week or where the person is most likely sleeping or working. A link is provided within the map allowing you to view the location in greater detail on a browser.
The following graphic provides an example of this section in an IQ packet report which was output in the Microsoft PowerPoint format.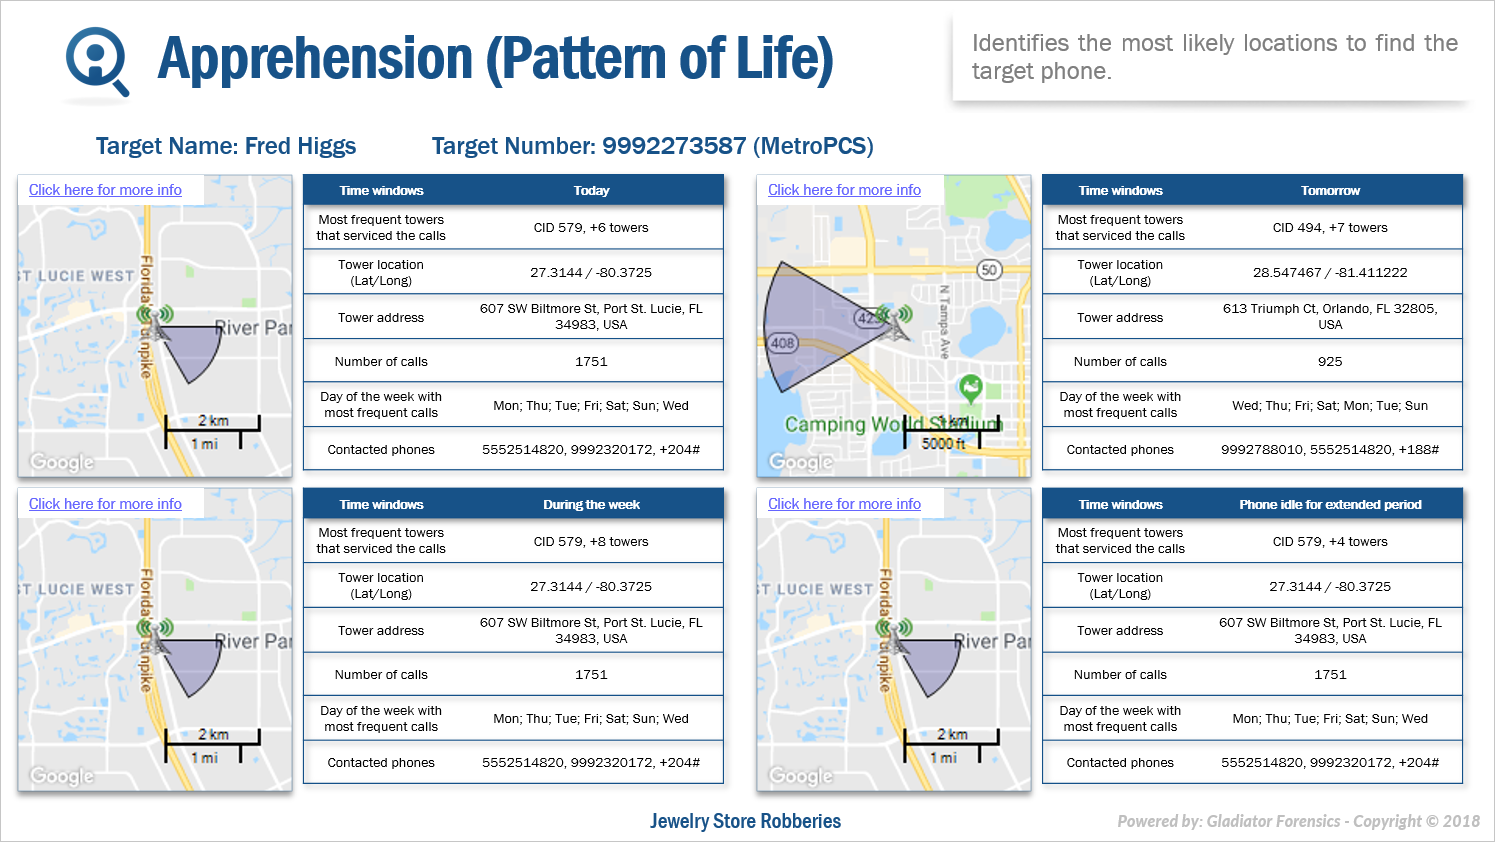
This section of the IQ packetaids with proving or disproving a suspect or suspect's alibi as it helps you identify if the person was near a location during the time of interest using the uploaded CDR and geo-location data.
For each of the persons and locations you selected on the New IQ packet screen this section of the IQ packet displays:
-
An executive summary table listing the people, their phone numbers, and the locations along with their time interval specified in the Event start and Event end times. It details whether or not the phone was in the location during the time the event occurred. The location is defined by the Latitude /Longitude and its surrounding perimeter which is specified by the Location buffer. This table also provides a link to a subsequent section in the IQ packet showing the crime scene/location analysis which is described in the following bullet.
The following graphic provides an example of this section in an IQ packet report which was output in the Microsoft PowerPoint format.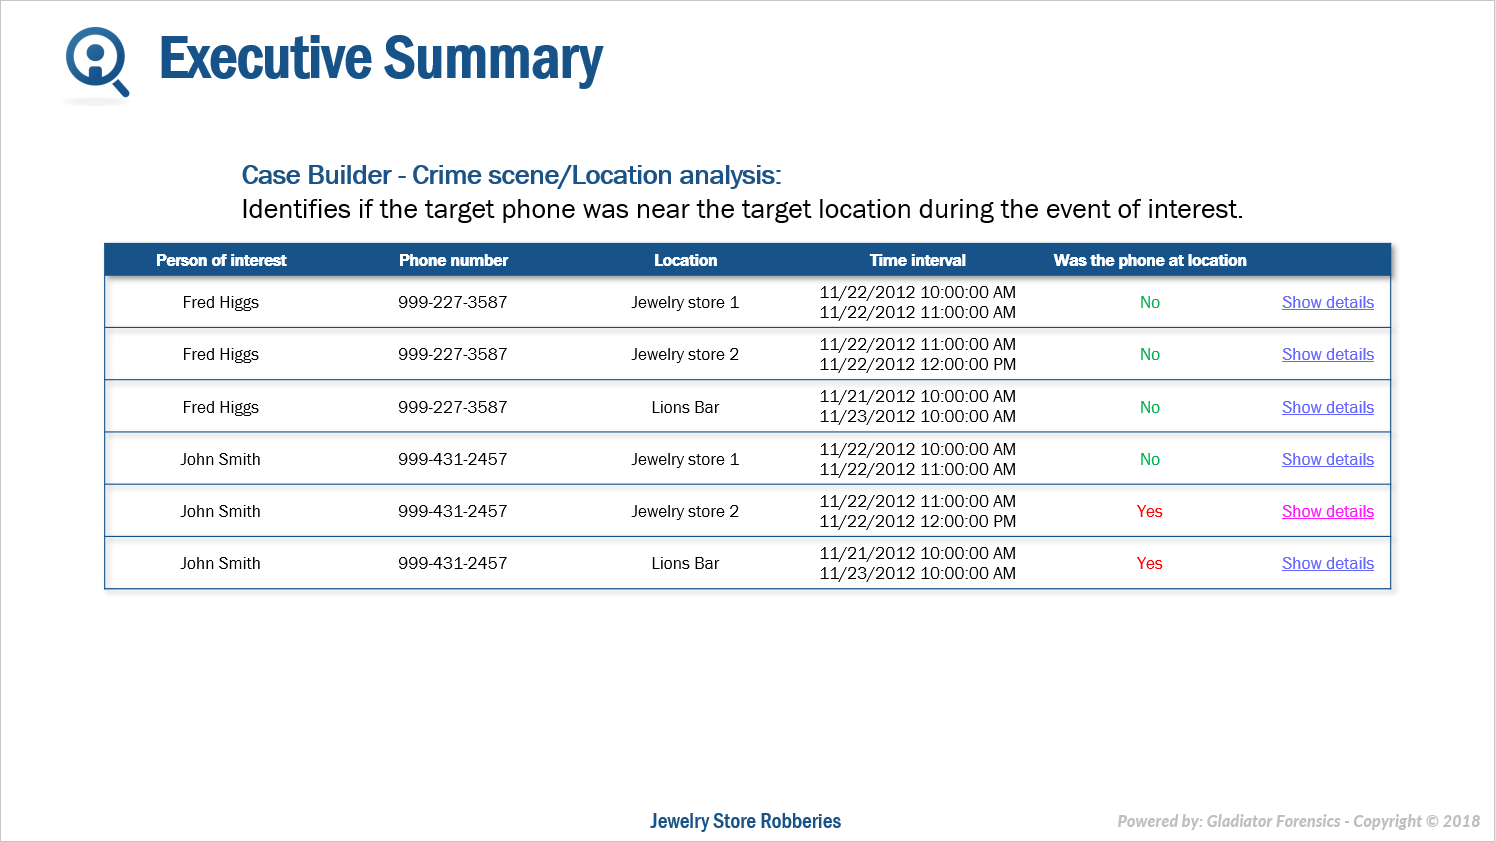
-
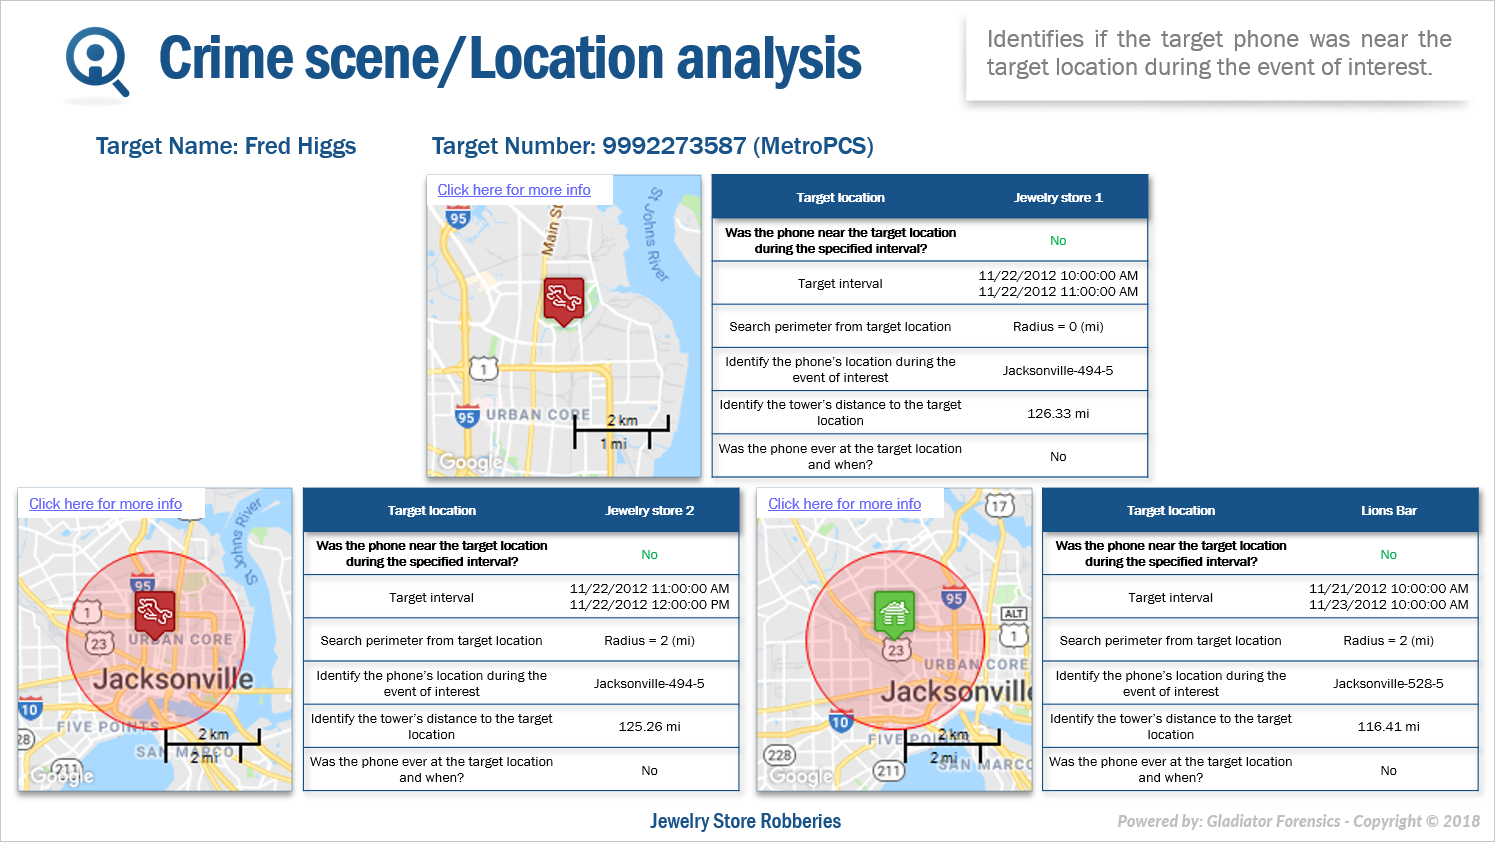
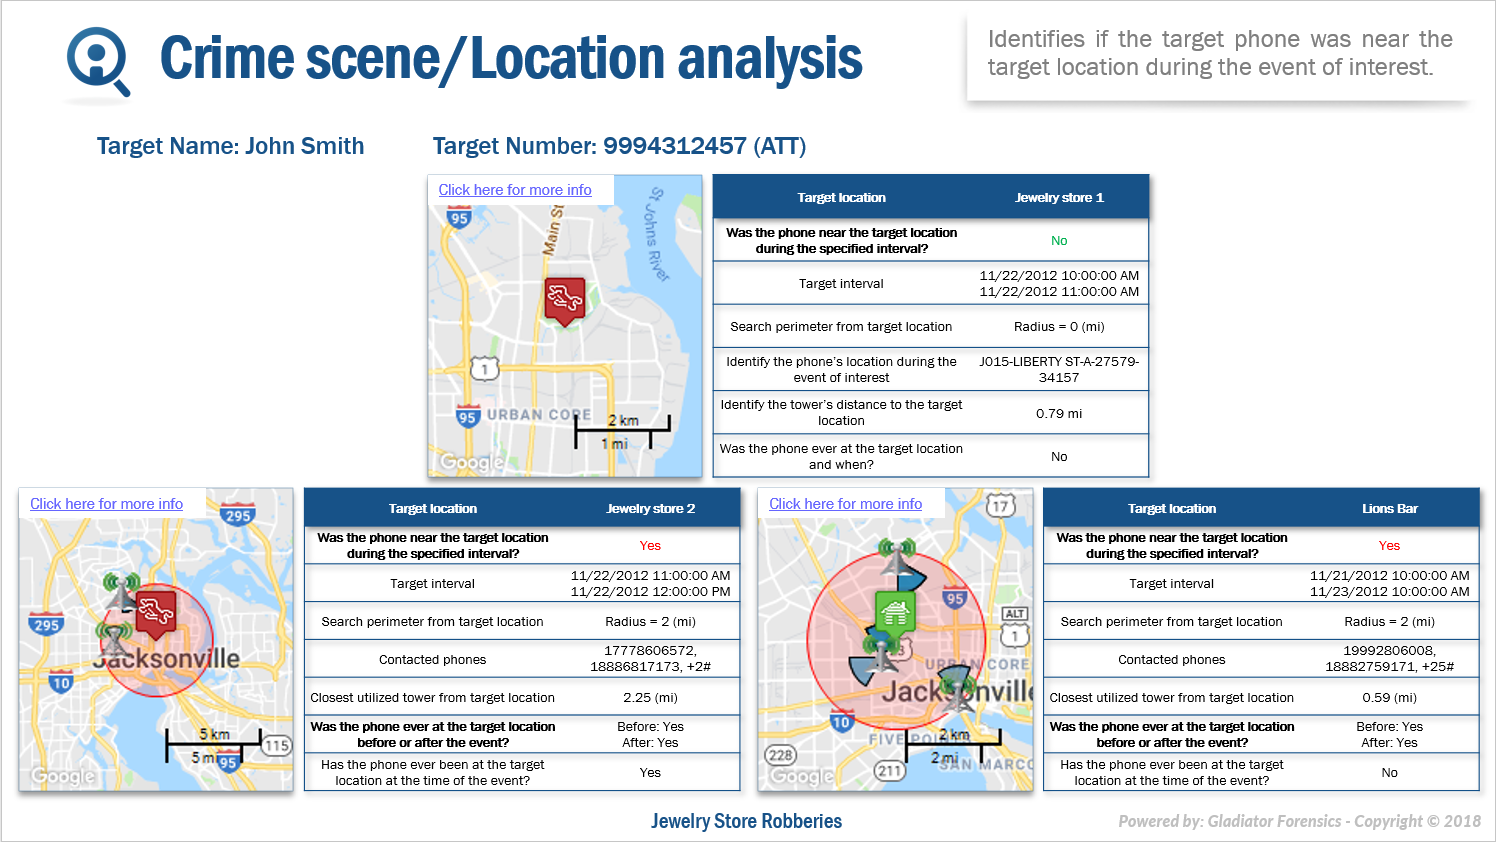
A crime scene/location analysis for each phone number which contains maps of the location and provides information on the location of the phone relative to the location at the time of the event. It also provides information on whether the phone was ever at that location, and if it was then it lists when it was. A link is provided within the map allowing you to view the location in greater detail on a browser.
The following graphics provide examples of this section in an IQ packet which was output in the Microsoft PowerPoint format.
-
This graphic shows that the device was over 100 miles away at the time of the event, and at no time was it at any of the locations.
-
This graphic shows that John Smith was at two locations, Jewelry store 2 and Lions Bar, during the time of the event specified using Event start and Event end. It also shows that for Jewelry store 2 he has been there at the same time on at least one previous day.
-
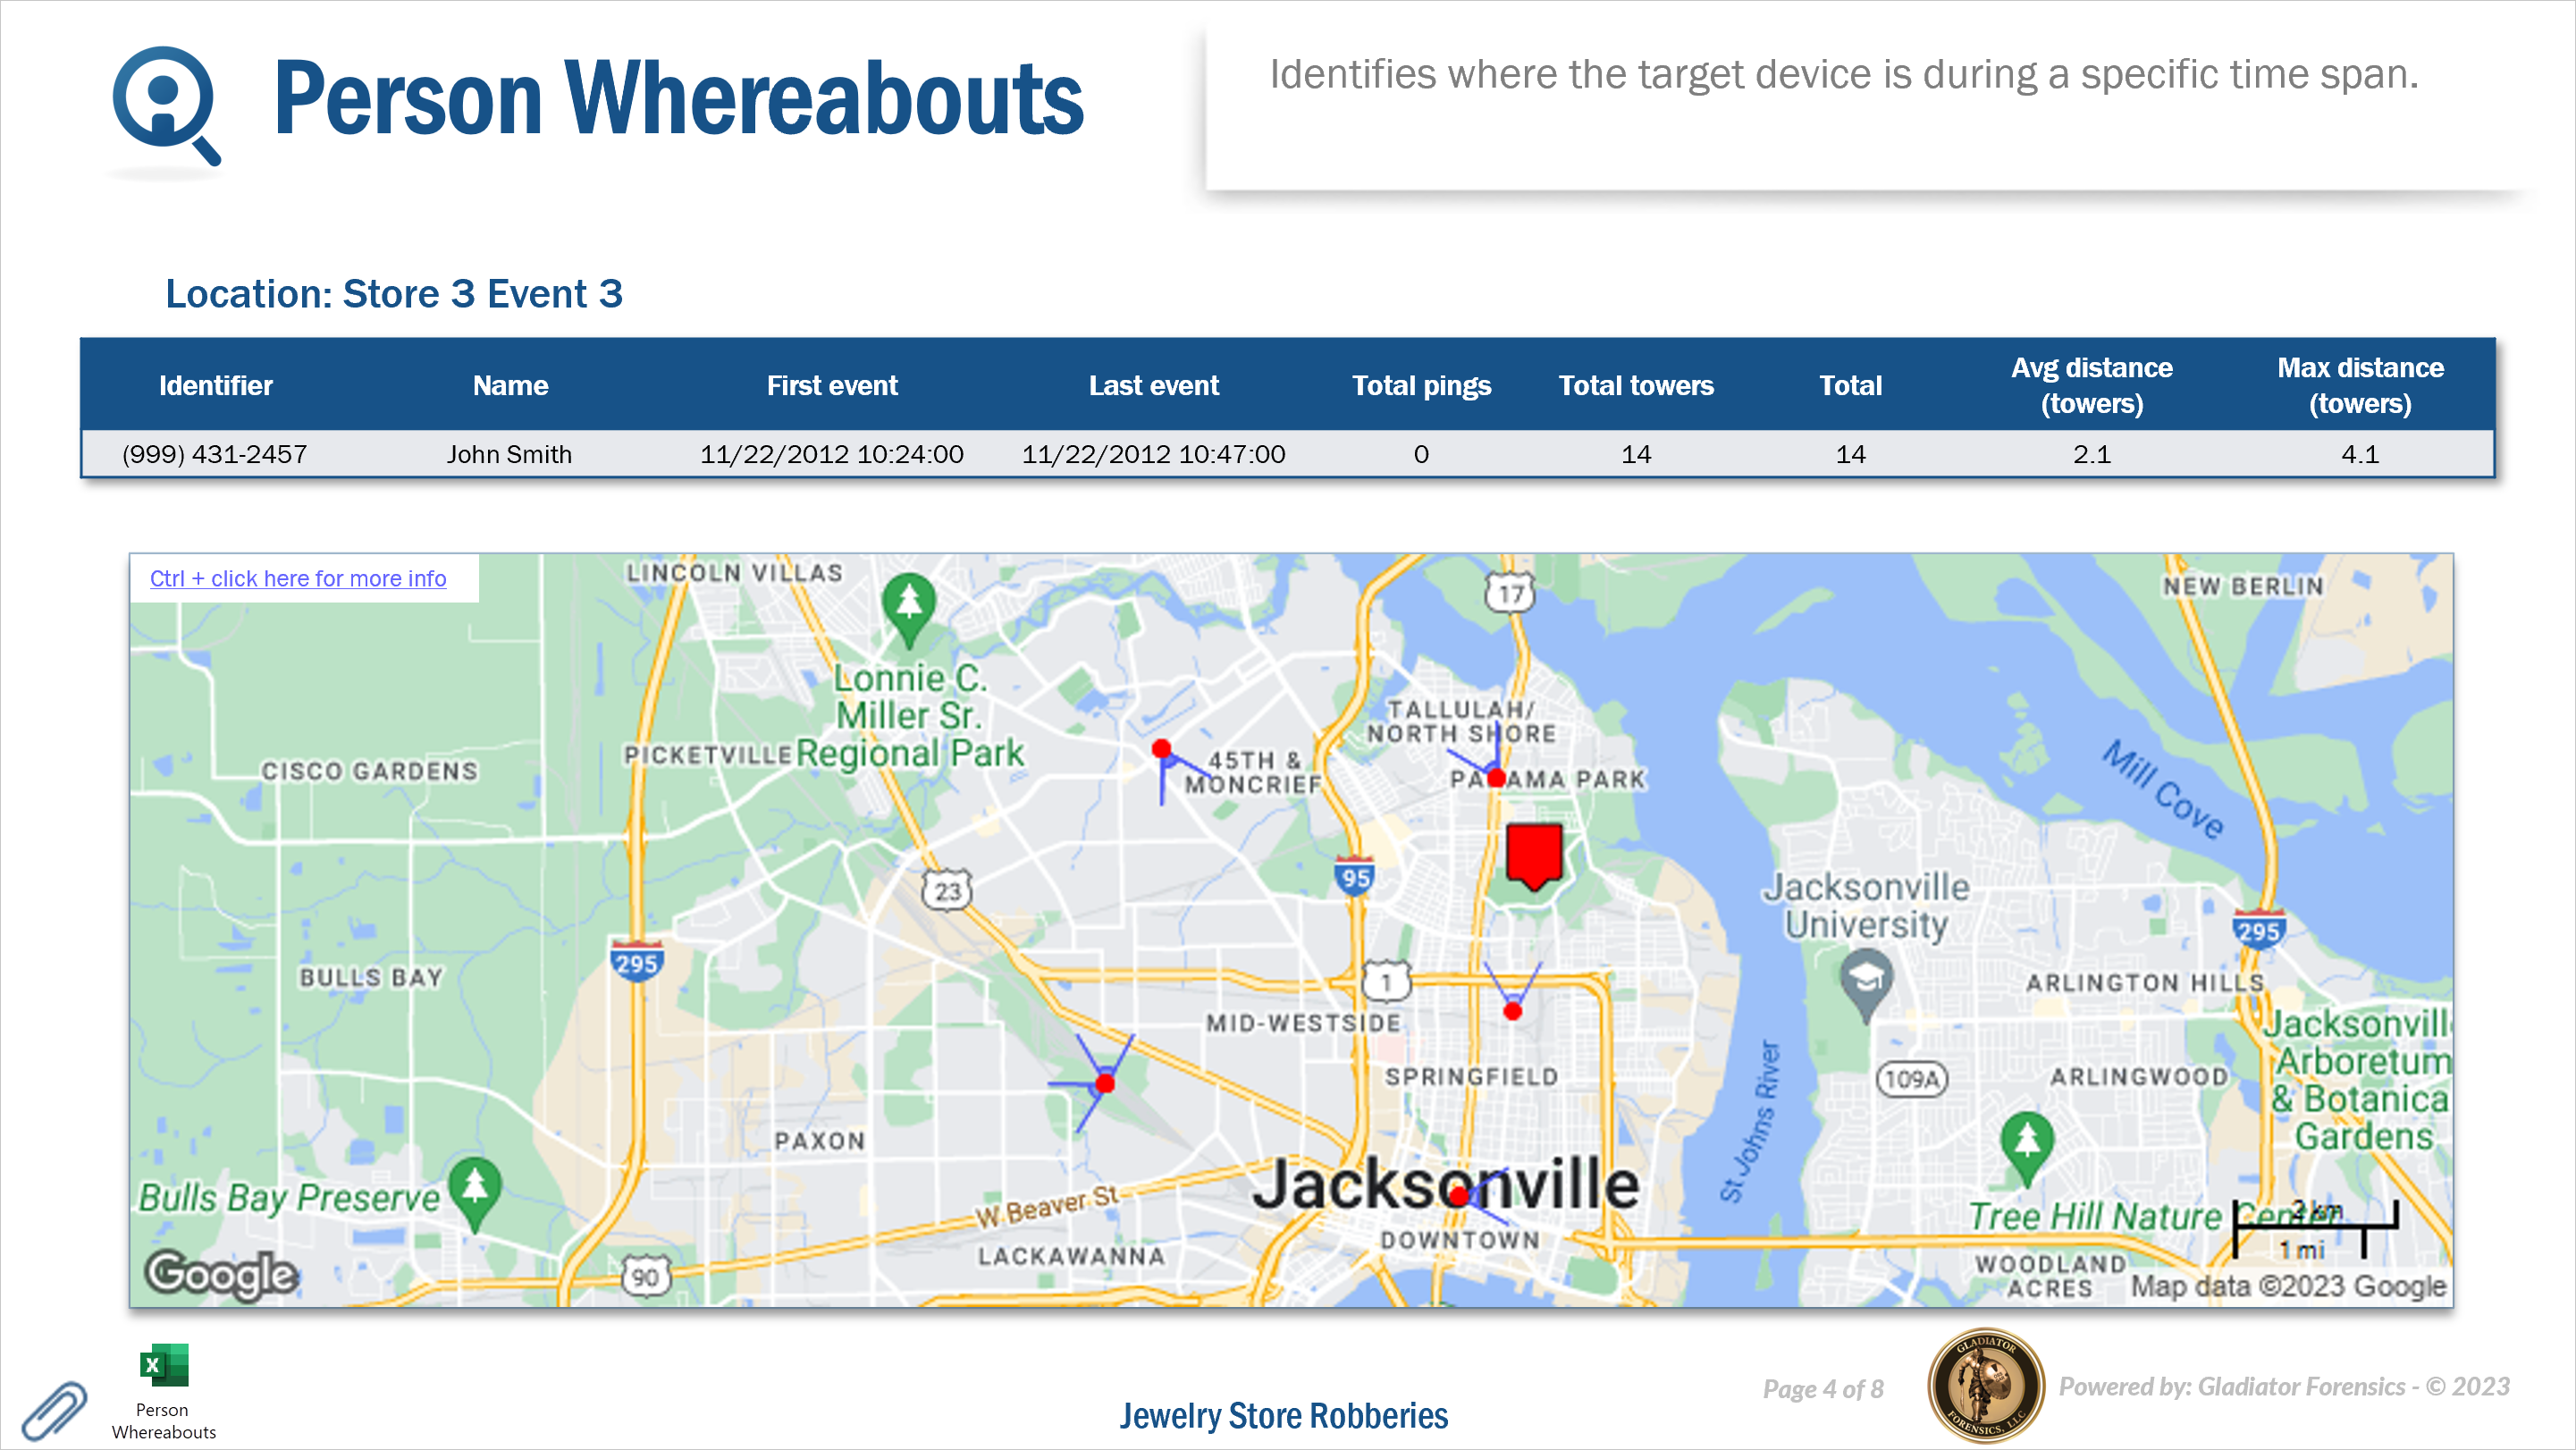
This section of the IQ packet identifies where the device was during the events on the Event timeline. The analysis uses both GPS ping and CDR data.
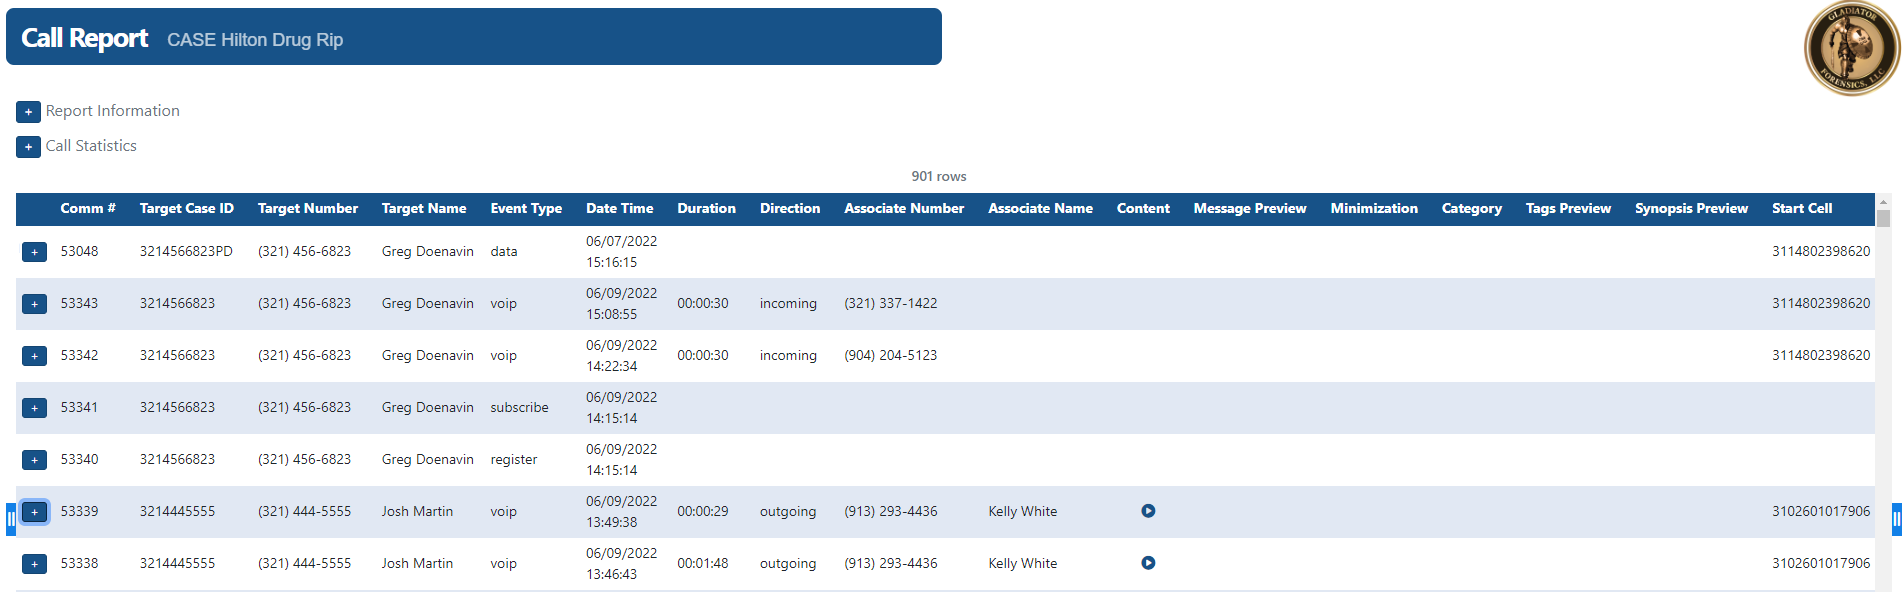
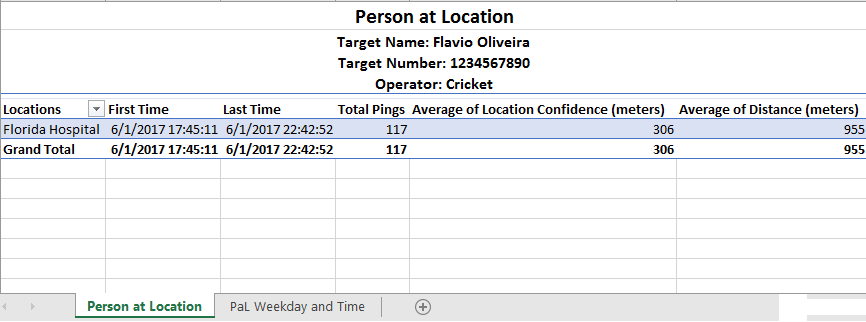
For each event, a table displays the identifier, person name, the time of the first and last events during the event's time period, the total GPS pings, the total number of towers used, and the average and maximum distance the person moved during the event based on the towers used. A map displays the target location, used towers and GPS pings.
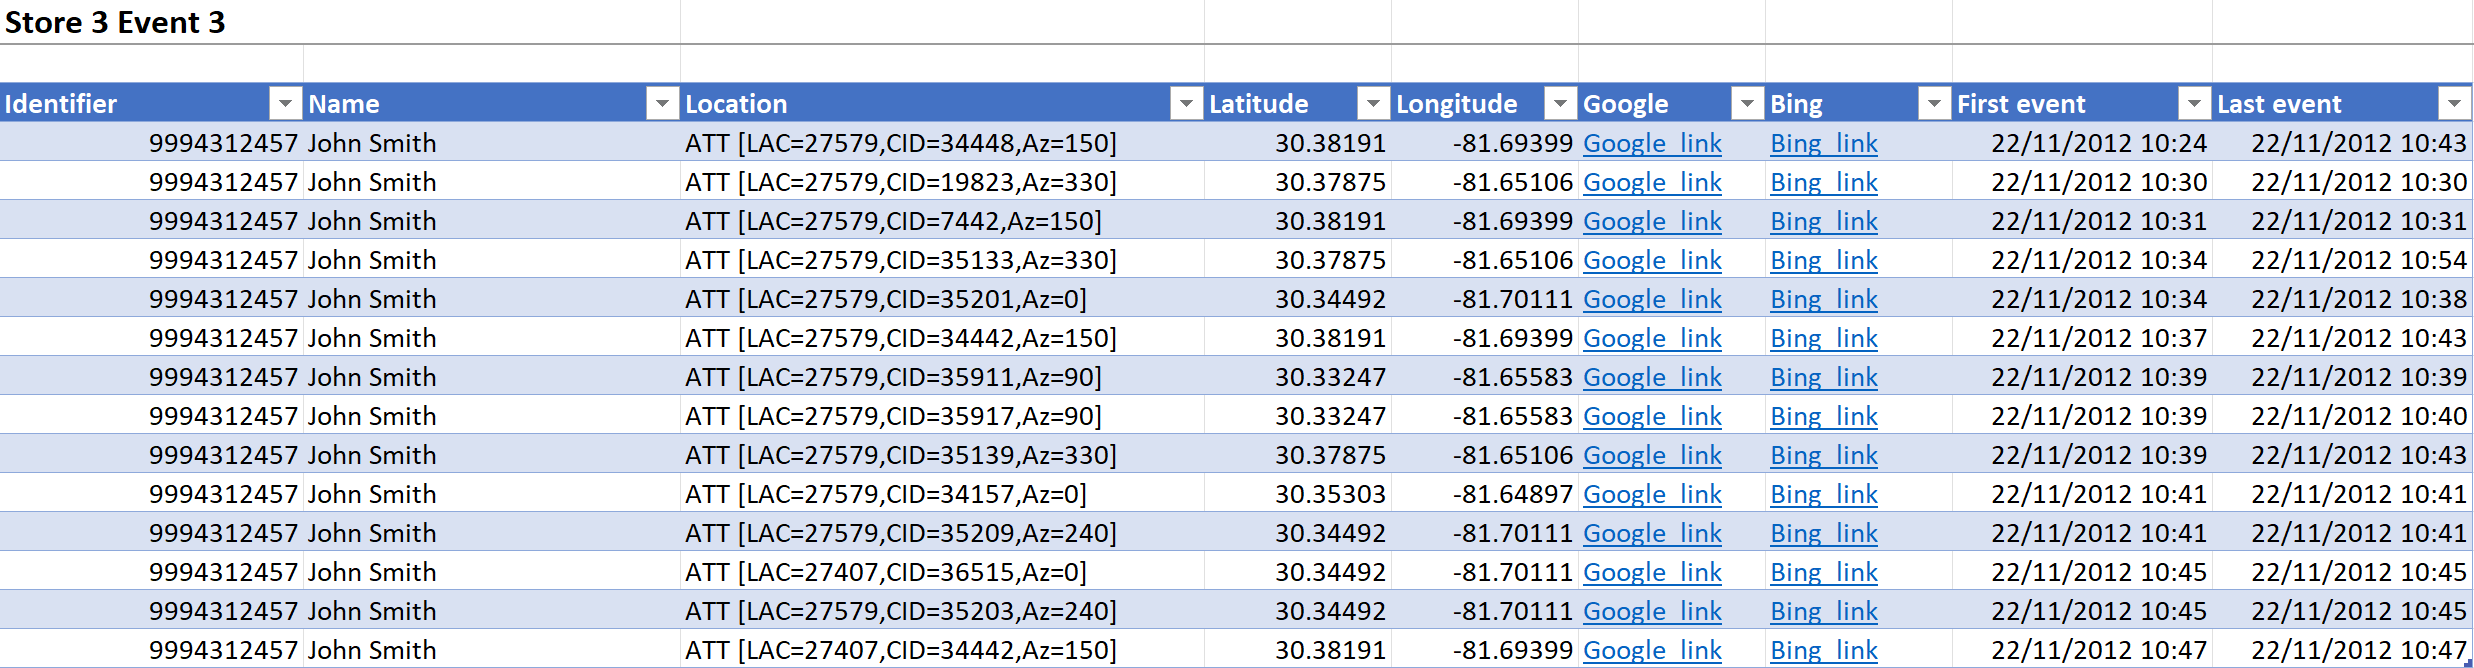
If you selected "Microsoft Excel" as an Output then this IQ packet section also provides a Microsoft Excel attachment which includes details for the individual events. The following graphic provides an example of the Microsoft Excel attachment.
This section of the IQ packet is designed to help you identify which devices were at which locations during the time of interest based on both the CDR and geo-location data.
You can configure settings associated with this analysis using Person's Device at Location.
For each of the people and locations you selected to include on the New IQ packet screen this section of the IQ packet displays the people that were identified as being at any of the locations. The analysis only includes analysis locations which are those that have a Location buffer, Event start and Event end time defined on the Locations of interest screen (Case management).
This section of the IQ packet displays for each person at a location:
-
a map displaying the sectors used at the location. The location is defined by the Latitude /Longitude and its surrounding perimeter which is specified by the Location buffer. A link is provided within the map allowing you to view the map in greater detail on a browser along with the calls made by the person while in the location. There are also tables detailing the location information and the sector information.
The following graphic provides an example of this section in an IQ packet report which was output in the Microsoft PowerPoint format.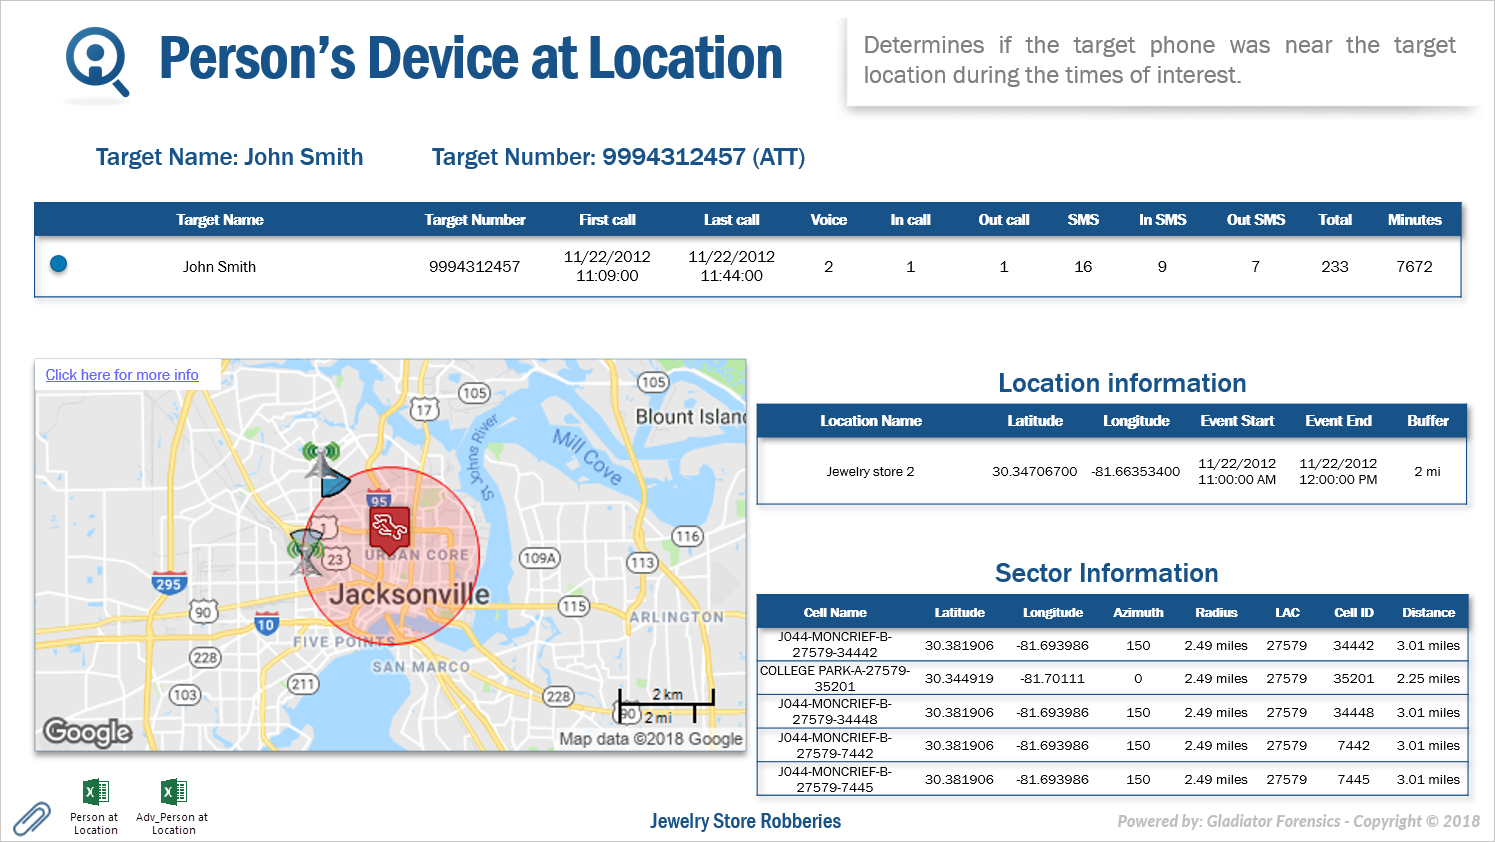
-
tables detailing all the calls made or received by the person at each location during the event time.
The following graphic provides an example of this section in an IQ packet report which was output in the Microsoft PowerPoint format.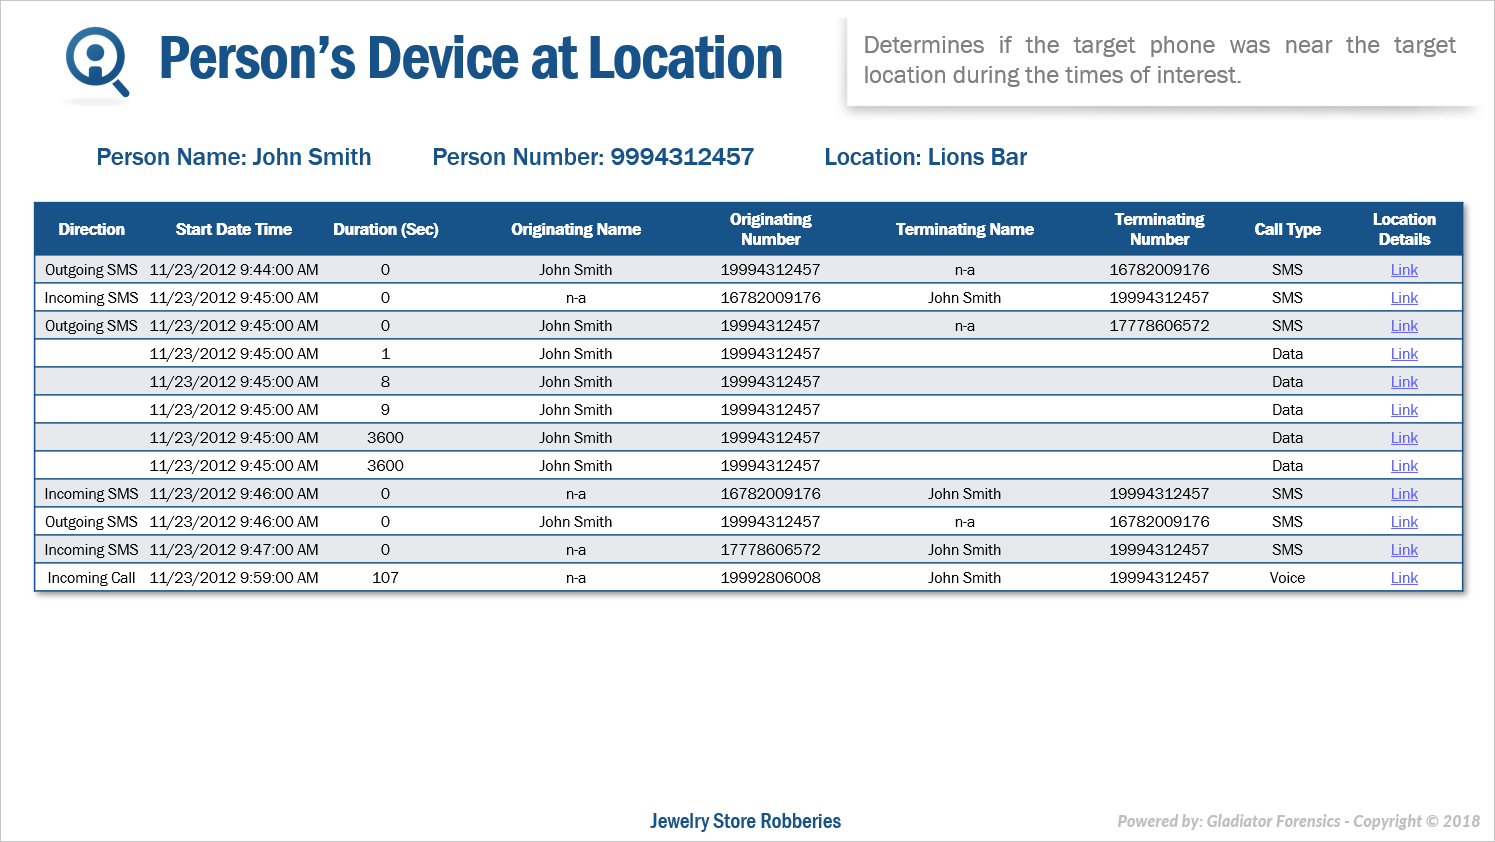
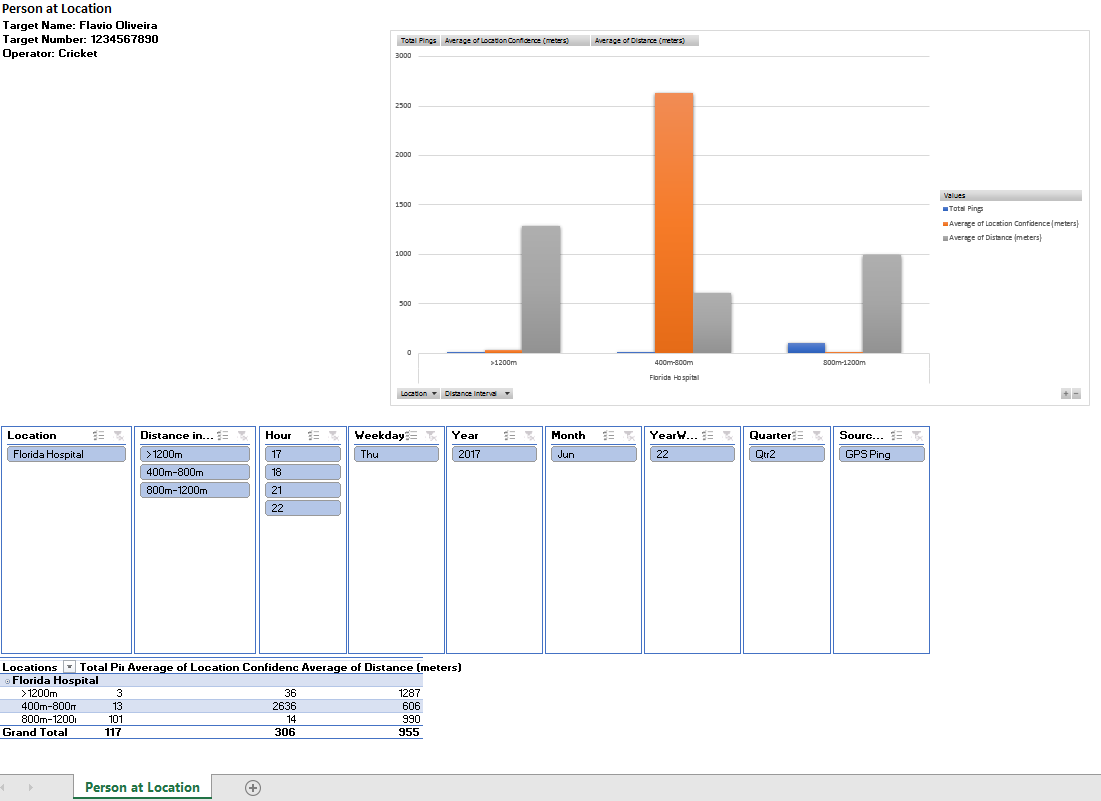
If you selected "Microsoft Excel" as an Output then this IQ packet section also provides two Microsoft Excel attachments that allow you to analyze this data further if required. The following graphic provides an example of the Microsoft Excel attachment.
-
The Person at location attachment provides a list of all the locations the person was at along with the call data.
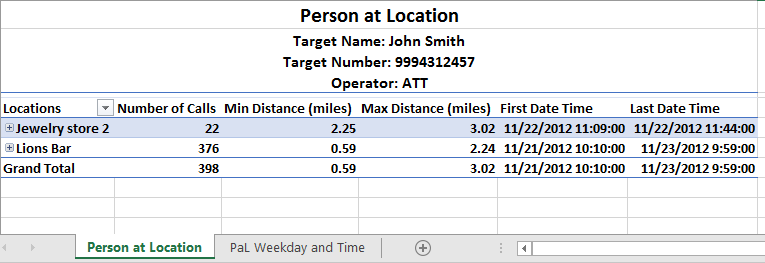
-
The Adv_Person at location attachment provides a graphic representation of the person's device at locations analysis and allows you to configure filters to display the breakdown of the results to suit your needs.
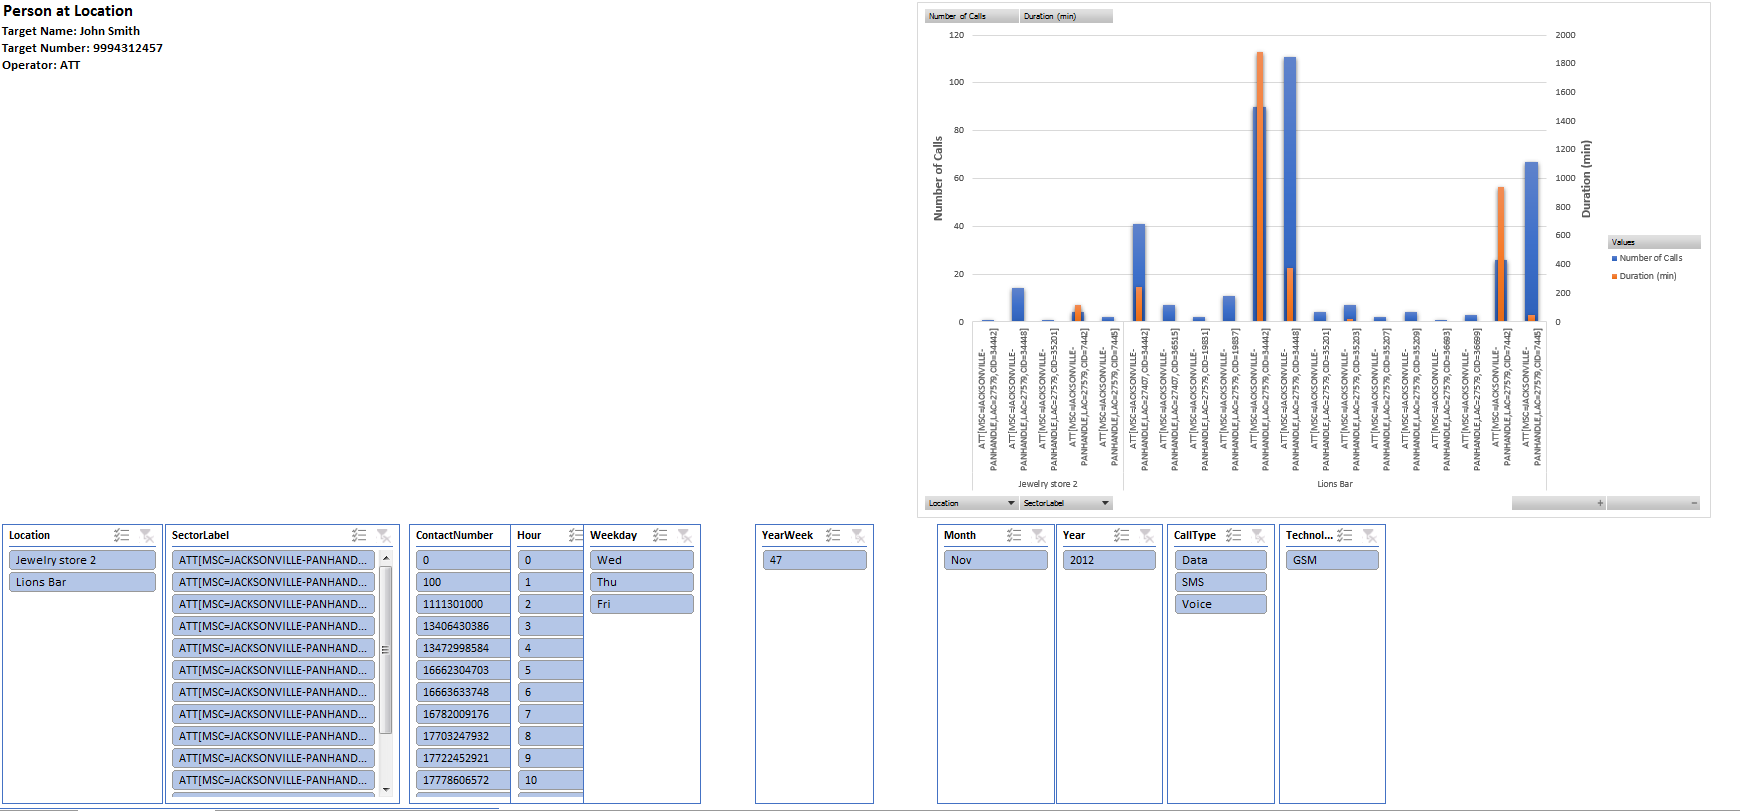
-
The Person at GeoLocation attachment provides a list of all the locations the person was at along with the geo-location data.
-
The Adv_Person at Geolocation attachment provides a graphic representation of the person's device at locations analysis and allows you to configure filters to display the breakdown of the results to suit your needs.
For each of the persons you selected to include on the New IQ packet screen this section of the IQ packet displays each person and their associated phone numbers. It also details: their Person type, their default photo which was uploaded and set to the default using the Pictures tab of the People and devices of interest screen, and the first and last date of the events found in the files that you have uploaded to that person. There is also a list of the type and number of files that have been uploaded to each person, along with a link and password which allows you to download the associated files.
The following graphic provides an example of this section in an IQ packet report which was output in the Microsoft PowerPoint format.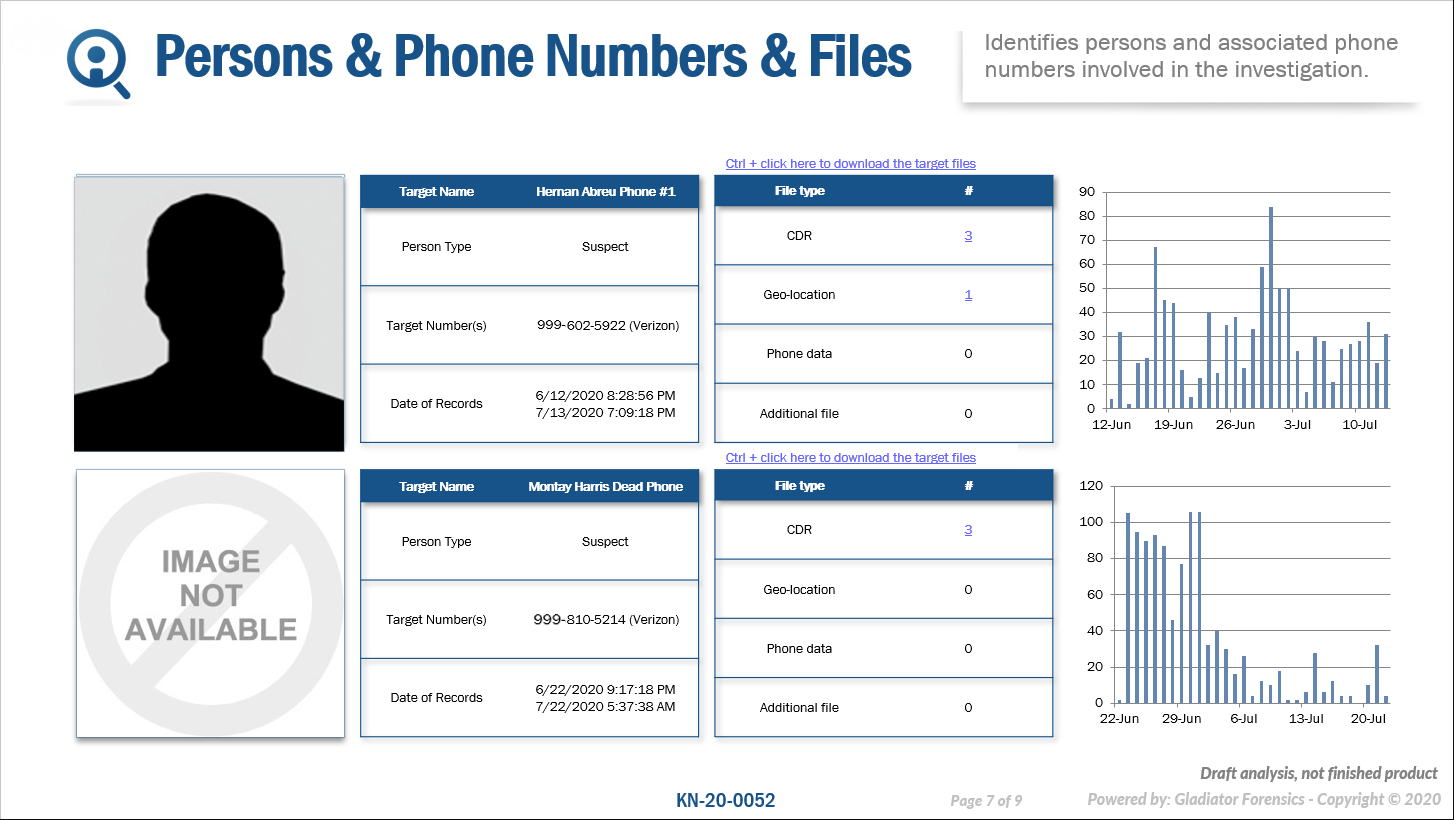
For each of the persons you selected to include on the New IQ packet screen this section of the IQ packet displays each person and their associated phone numbers. It also details: their Person type, their default photo which was uploaded and set to the default using the Pictures tab of the People and devices of interest screen, and the first and last date of the events found in the files that you have uploaded to that person.
The following graphic provides an example of this section in an IQ packet report which was output in the Microsoft PowerPoint format.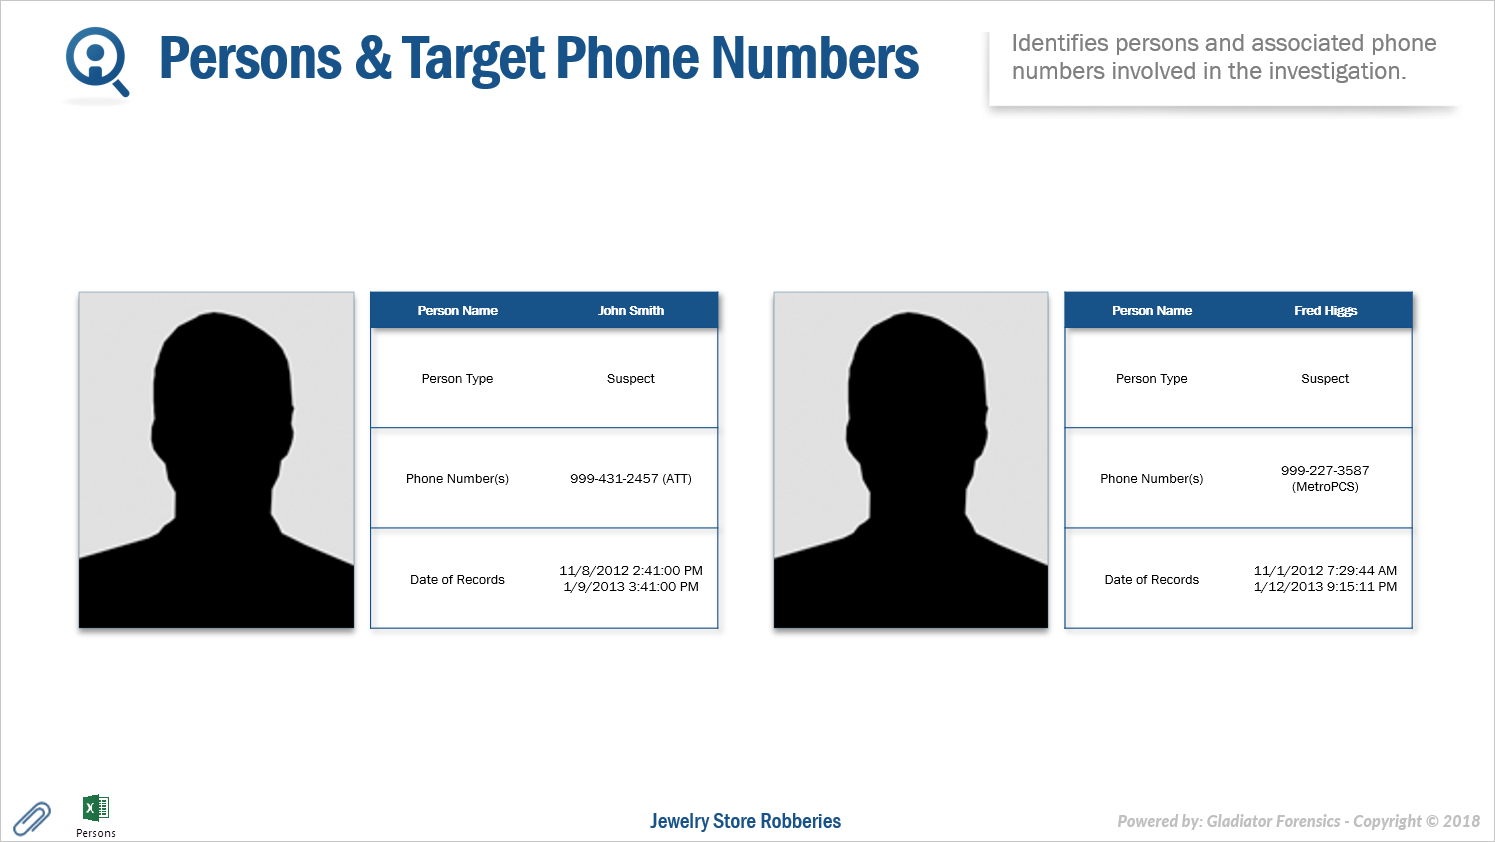
For each of the phone numbers you selected to include on the New IQ packet screen this section of the IQ packet displays a summary of the phone number including: the operator, who the phone belongs to and the start and end dates from the content of the CDR file uploaded for the phone.
The following graphic provides an example of this section in an IQ packet report which was output in the Microsoft PowerPoint format.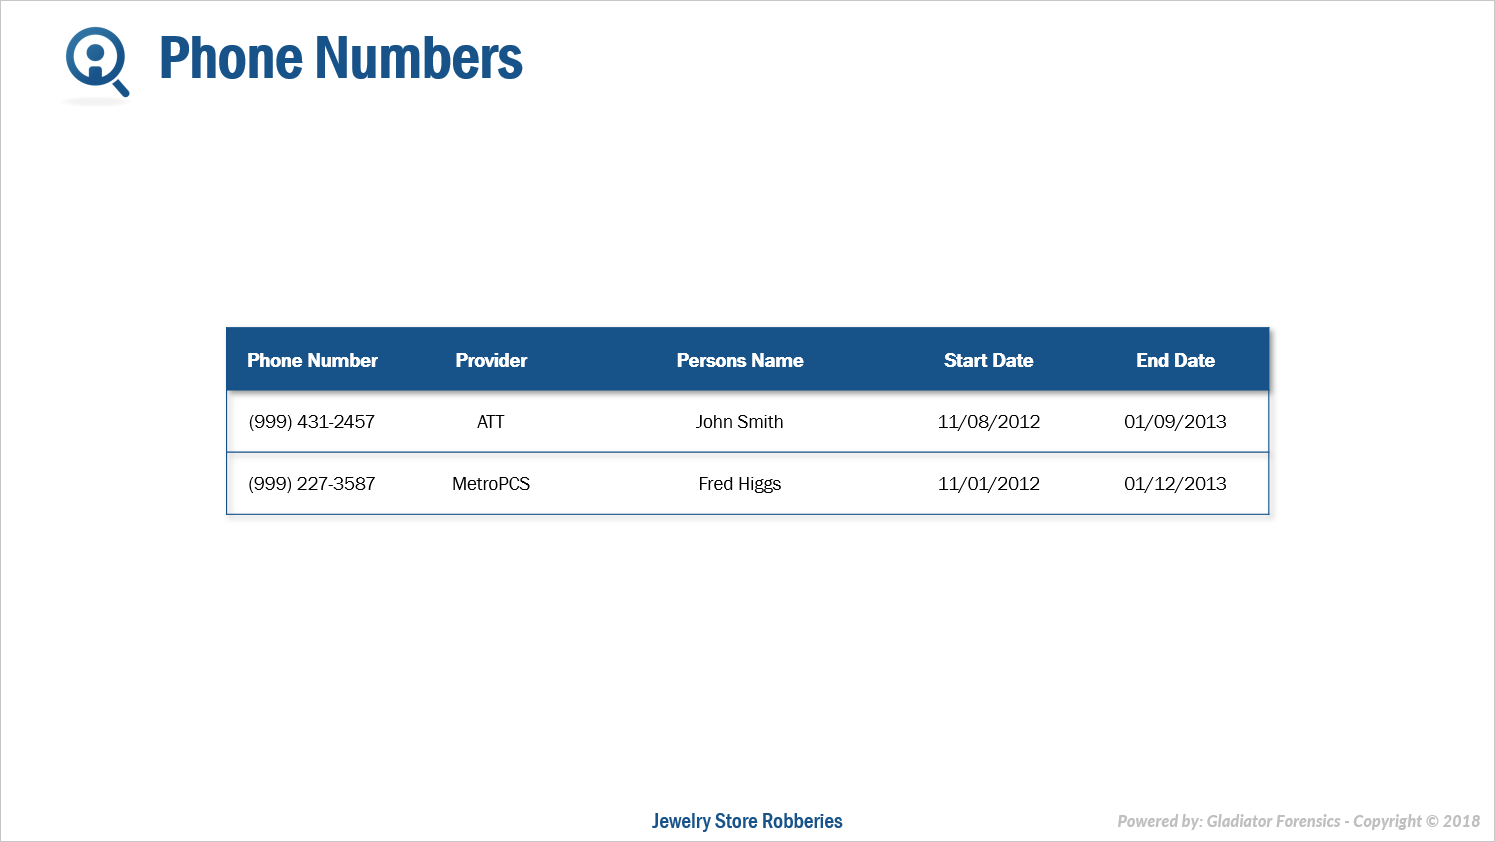
This section of the IQ packet is designed to help you identify where a person may be located on a specific weekday and time.
You can configure settings associated with this analysis using Sector by Hour.
For each of the people you selected to include on the New IQ packet screen this section of the IQ packet displays by default the top ten most frequently used sectors, displaying for each sector a break down of the number of calls by the hour from 00 (00:00 - 00:59) through 23 (23:00 - 23:59) and by the day.
The following graphic provides an example of this section in an IQ packet report which was output in the Microsoft PowerPoint format.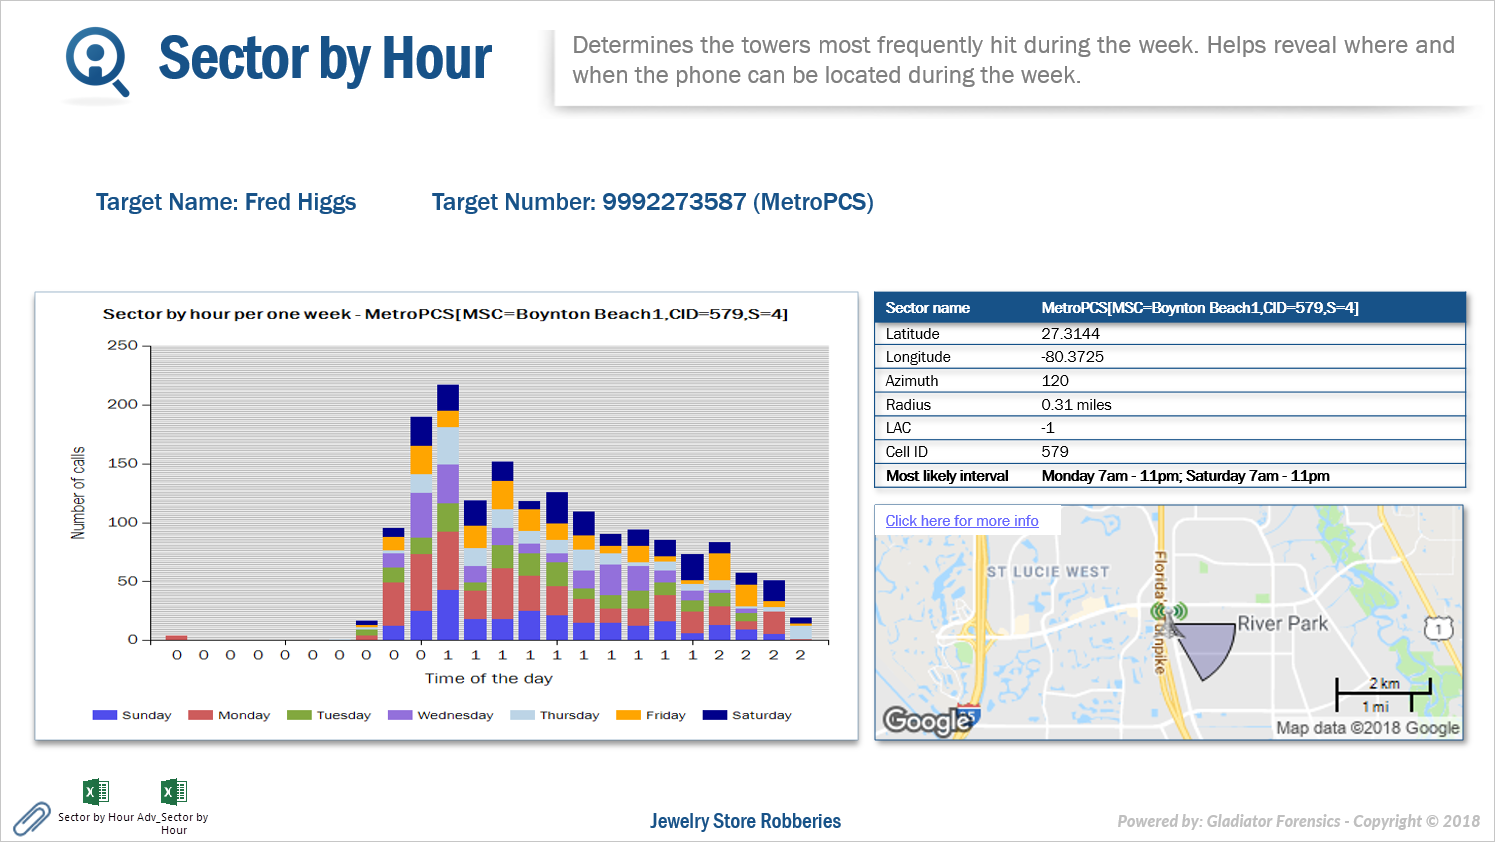
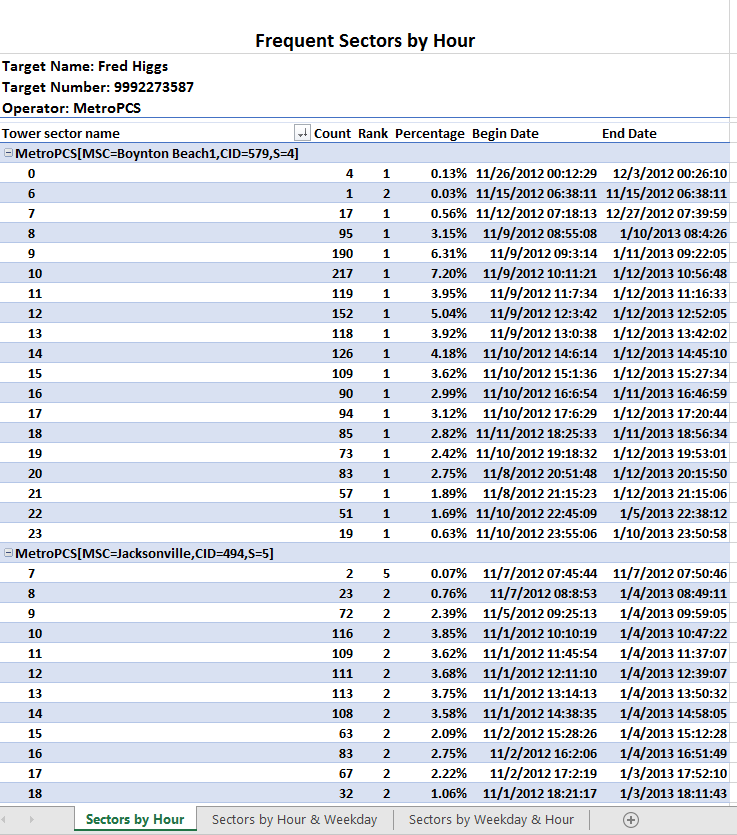
If you selected "Microsoft Excel" as an Output then this IQ packet section also provides two Microsoft Excel attachments that allow you to analyze this data further if required. The following graphic provides an example of the Microsoft Excel attachment.
The Sector by hour attachment provides a list of all the sectors by hour, by hour and weekday and by weekday and hour.
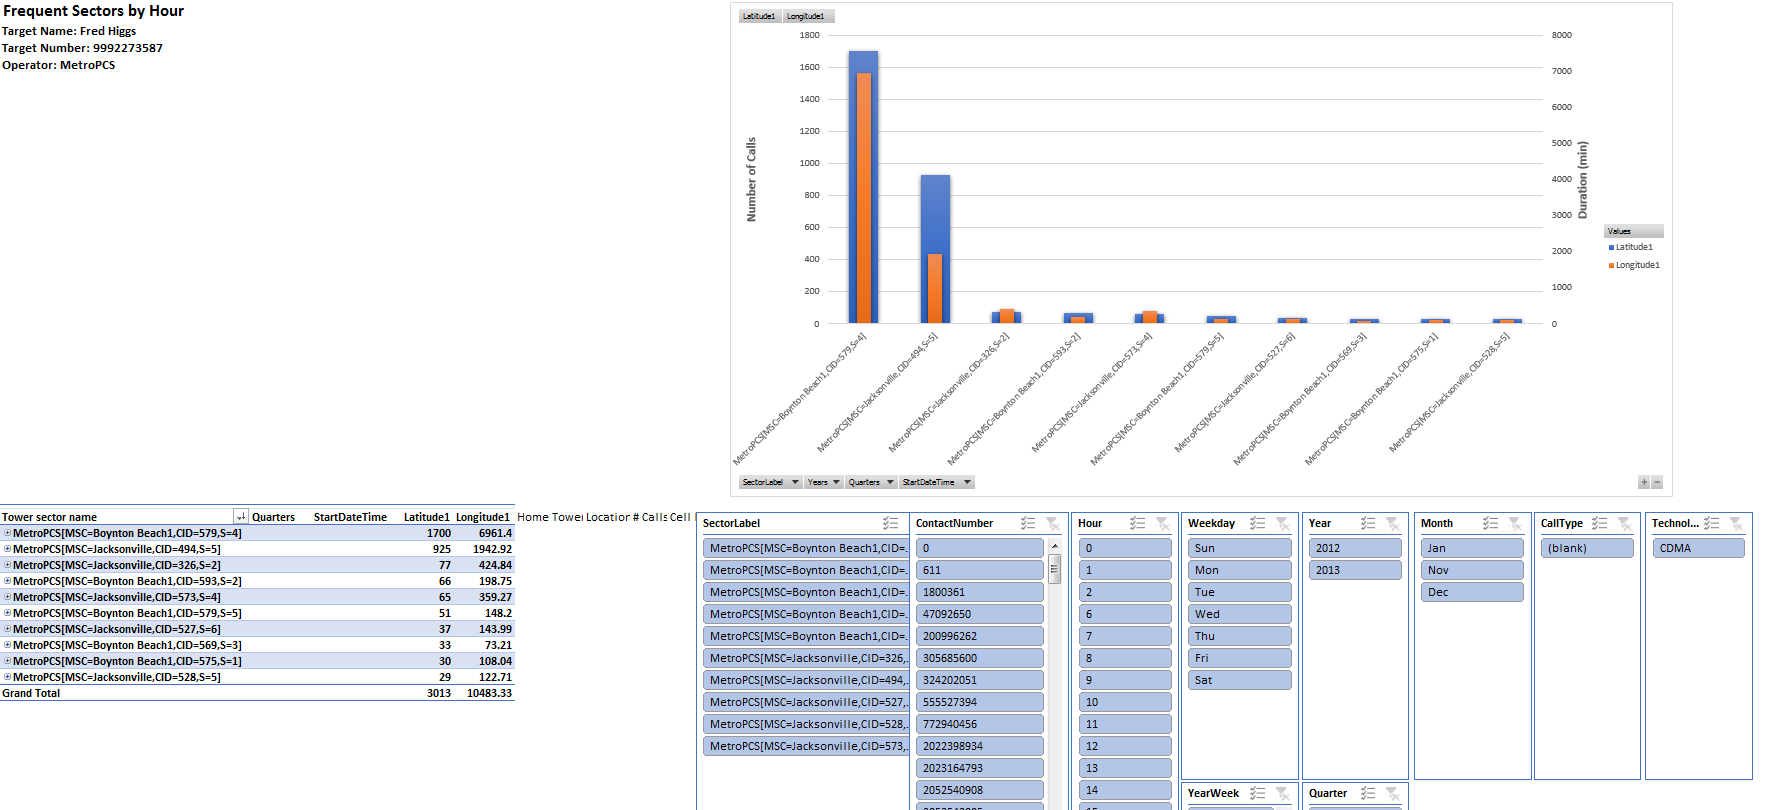
The Adv_Sector by hour attachment provides a graphic representation of the sector by hour analysis and allows you to configure filters to display the breakdown of the results to suit your needs.
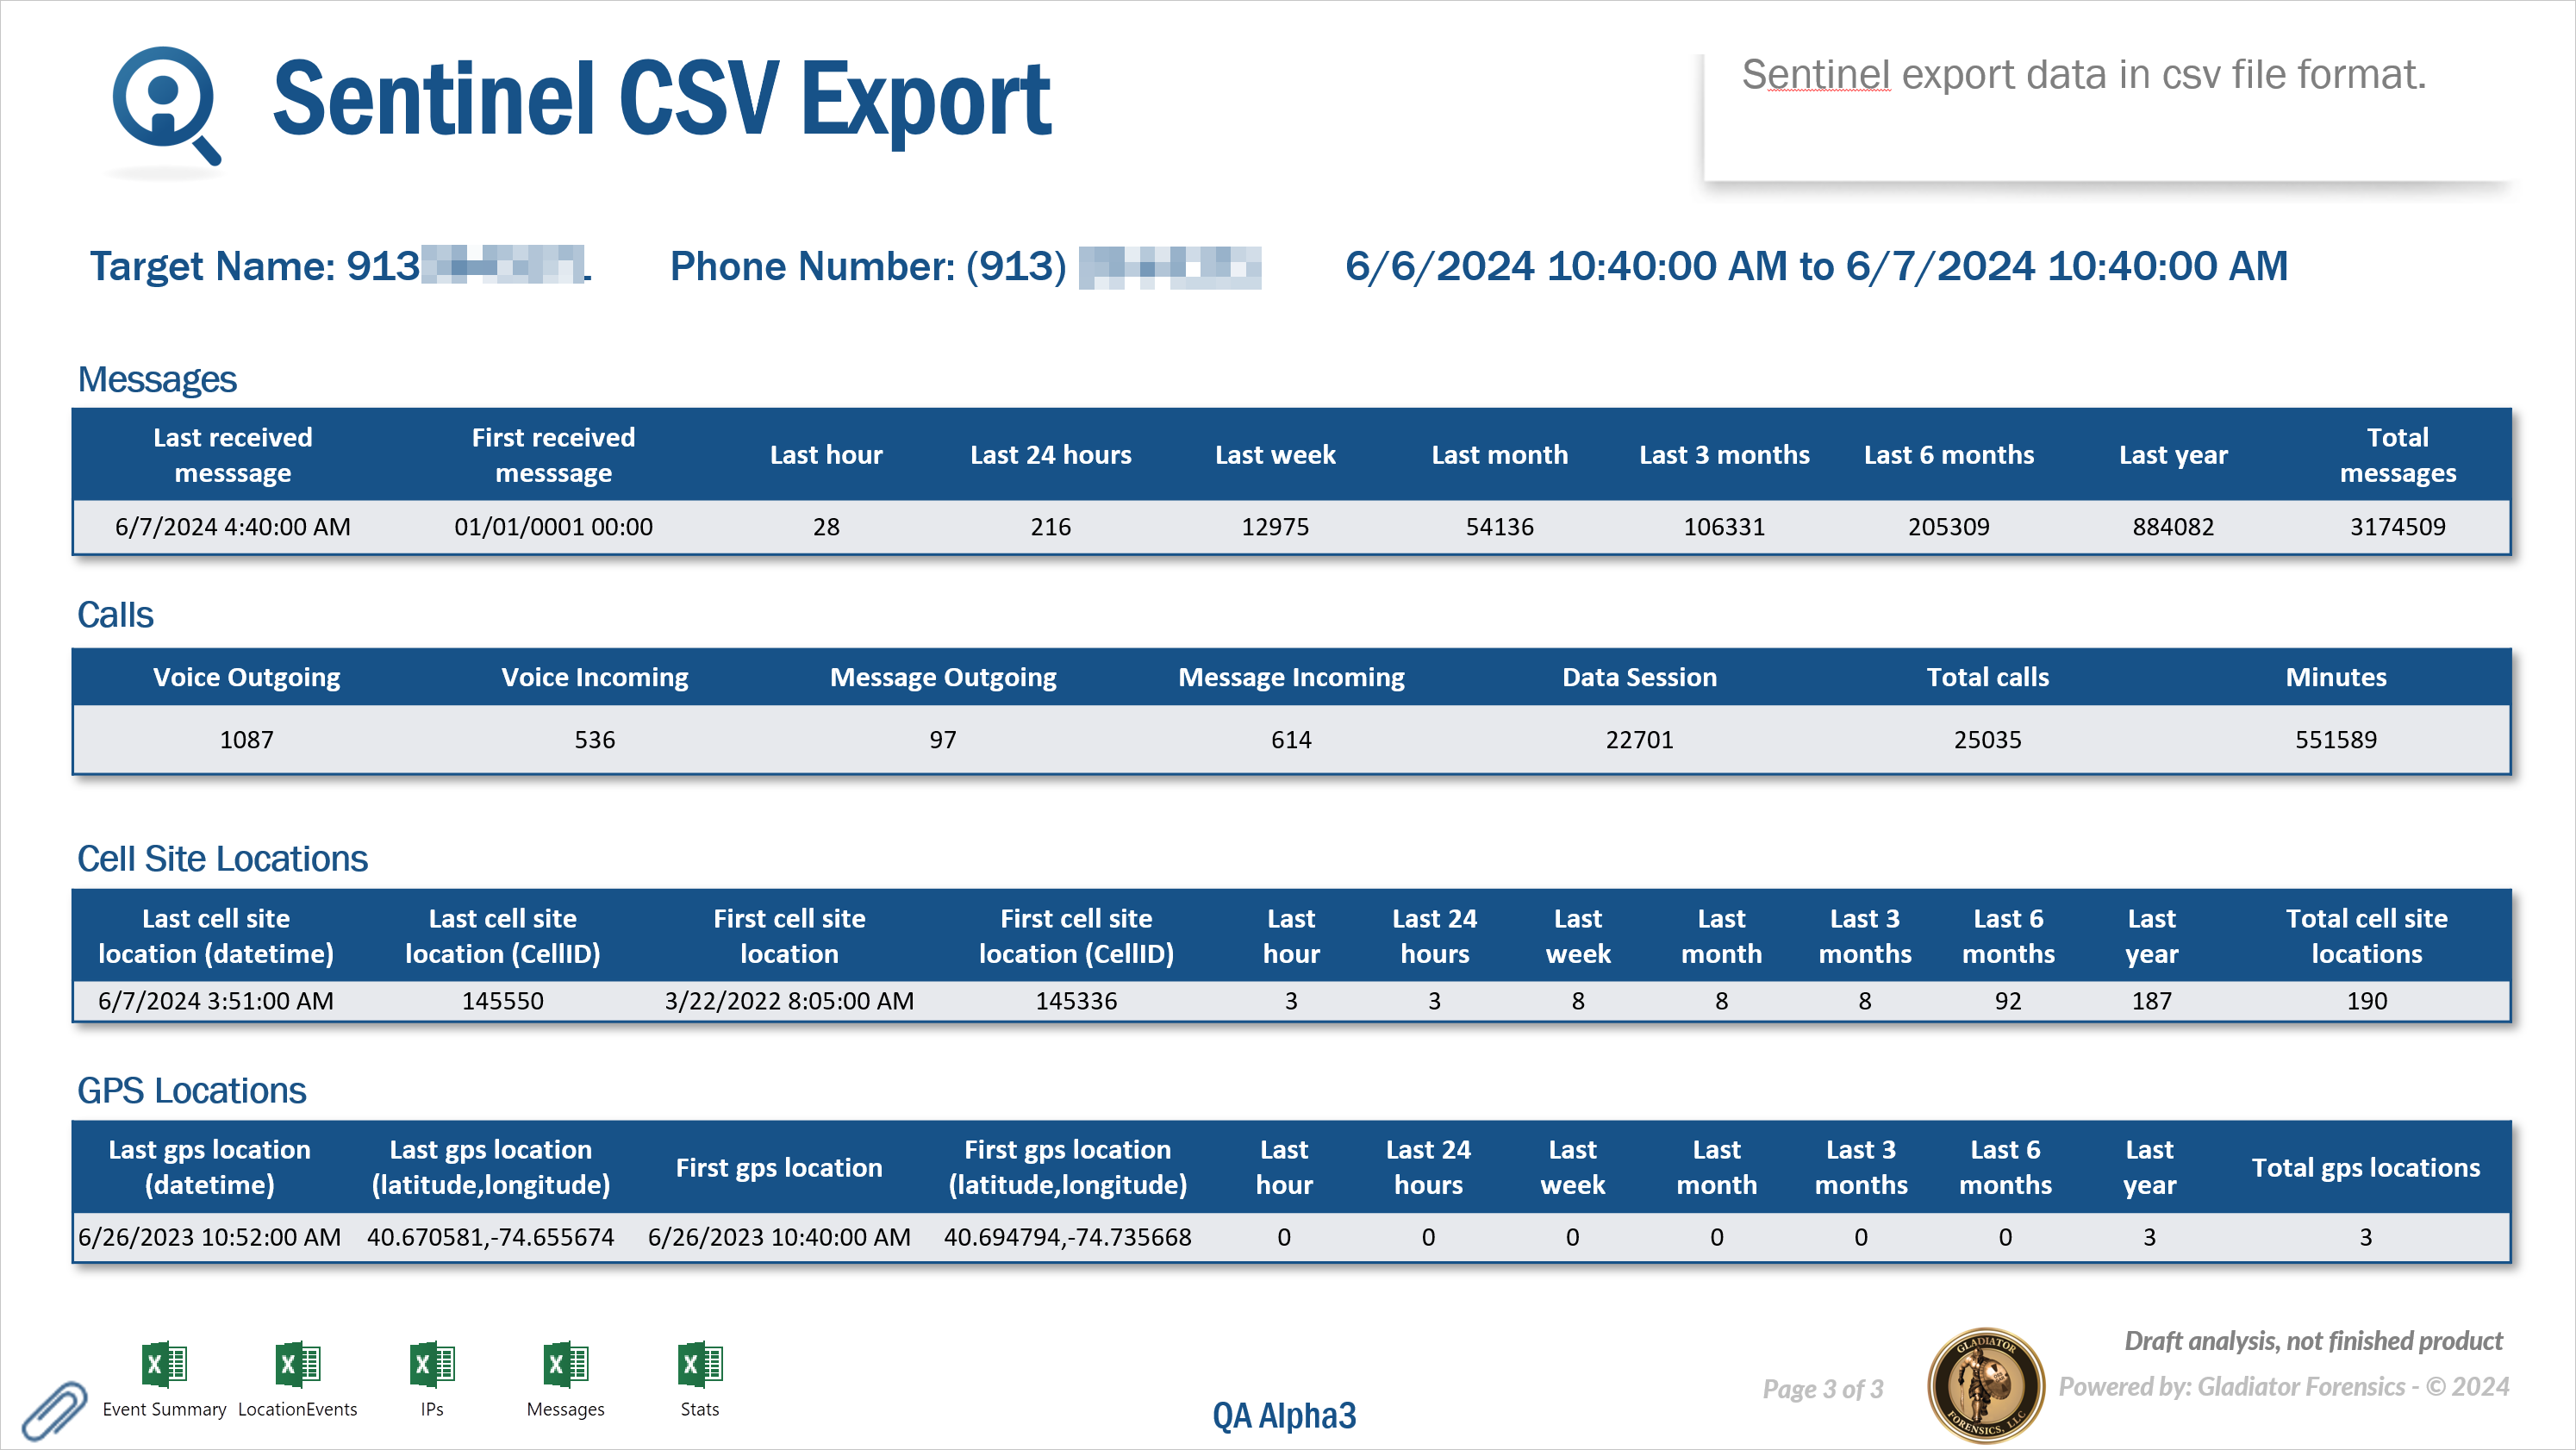
This section of the IQ packet provides you with a CSV export of the Sentinel's PRTT and GPS intercept monitoring data. Typically this IQ packet is set up as a recurrent report and can be used to share the collected data with other agencies for further analysis.
For each of the phones you selected to include on the New IQ packet screen this section of the IQ packet displays one slide with the statistics summary, detailing the number of messages, calls, cell sites and GPS locations and their timings, and Excel downloads for the data you selected to export using Sentinel export data settings which may include:
-
Event summary which provides the data that is displayed on the Sentinel screen's Event summary view.
-
Location events which provides the data that is displayed on the Sentinel screen's Location events view.
-
IPs events which provides the data that is displayed on the Sentinel screen's IPs view.
-
Stats which provides a statistics file detailing a summary of the number of messages, calls, cell sites and GPS locations and their timings.
-
Messages which provides a raw messages download.
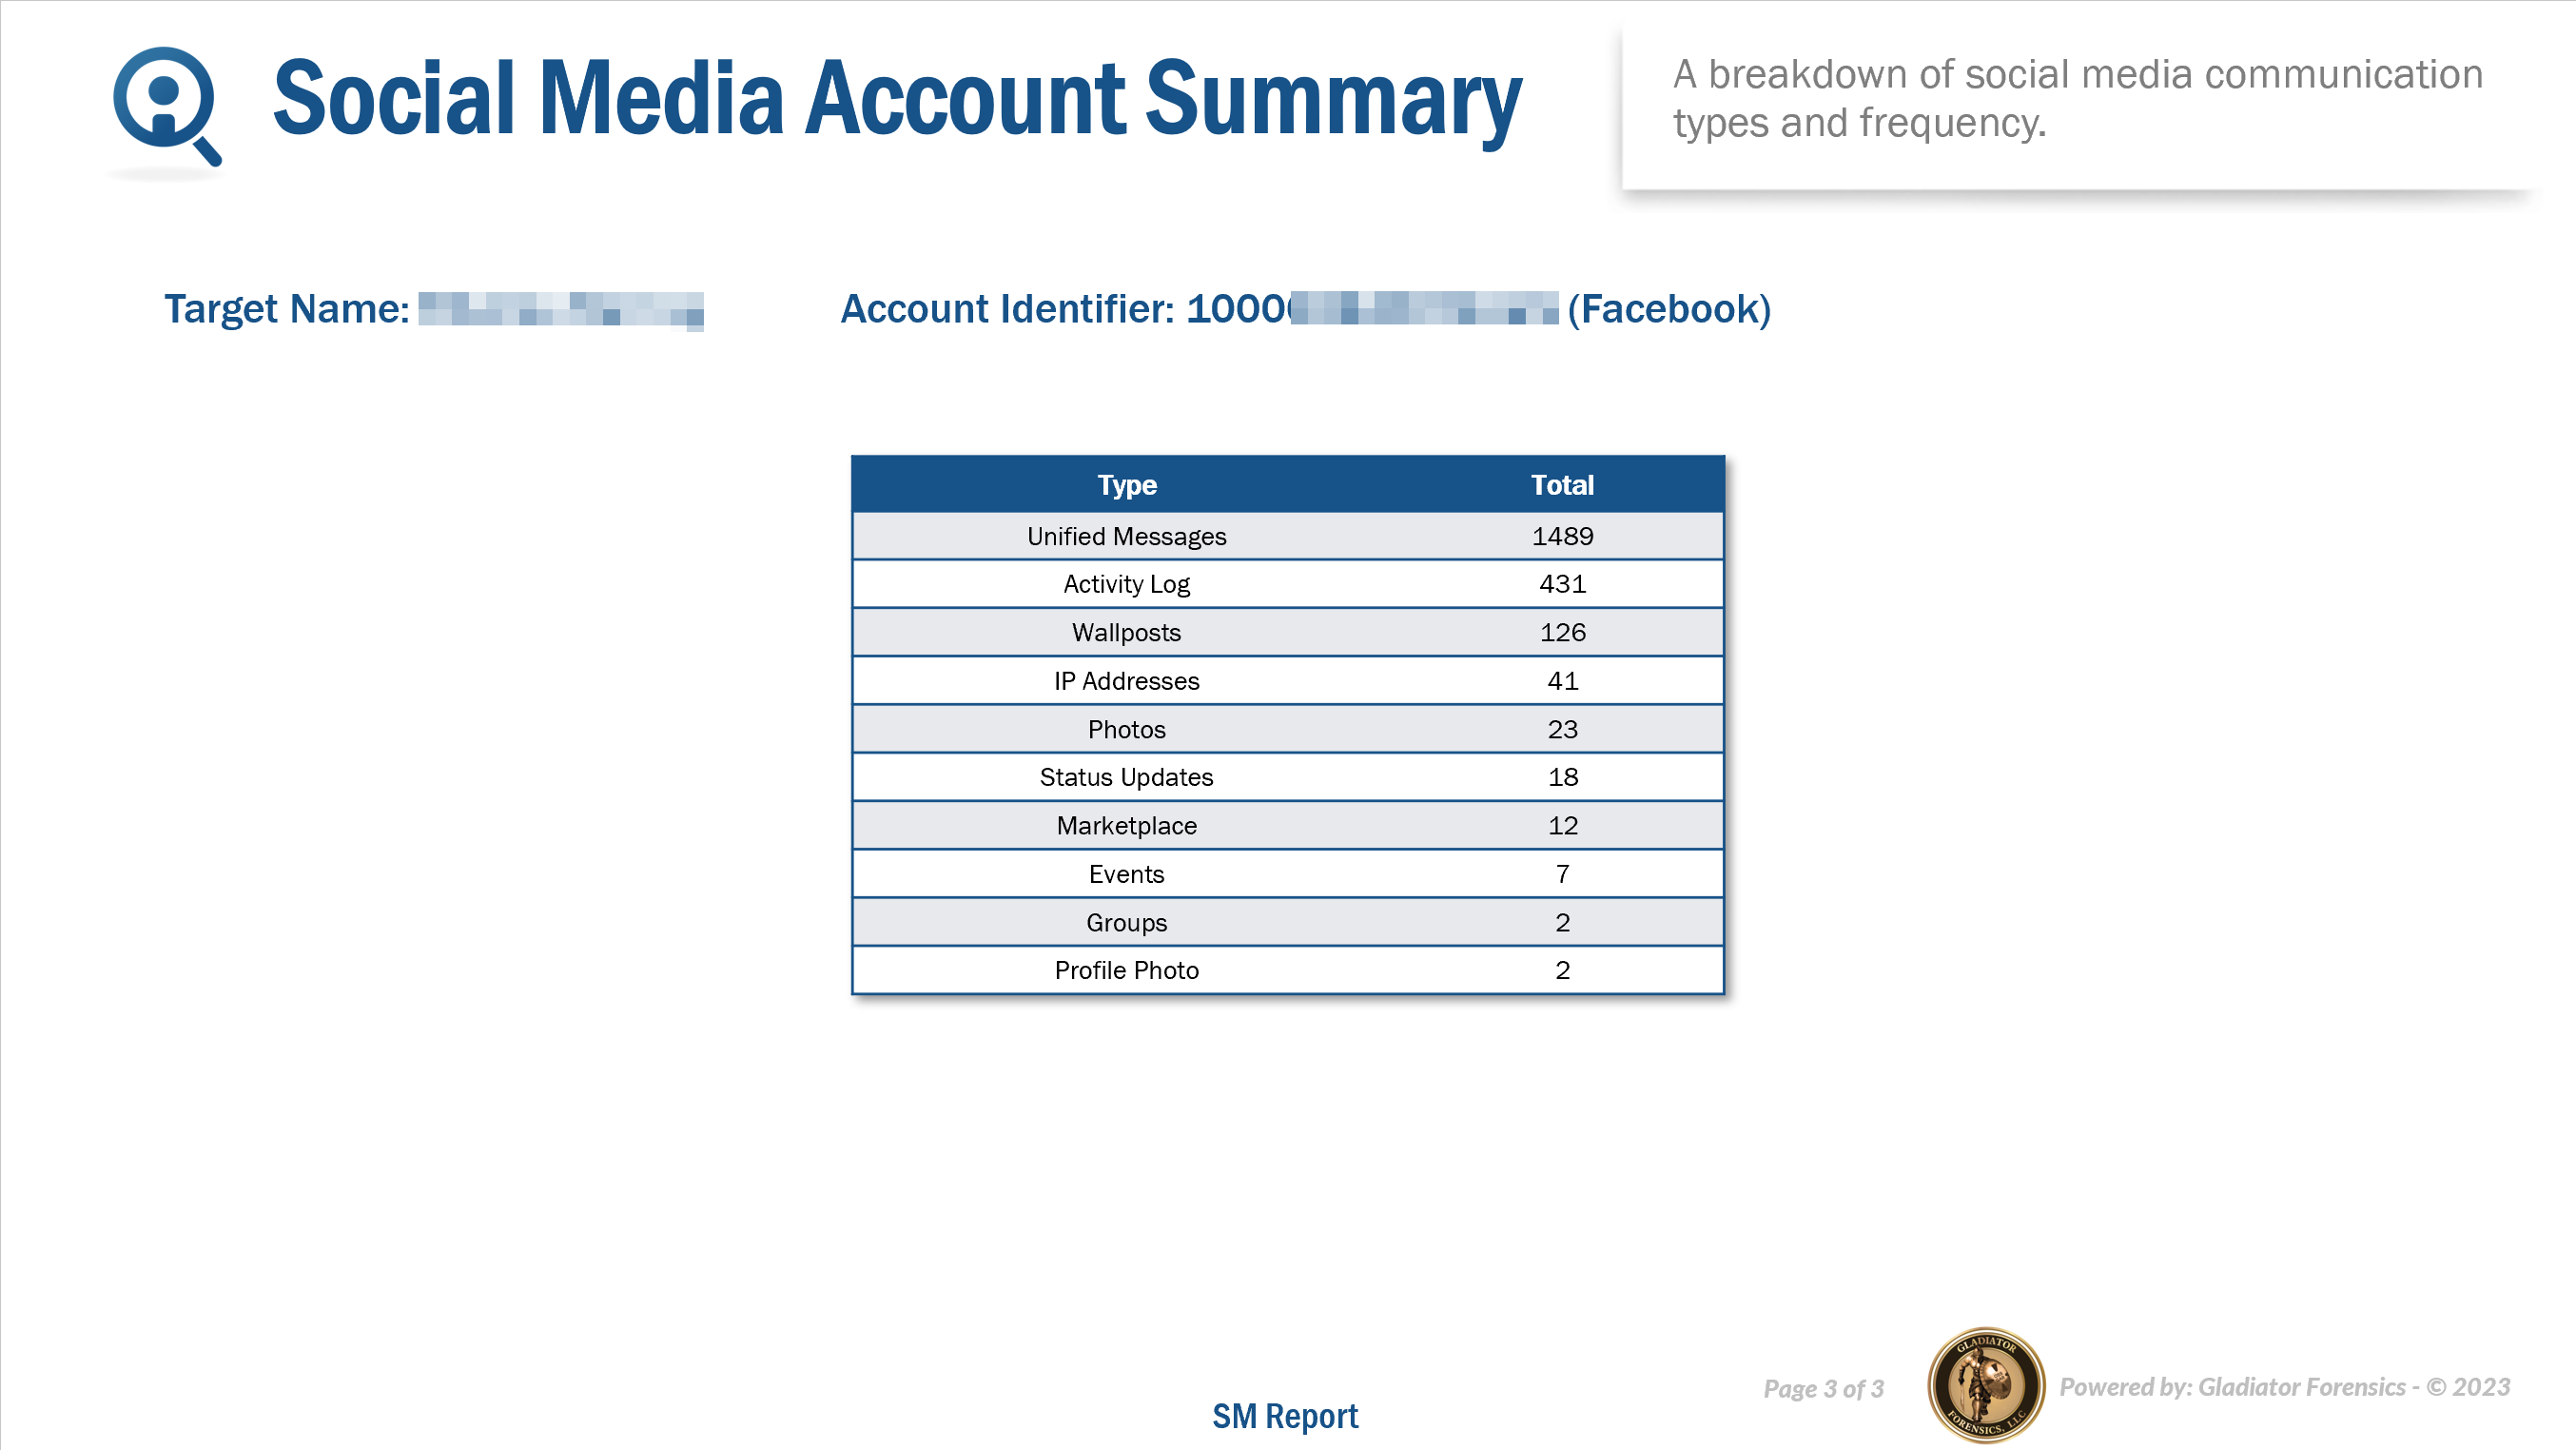
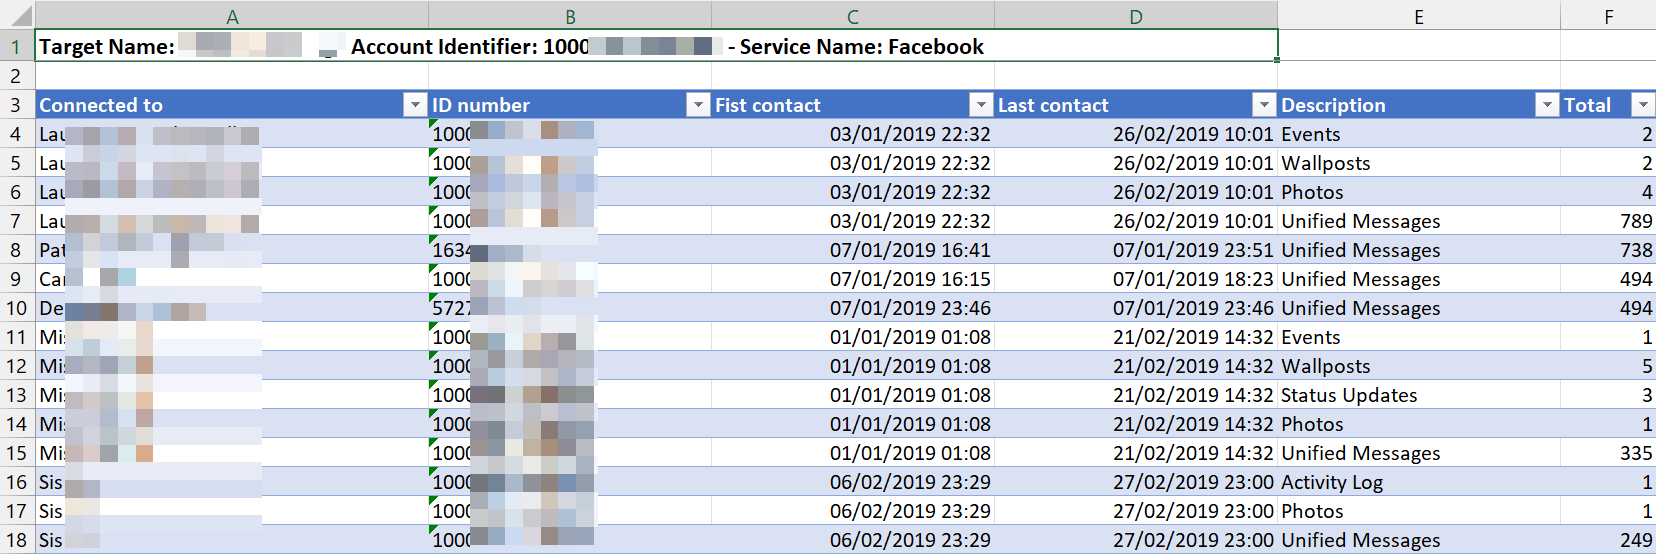
This section of the IQ packet provides a breakdown of social media communication types and frequency.
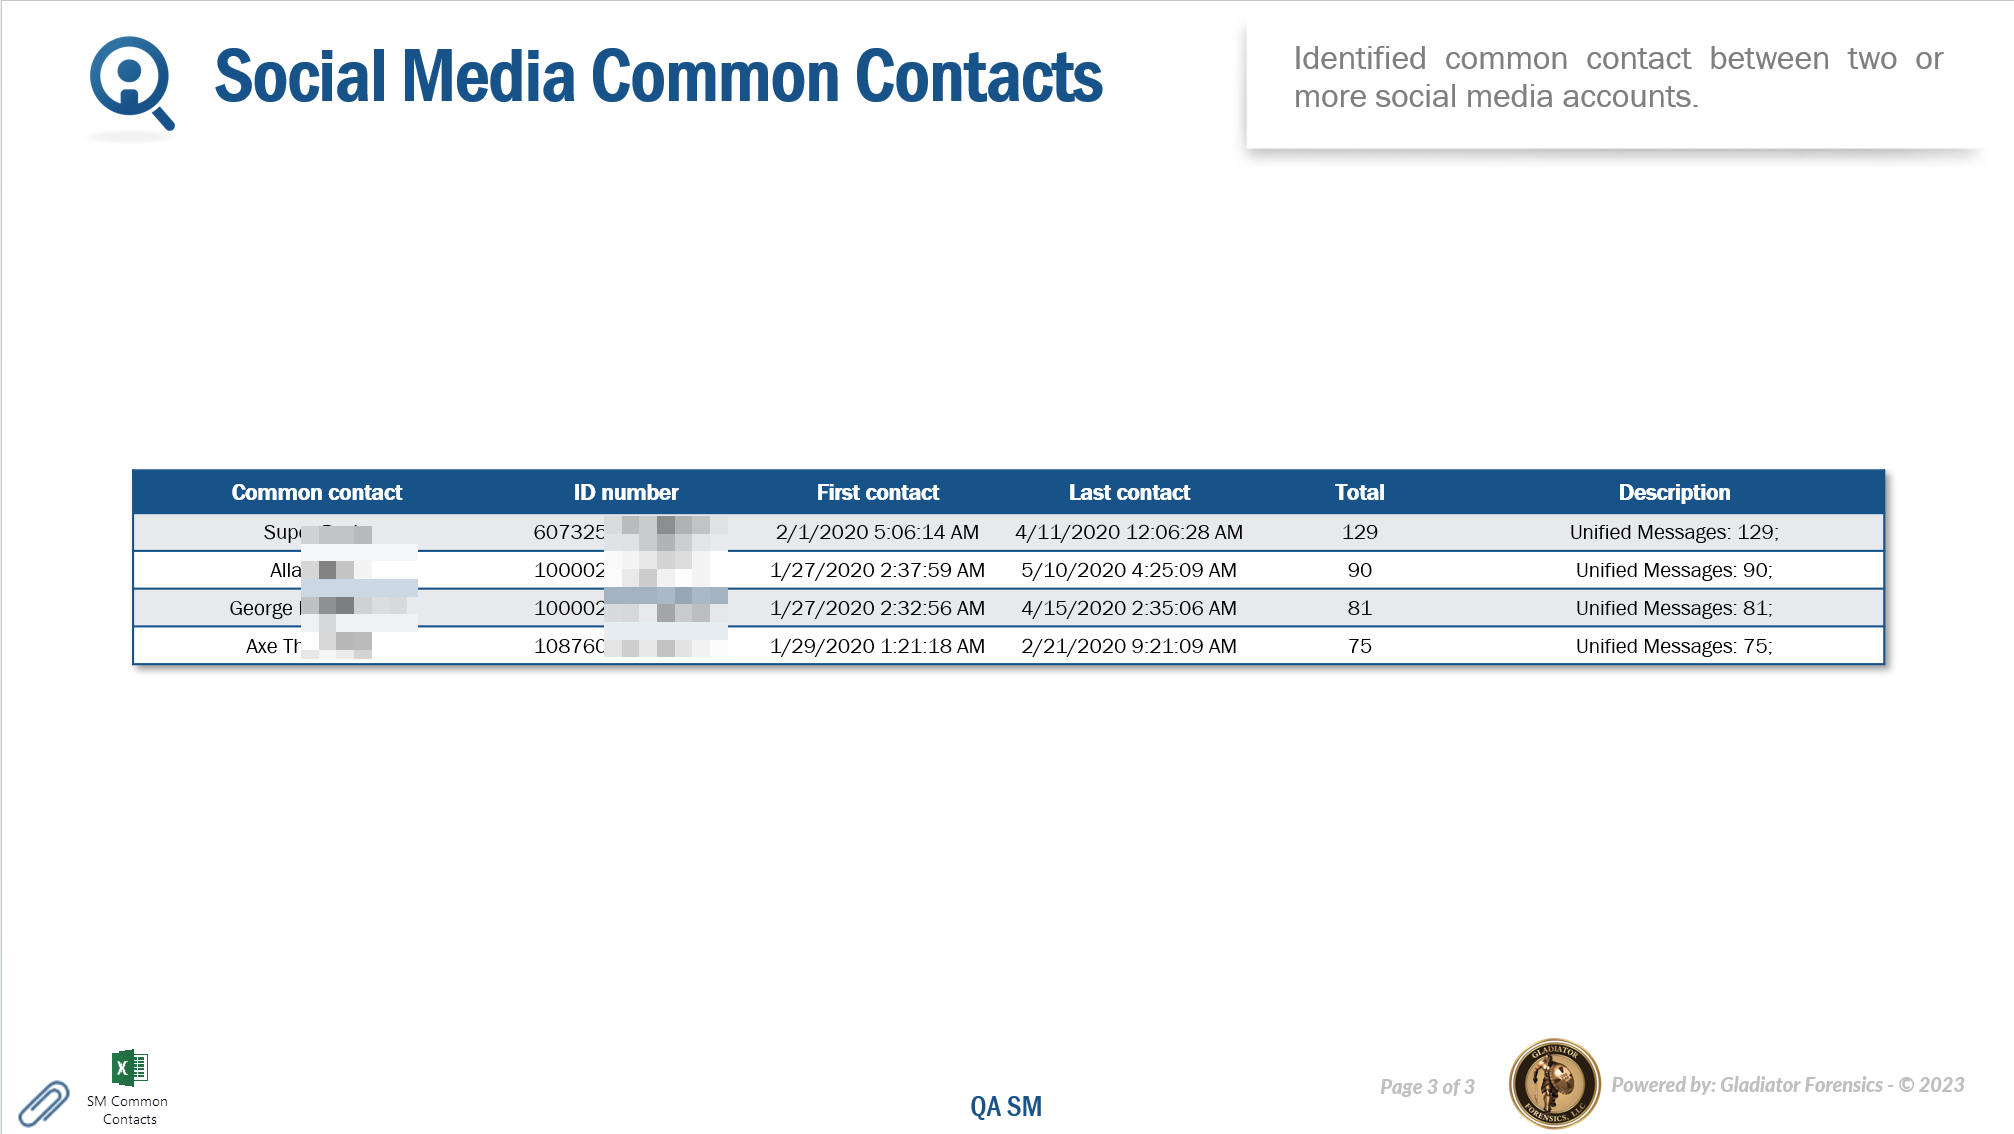
This section of the IQ packet identifies common contact between two or more social media accounts. This IQ packet requires you to have selected a minimum of two social media accounts. For the accounts you selected, this displays all the common contacts which two or more accounts have communicated with.
A table is included which displays the name of the common contact, their account identifier, their first and last communications, the total number of communications and a breakdown of the communication types.
The First contact along with Last contact allows you to investigate the contact pattern between the two accounts. The following are examples of how this data may help your investigation:
-
This data can be used in a similar way to the first and last contacts in Social Media Frequent contacts, however additionally you can analyze multiple suspects together, or the suspect's and victim's contact pattern with a common contacts.
- If a person is contacting both the suspect and the victim after the crime to find out the location of the victim it may suggest they are unaware of the crime. You may therefore decide to exclude the person as a suspect.
-
If a person is contacting the suspect, but has stopped contacting the victim it may indicate that they knew of the murder and they therefore may be an accomplice. You may therefore decide to include the person as a suspect.
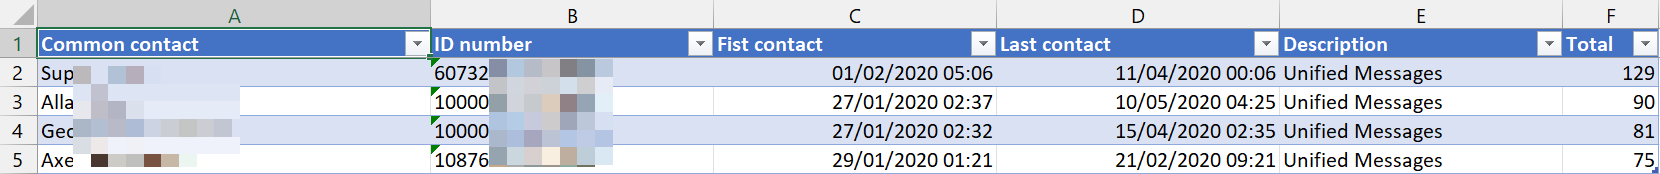
If you selected "Microsoft Excel" as an Output then this section also contains a Microsoft Excel attachment that allows you to analyze the data further if required. The following graphic provides an example of the Microsoft Excel attachment.
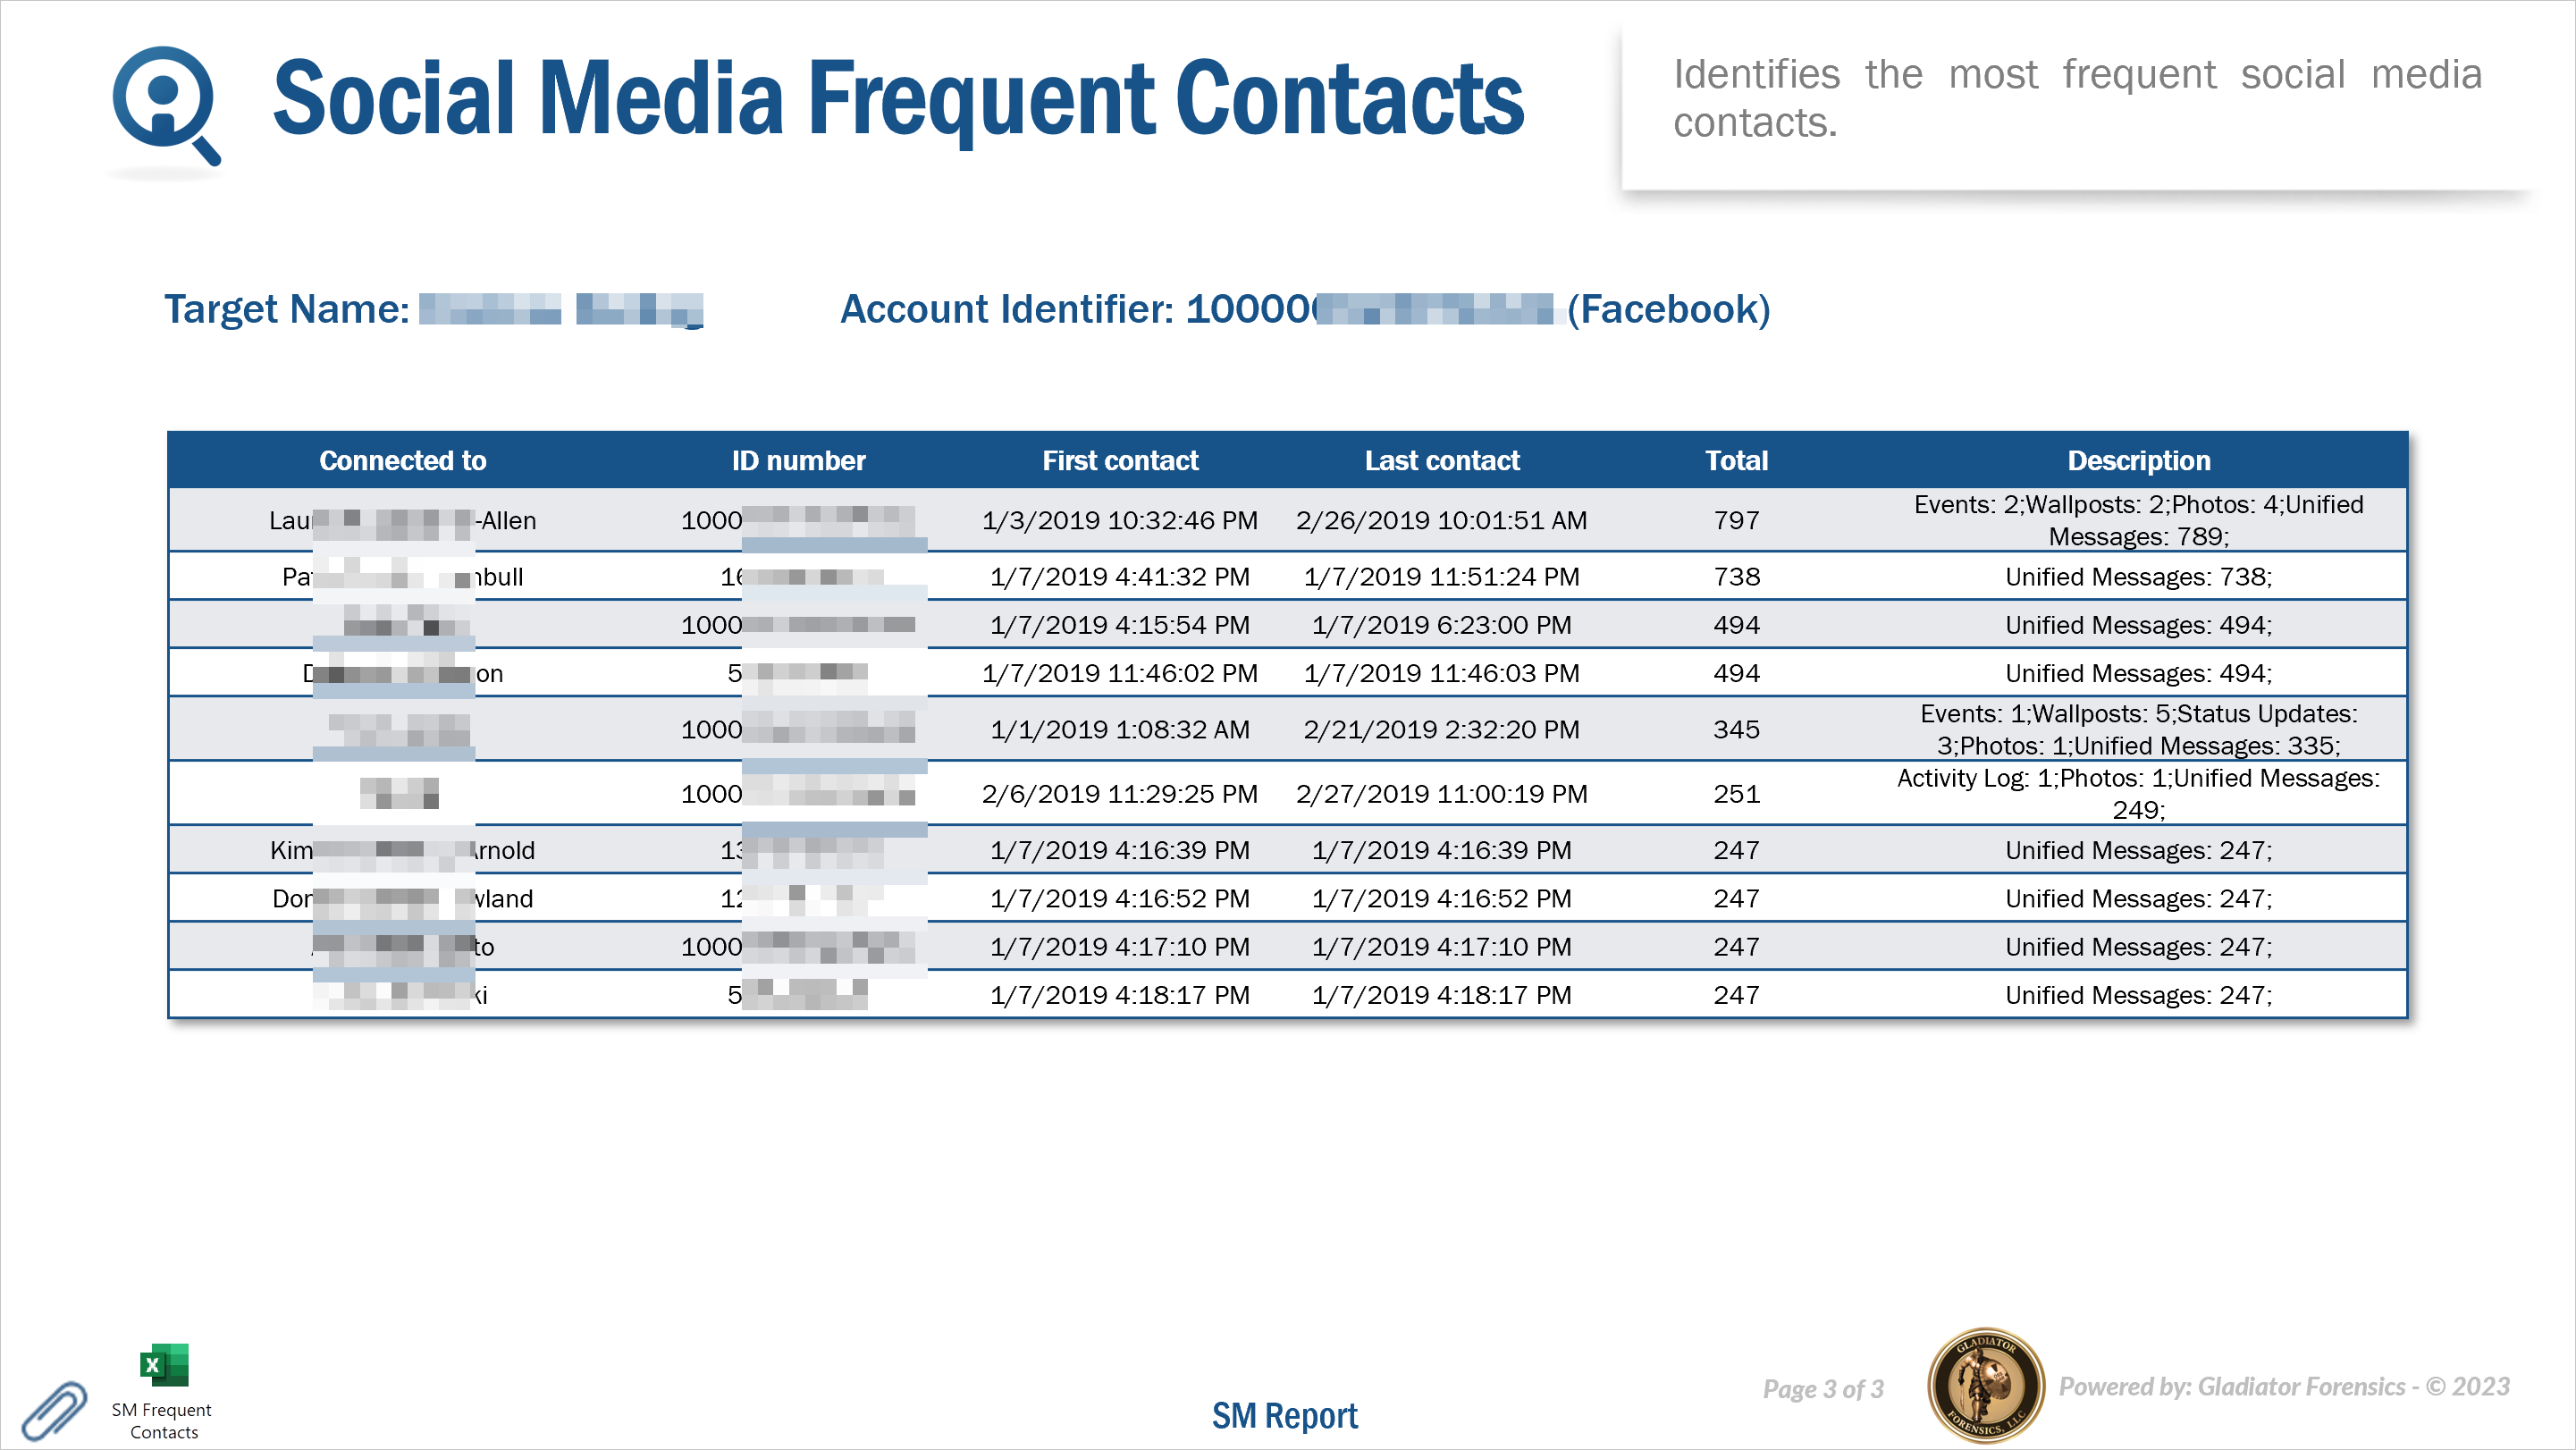
This section of the IQ packet identifies the most frequent social media contacts. For each of the social media targets you selected, a page displays the top ten most frequently contacted social media accounts.
The person's name and account identifier are displayed, followed by a table which includes the name of the contact, their account identifier, their first and last communications, the total number of communications and a breakdown of the communication types.
The First contact along with Last contact allows you to investigate the contact pattern between the two accounts. The following are examples of how this data may help your investigation:
- The social media account may be in this most frequently contacted list but only because there were many exchanges during the time of the crime and outside of that time there was no contact. Depending on your crime this may indicate they were an accomplice.
- Anyone who contacts often but stops contacting around the time of a crime, for example a murder or an abduction, is a potential suspect. For example, a boyfriend may contact his girlfriend frequently, but if his last contact is immediately before the time his girlfriend is murdered then this may indicate that he knew of the murder and therefore he stopped contacting her.
- A new frequent contact may be a potential suspect. For example, the time of the first contact may indicate that a victim just met the contact a few days prior to the crime.
If you selected "Microsoft Excel" as an Output then this section also contains a Microsoft Excel attachment that allows you to analyze the data further if required. The following graphic provides an example of the Microsoft Excel attachment.
This section of the IQ packet uses geofence and tower dump data to help you:
- identify the most common devices around the target locations.
- identify all the devices that were at each location during a specific period of time.
The IQ packet consists of:
-
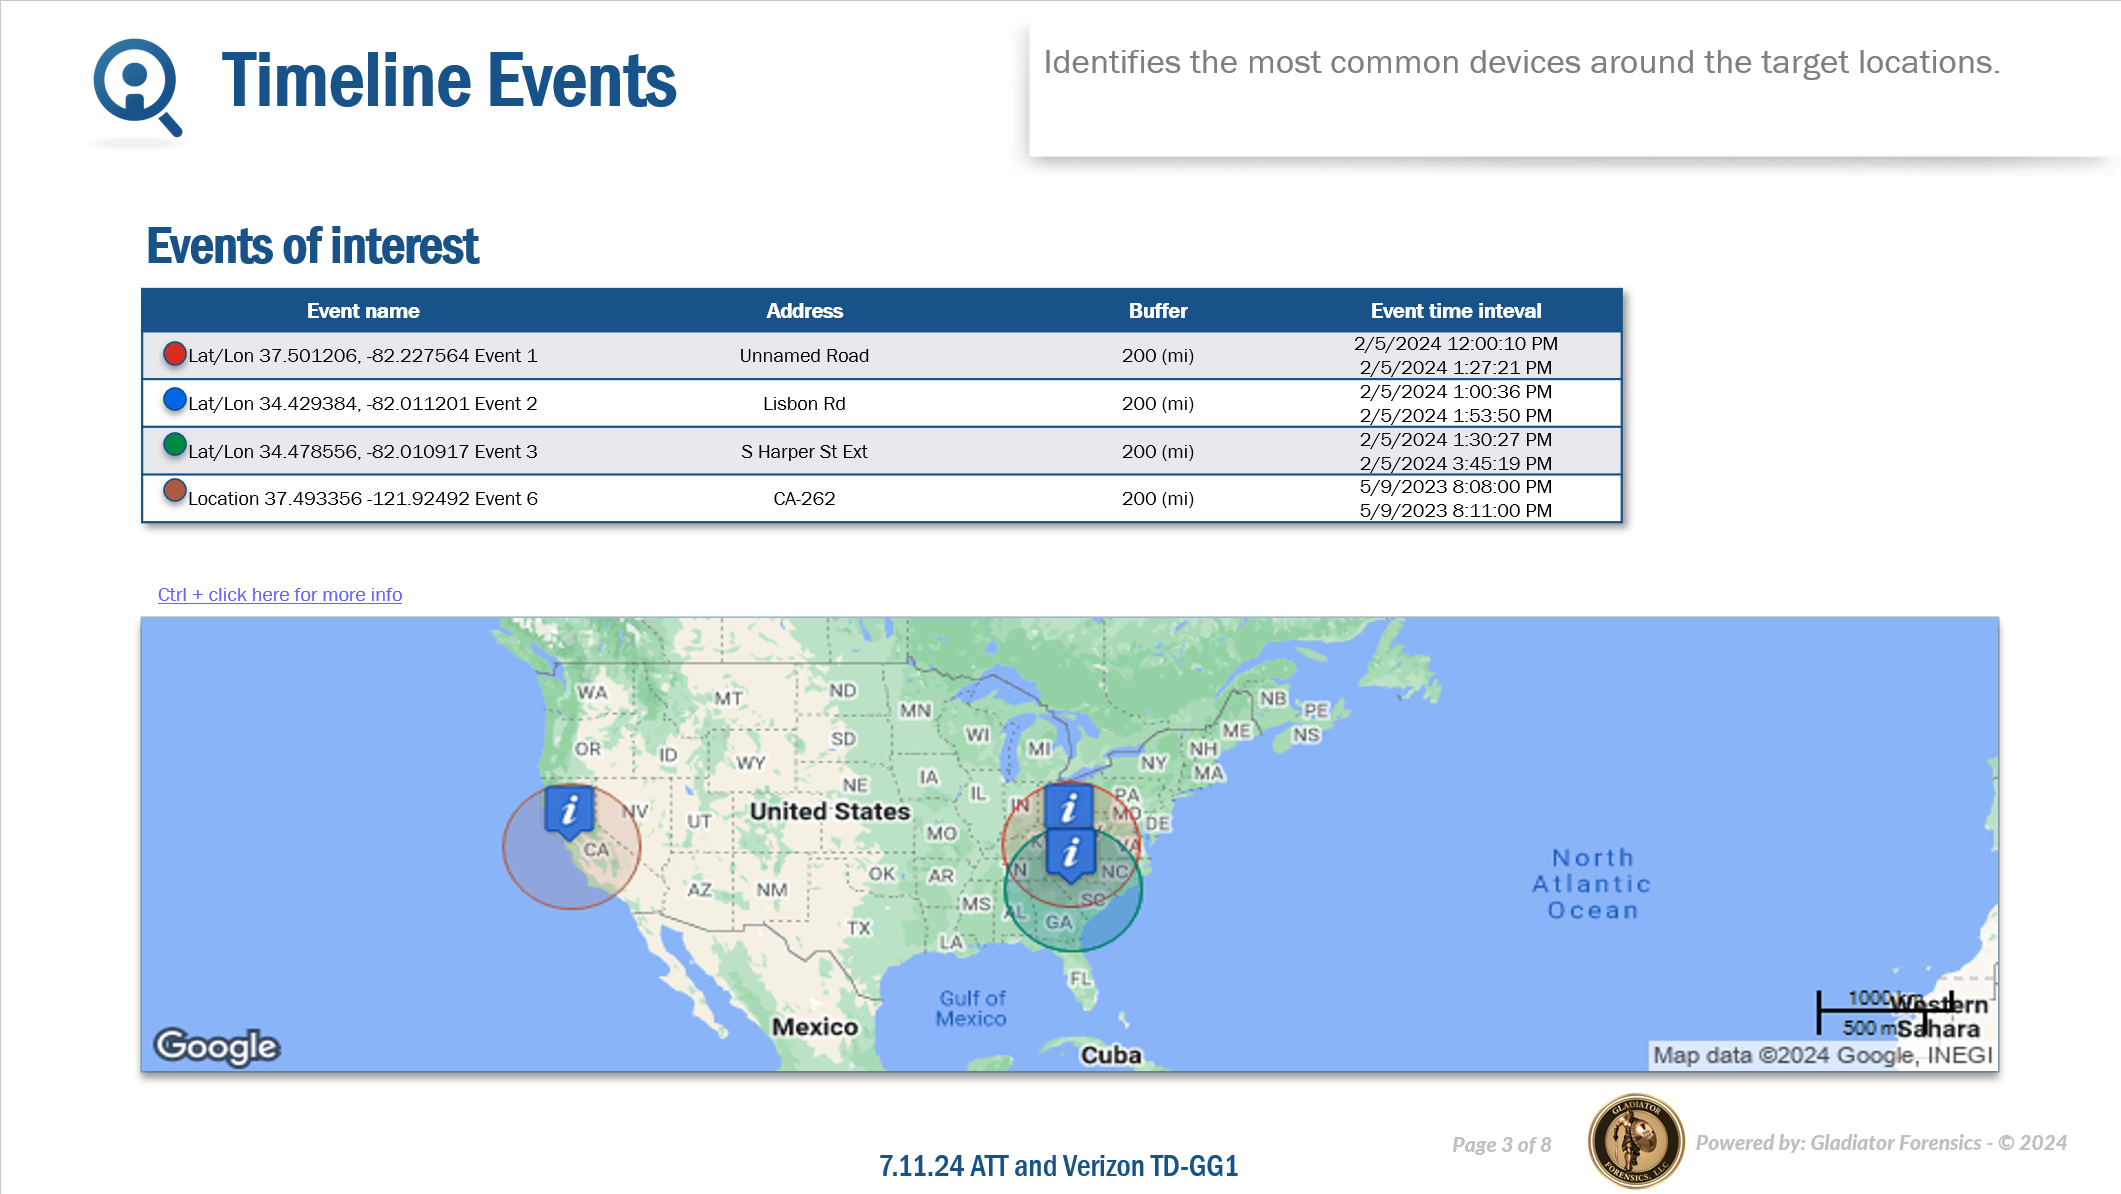
Timeline events
This lists all the events that have been added to the Events timeline screen, along with their address, buffer and the event's start and end time. A map displays the event location and buffer. A link is provided above the map allowing you to view the map in greater detail on a browser.
-
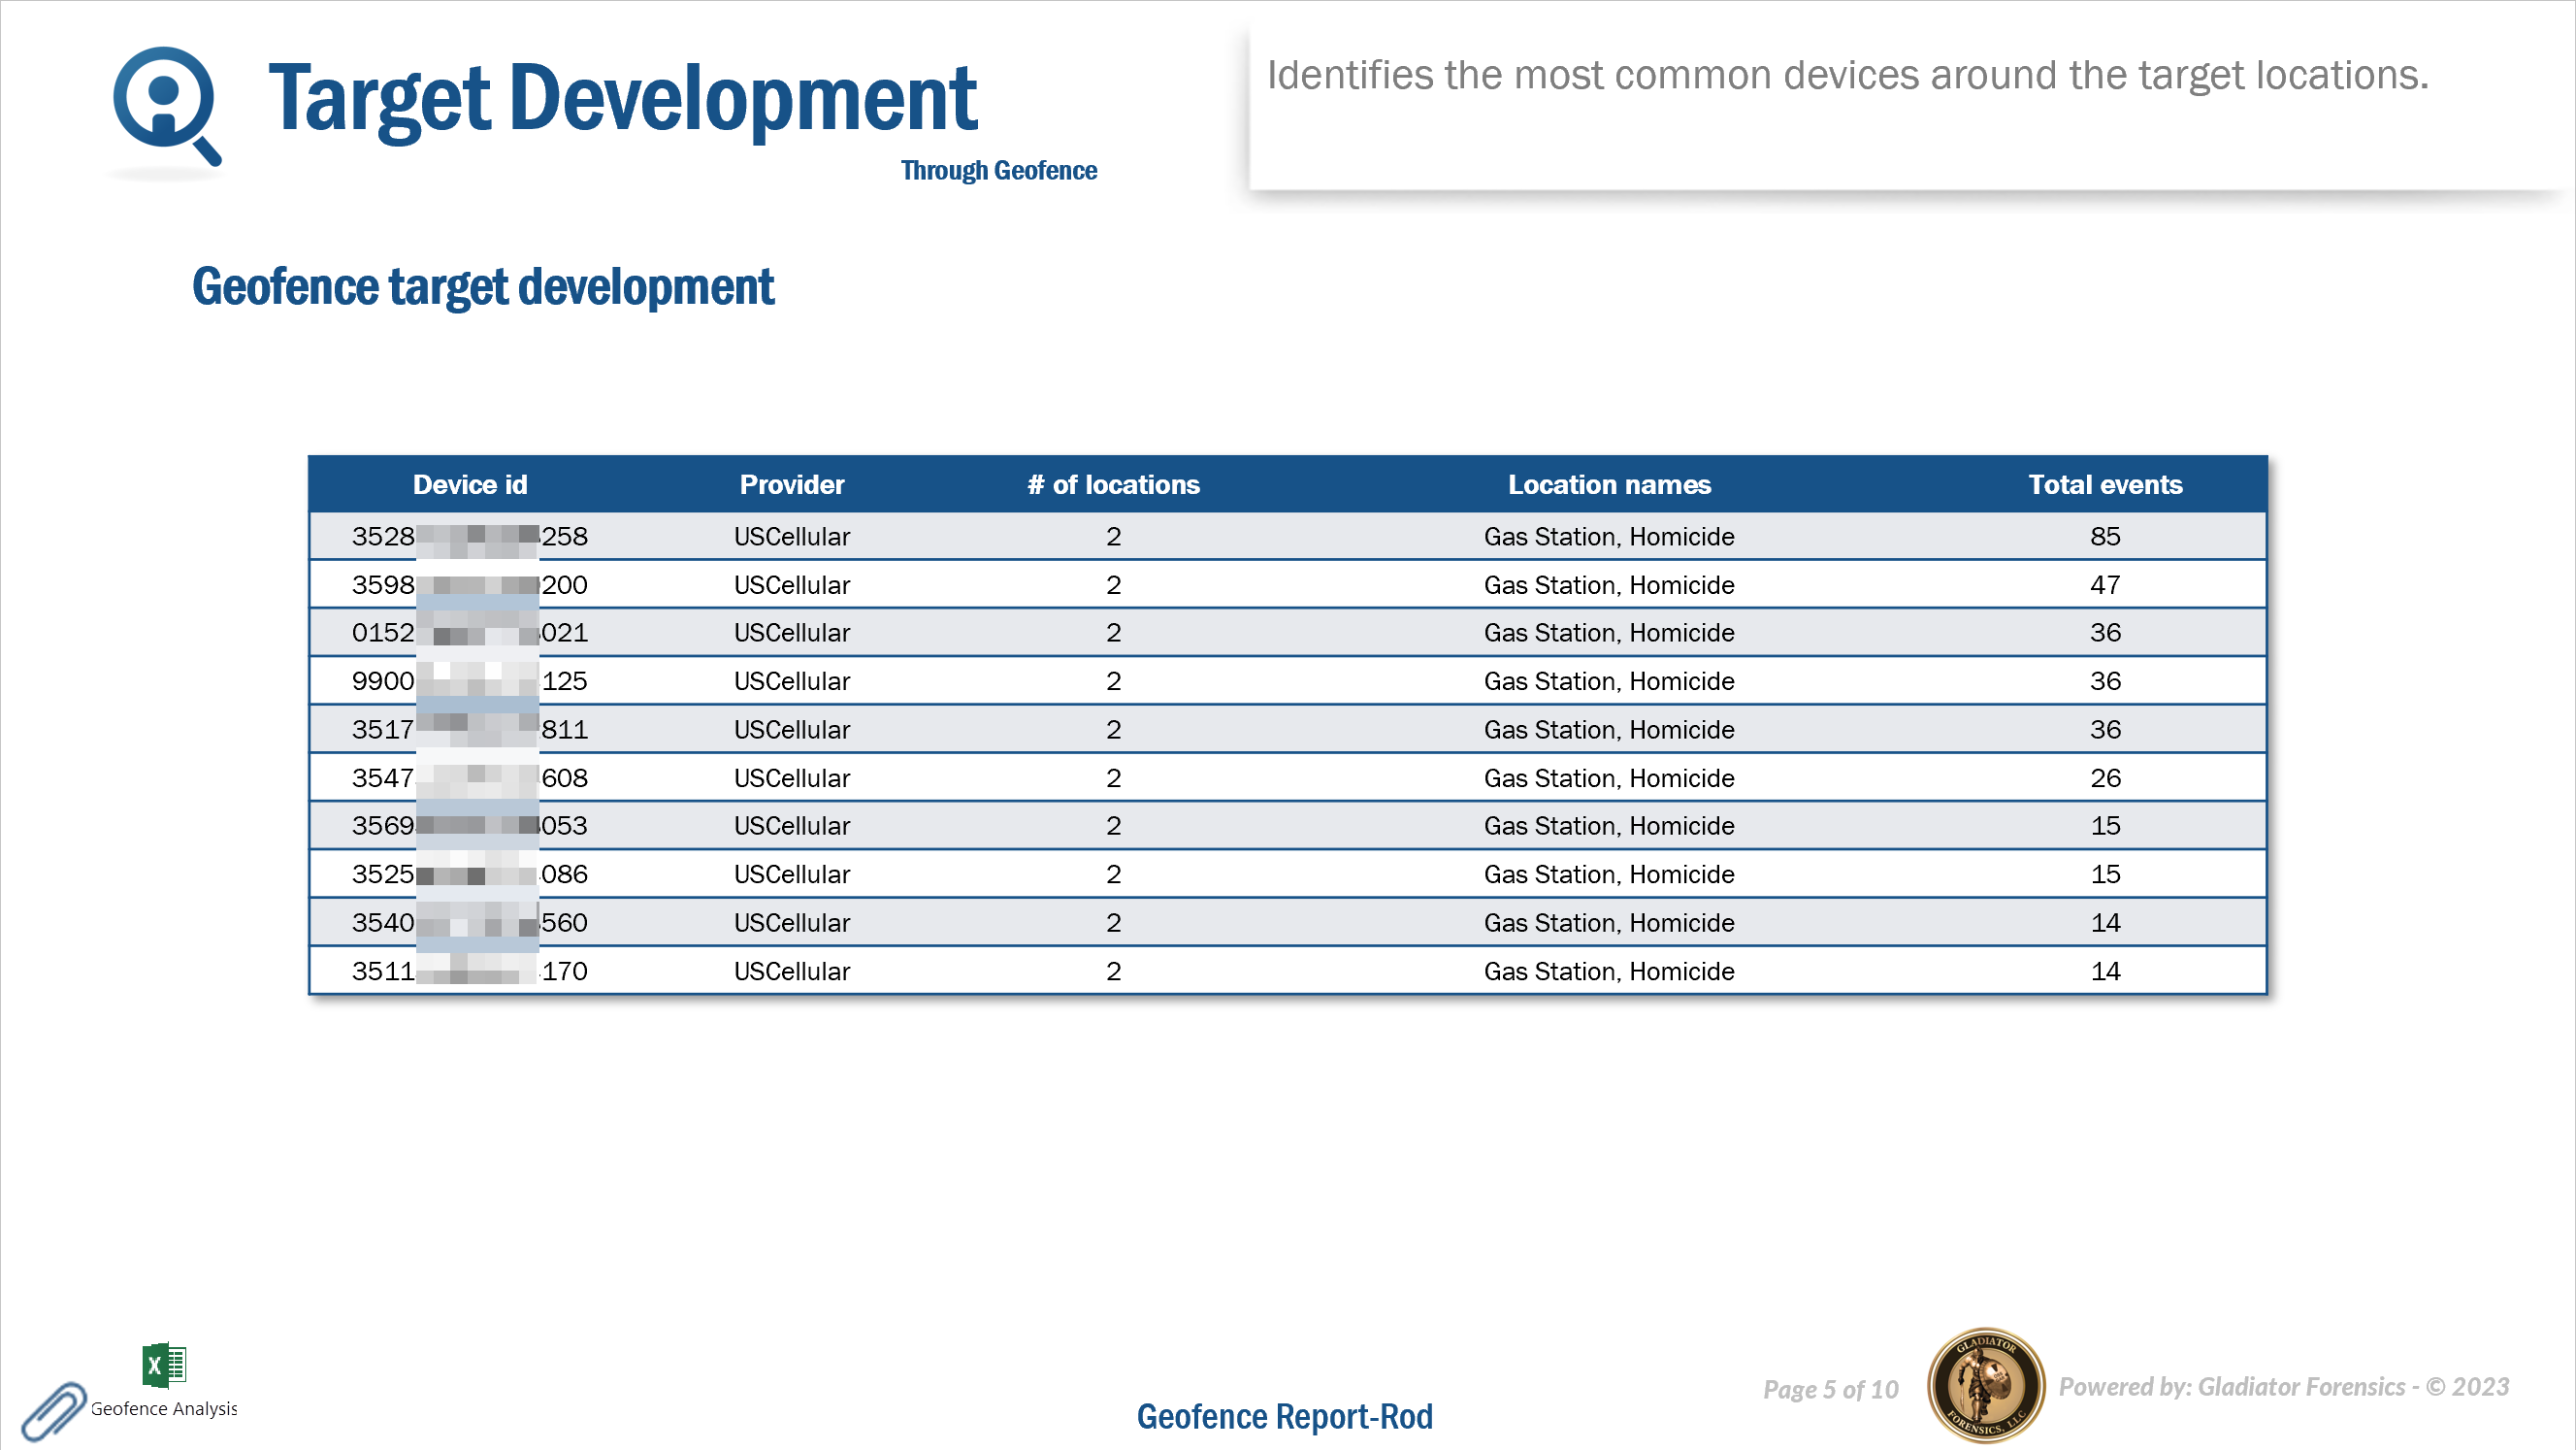
Target development slides
-
Target development: the first slide lists the top ten devices by common location.
-
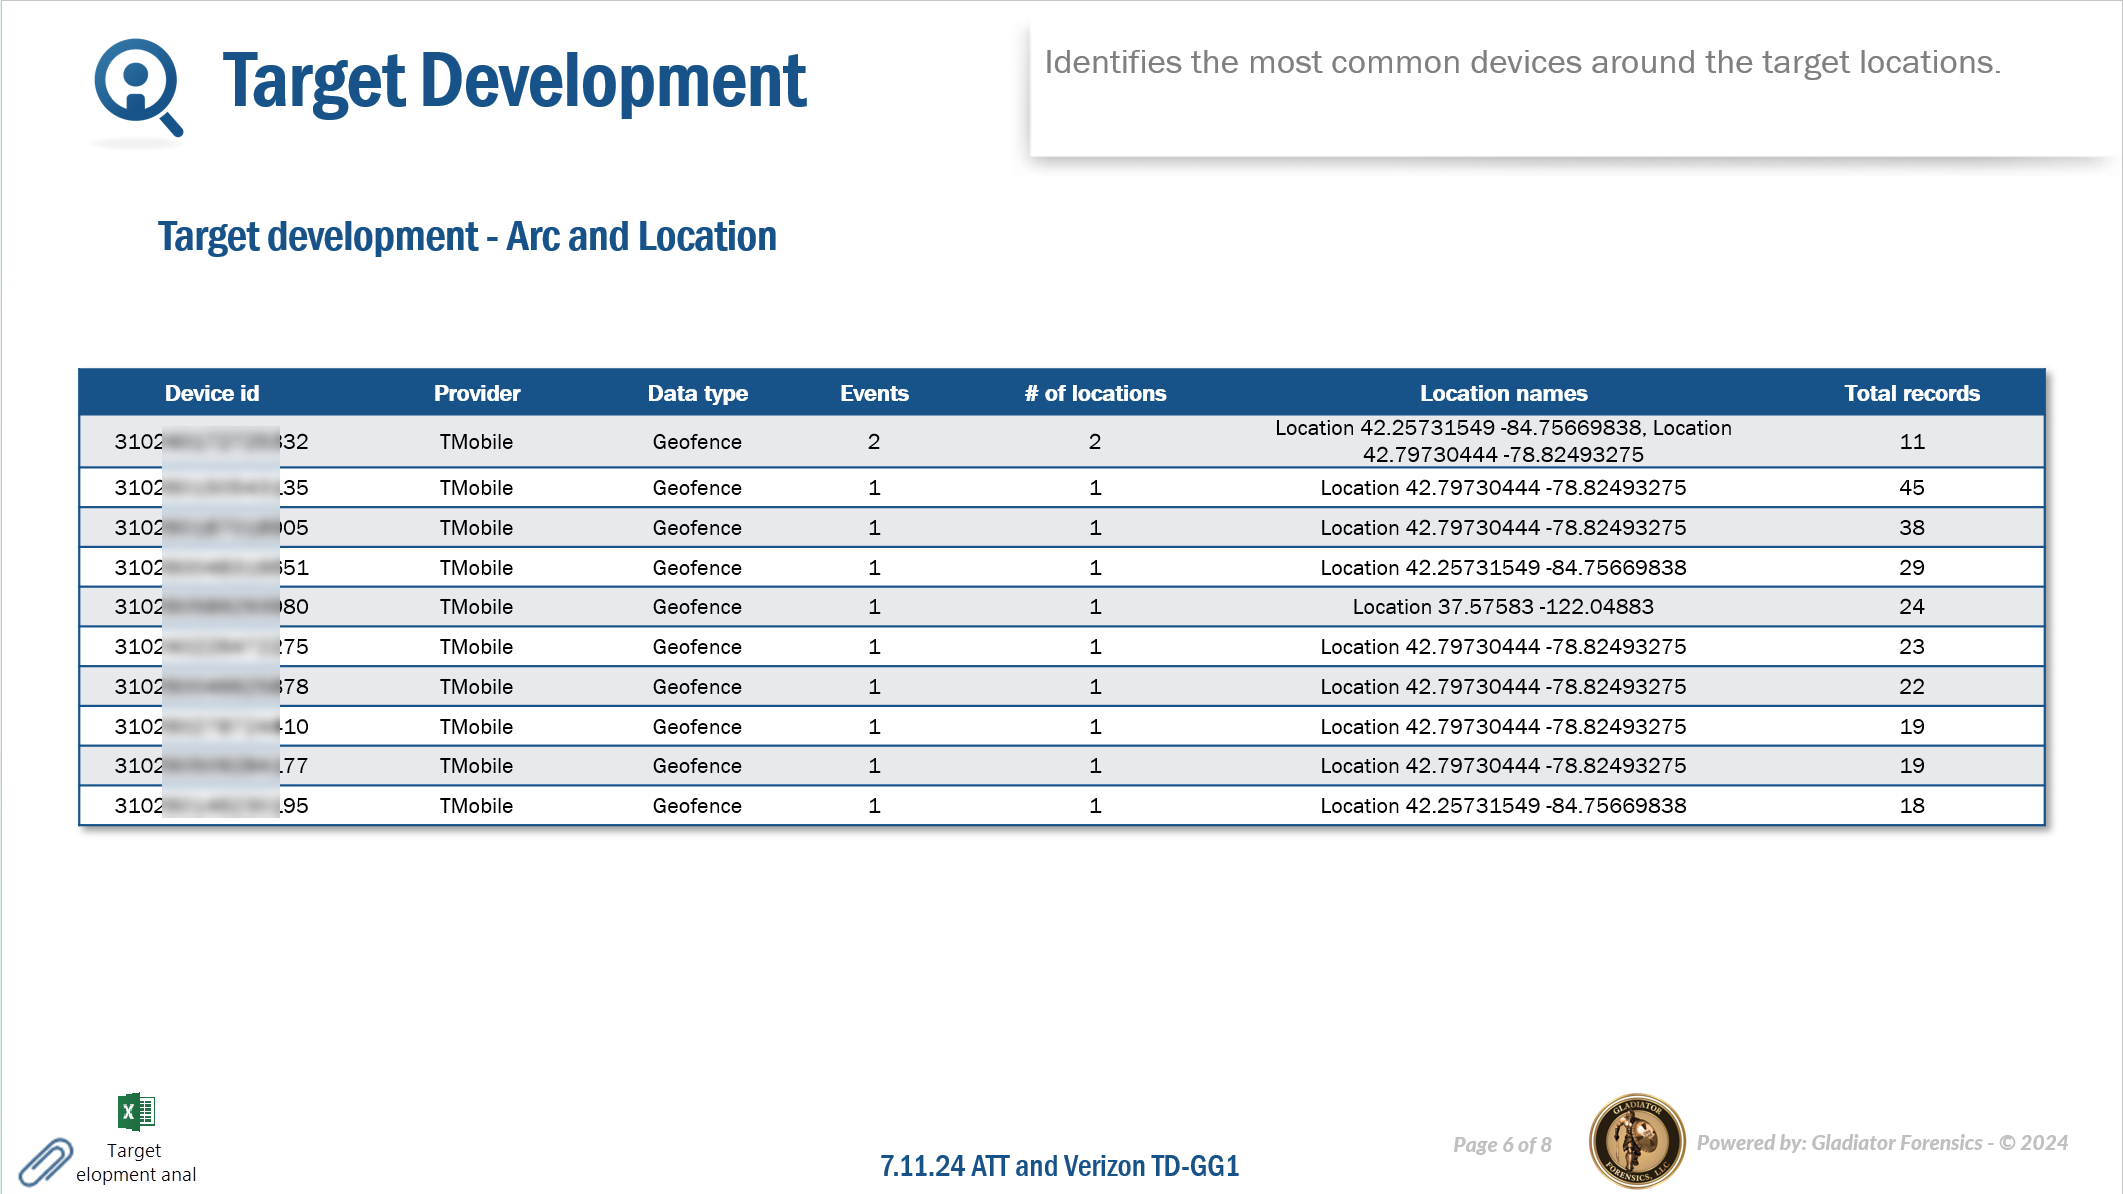
Target development - Arc and Location: this lists the top ten devices where the TA Arc intersects the target location.
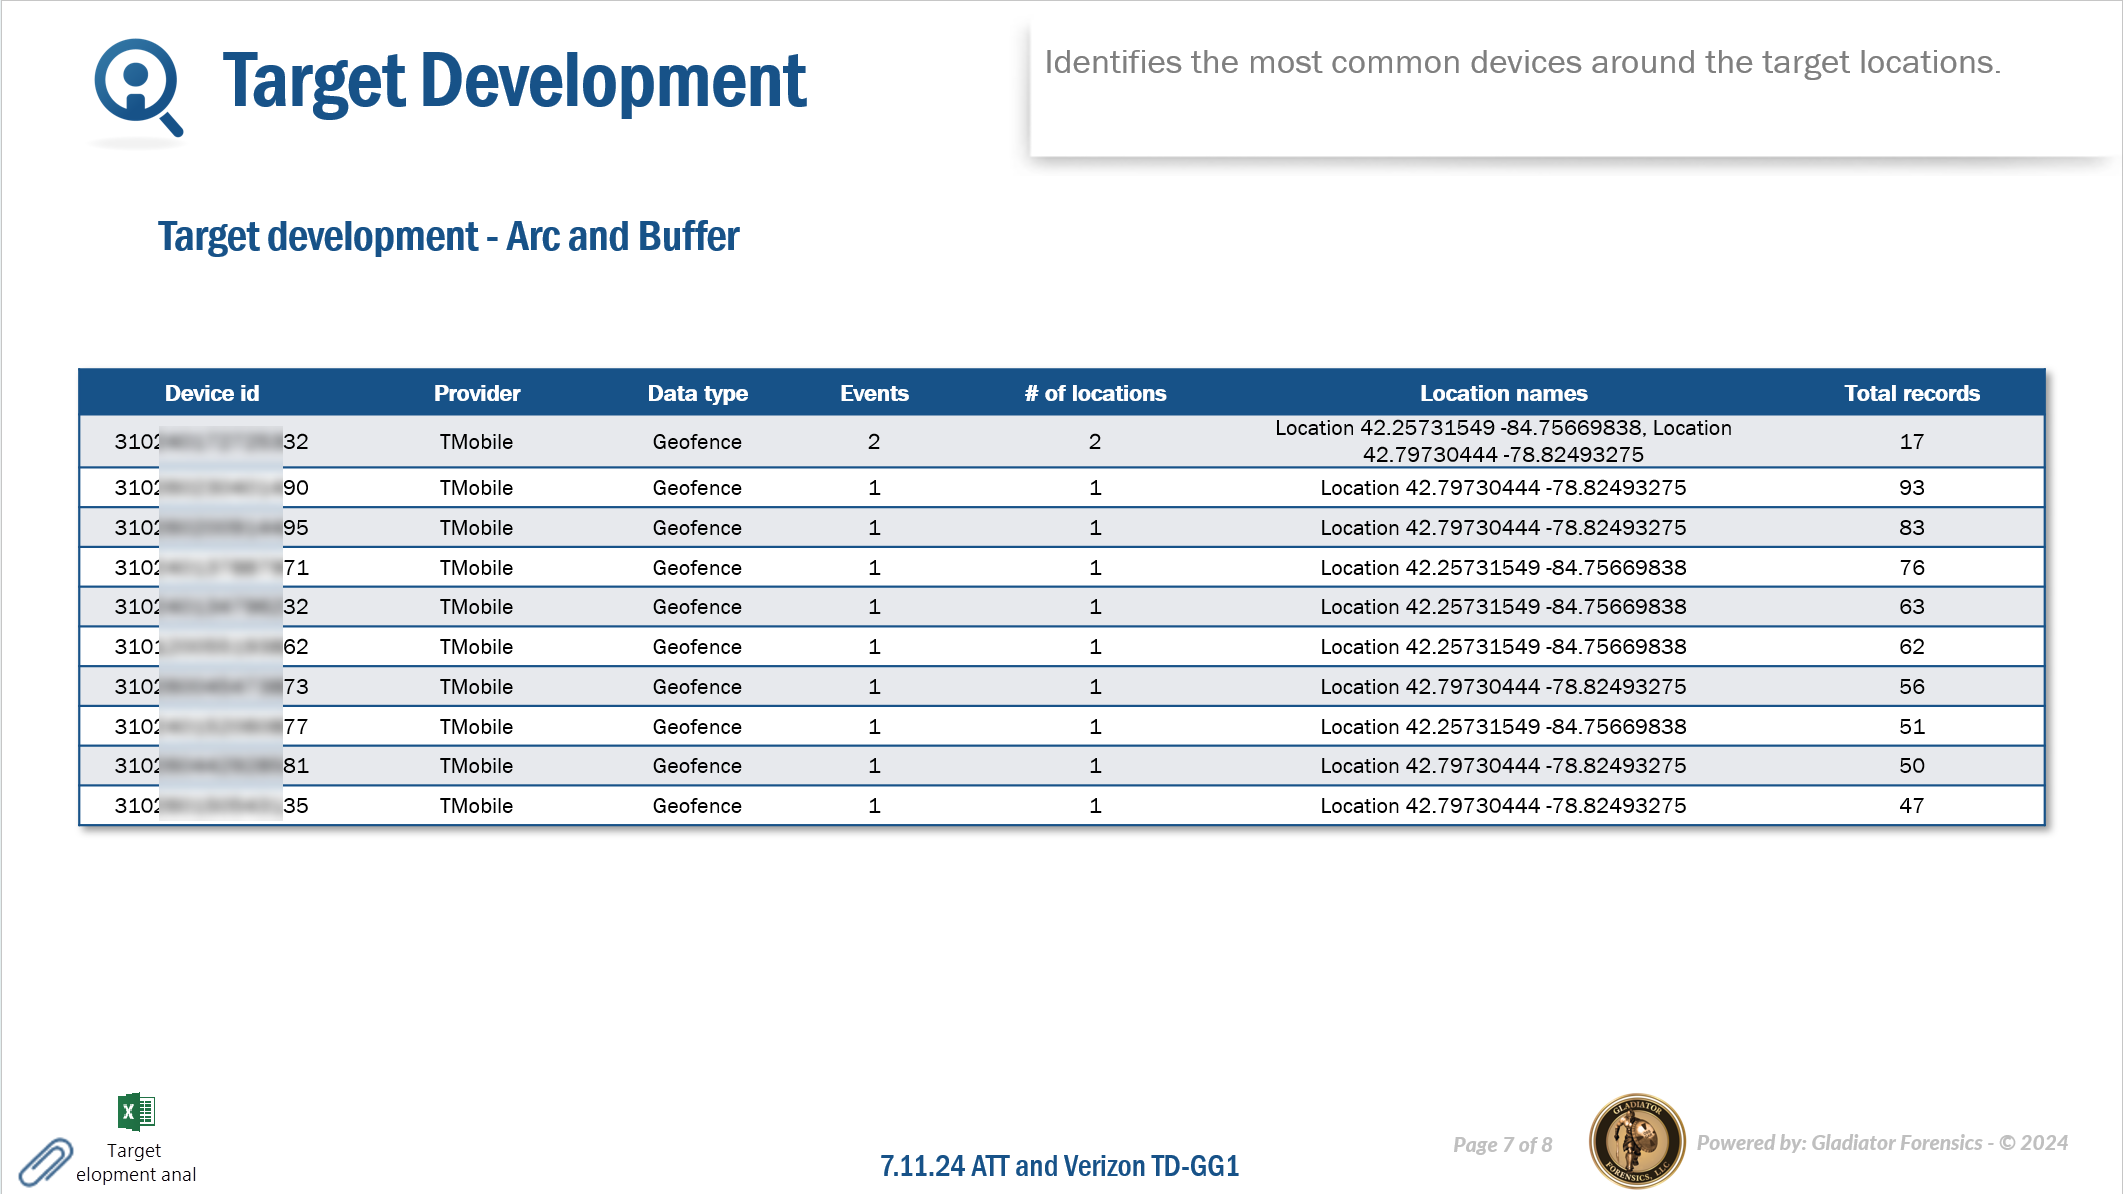
-
Target development - Arc and Buffer: this lists the top ten devices where the TA Arc and buffer intersects the target location.
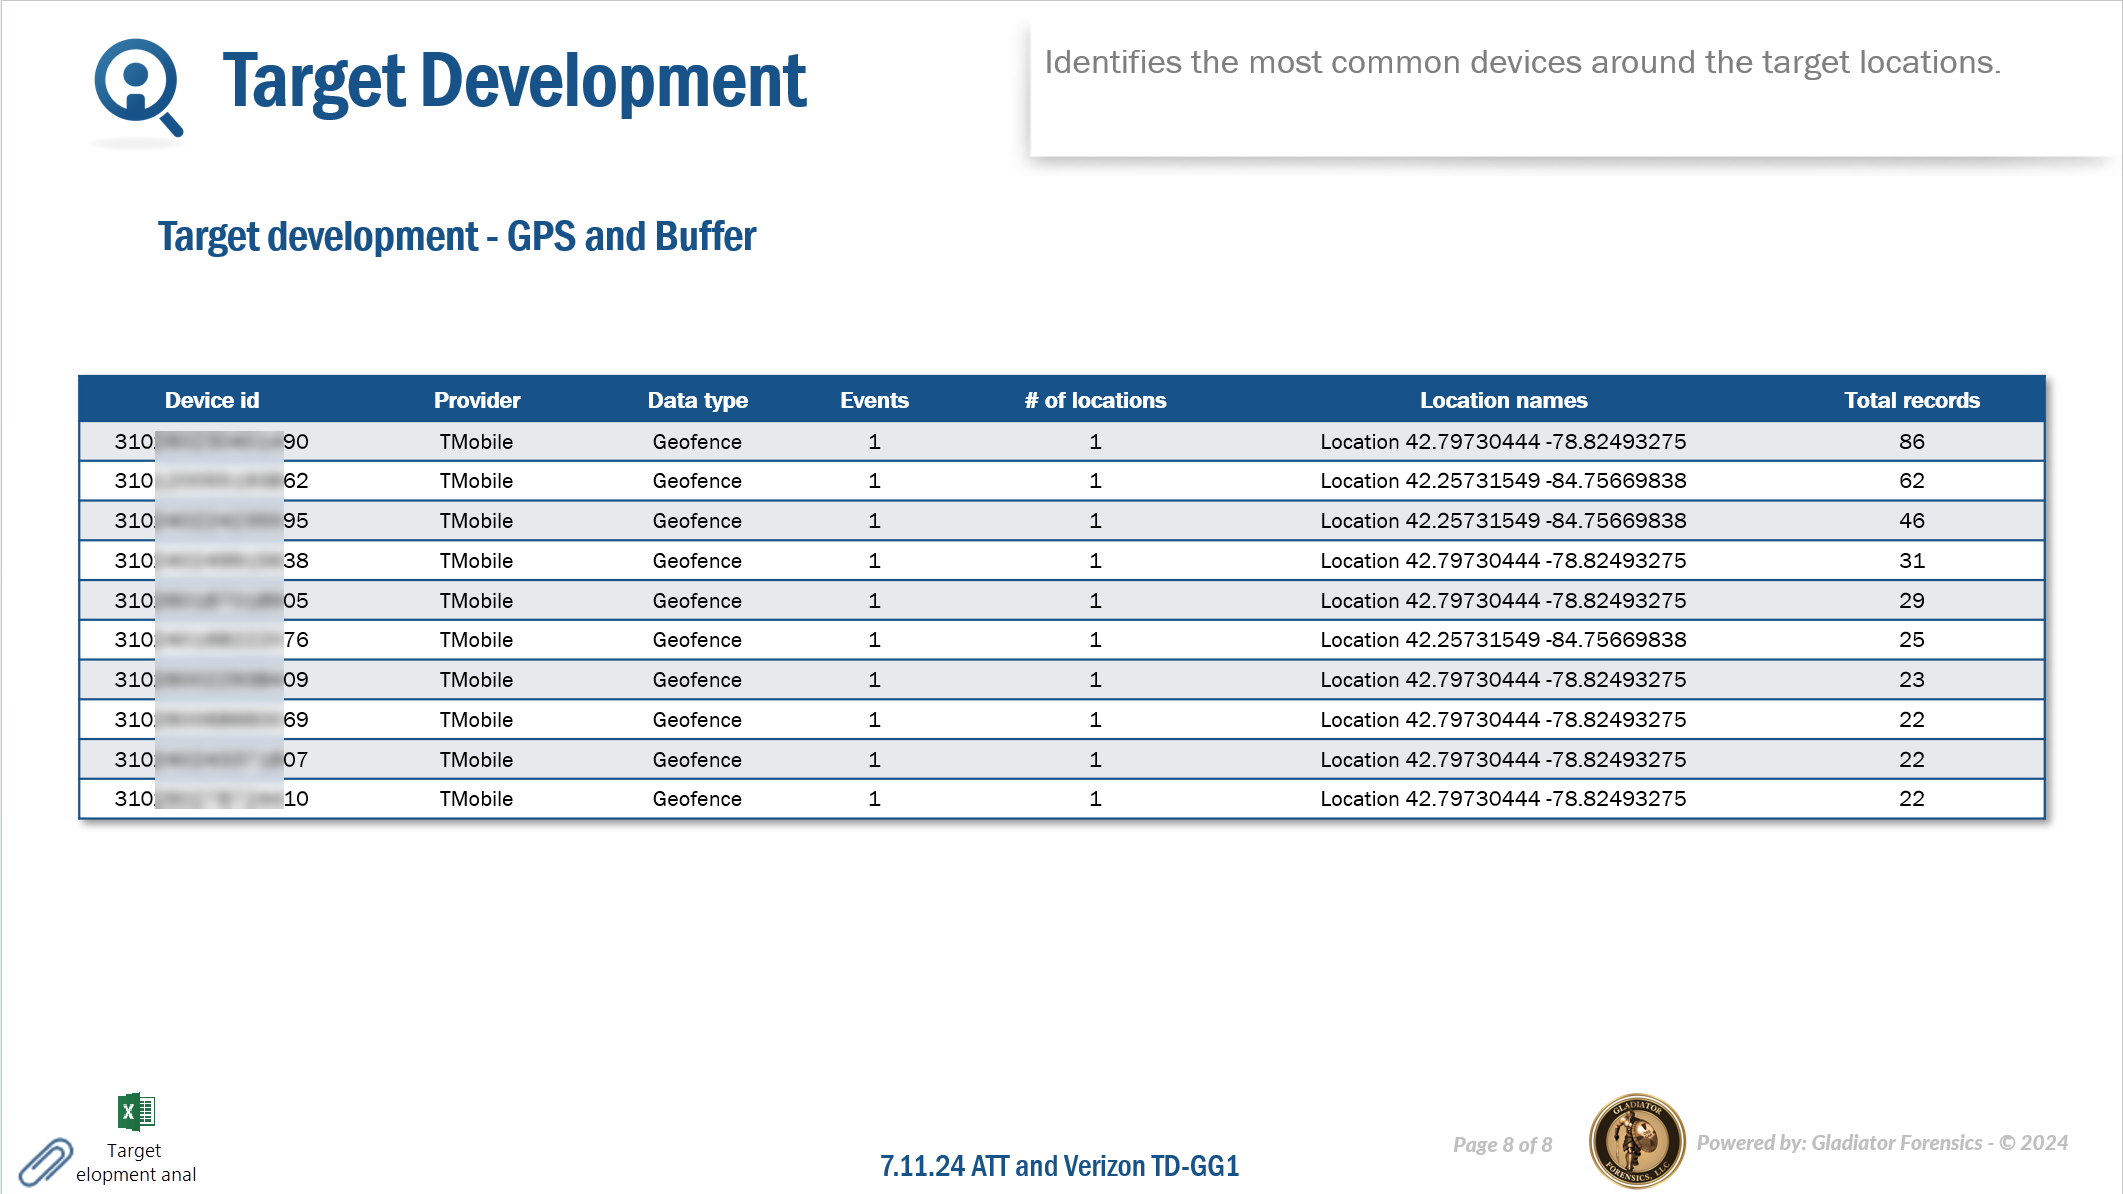
-
Target development - GPS and Buffer: this lists the top ten devices where the GPS ping is inside the target location buffer.
If you selected "Microsoft Excel" as an Output then each of these slides also contains a Microsoft Excel attachment that allows you to analyze the data further if required.
-
-
Location with Person's Device
If you add a device to the case then if the device was at a location it is shown on the "Location with Person's Device" section of the IQ packet. This section displays a map of the location and an executive summary table listing any added devices that were at that location. The location is defined by the Latitude /Longitude and its surrounding perimeter which is specified by the Location buffer. A link is provided within the map allowing you to view the map in greater detail on a browser along with the calls made by the device while in the location. There are also tables detailing the location information and the sector information.
The following graphic provides an example of this section in an IQ packet report which was output in the Microsoft PowerPoint format.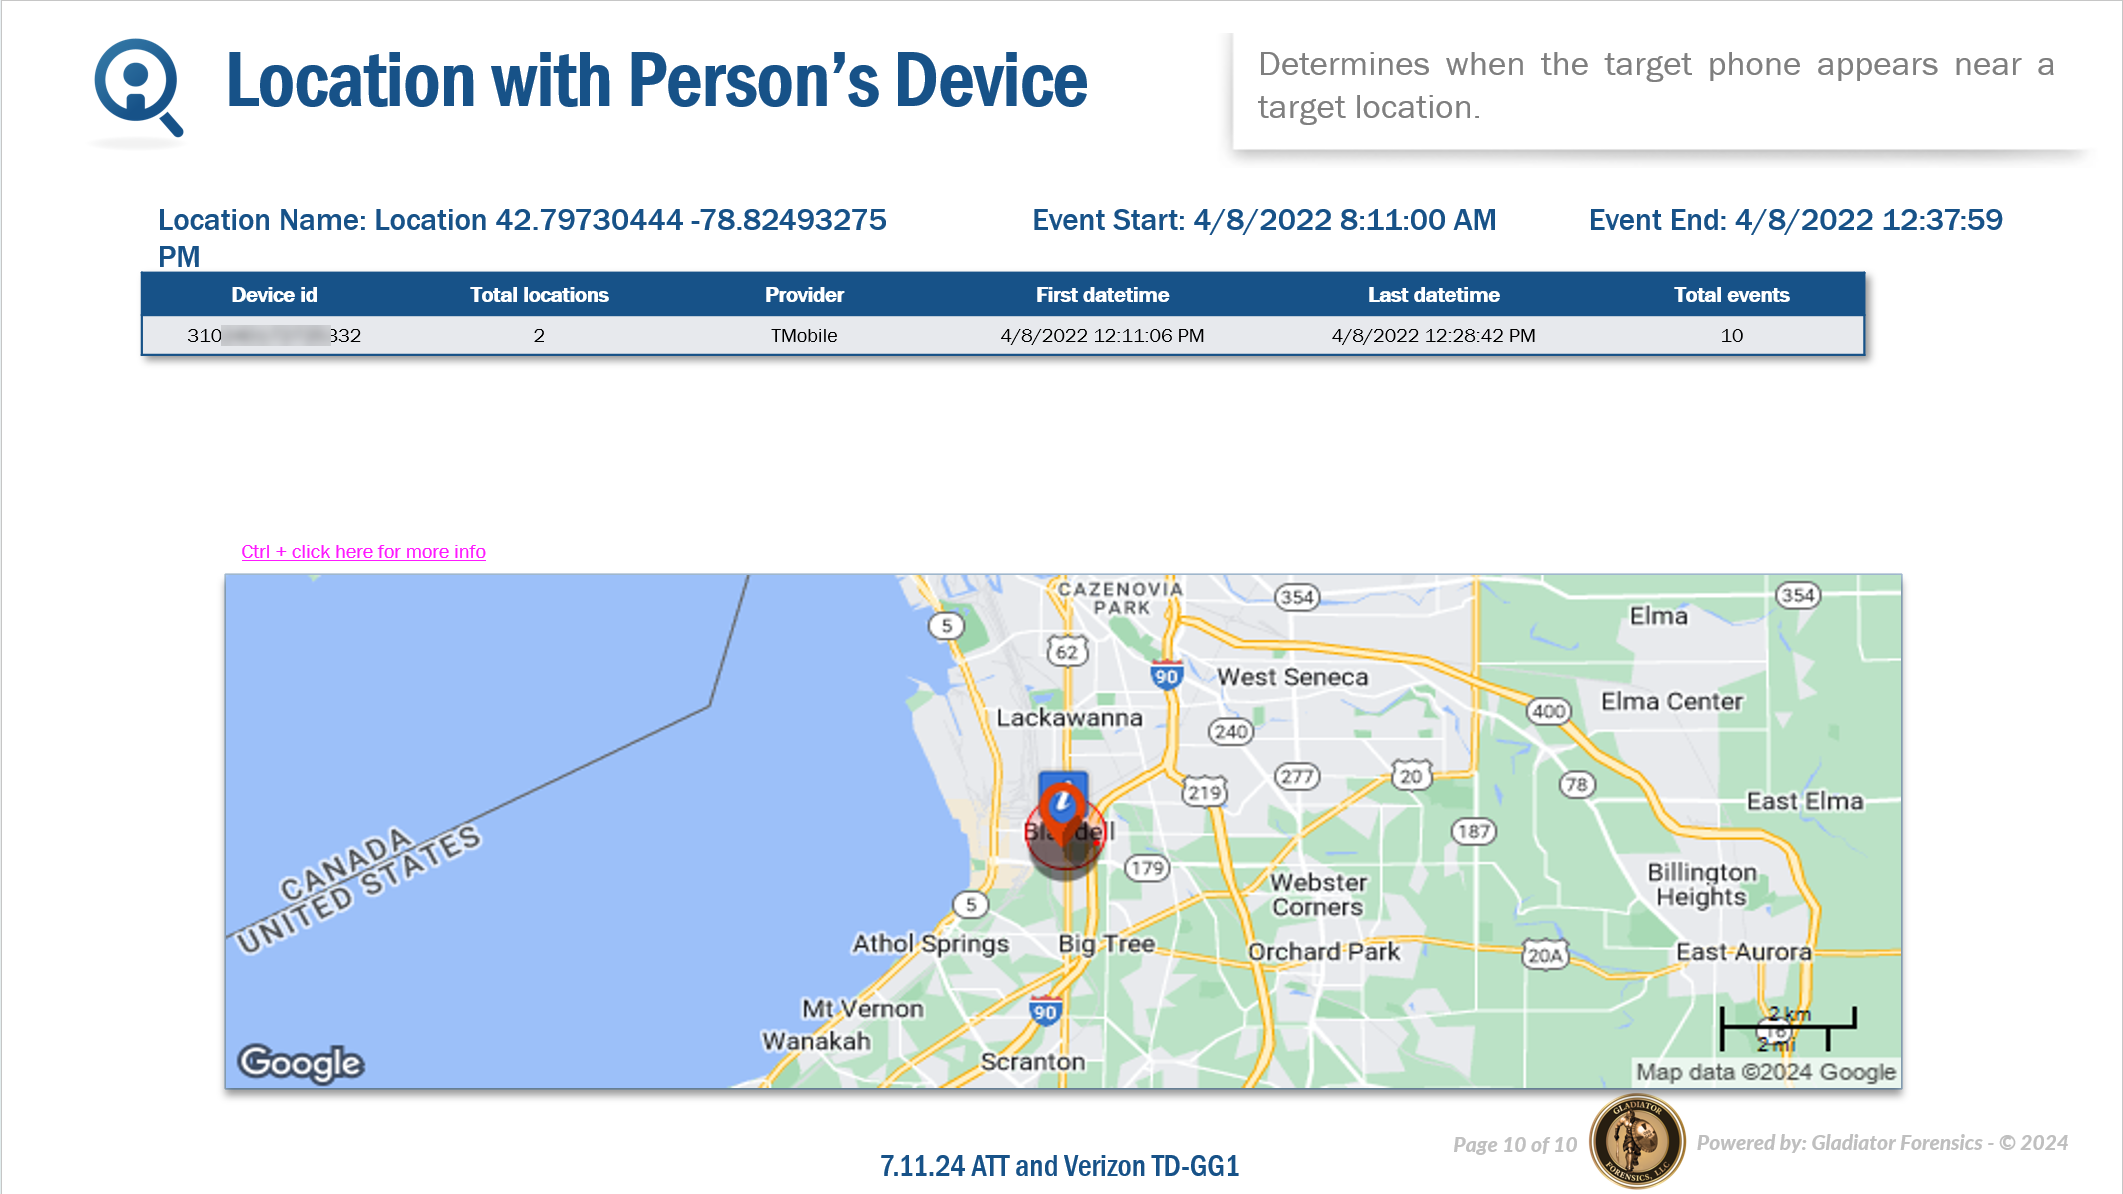
For each of the locations you selected on the New IQ packet screen this section of the IQ packet displays a map of each location along with the location details which were entered on the Locations of interest screen (Case management). This provides you with information on where cellular forensics could be performed.
A link is provided within the map allowing you to view the location in greater detail on a browser.
The following graphic provides an example of this section in an IQ packet report which was output in the Microsoft PowerPoint format.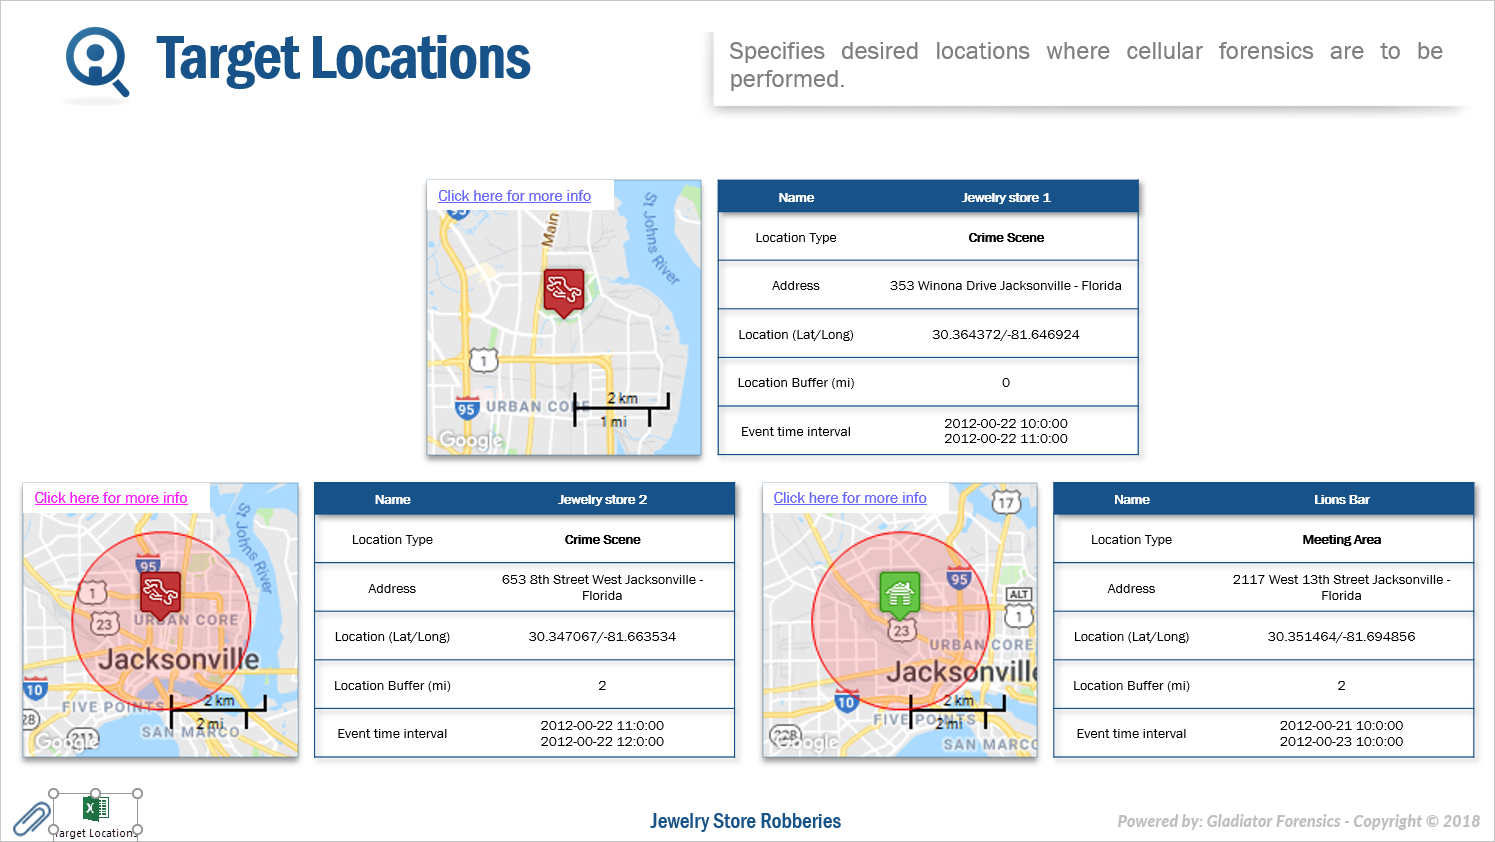
If you selected "Microsoft Excel" as an Output then this section also contains a Microsoft Excel attachment that allows you to analyze the data further if required. The following graphic provides an example of the Microsoft Excel attachment.

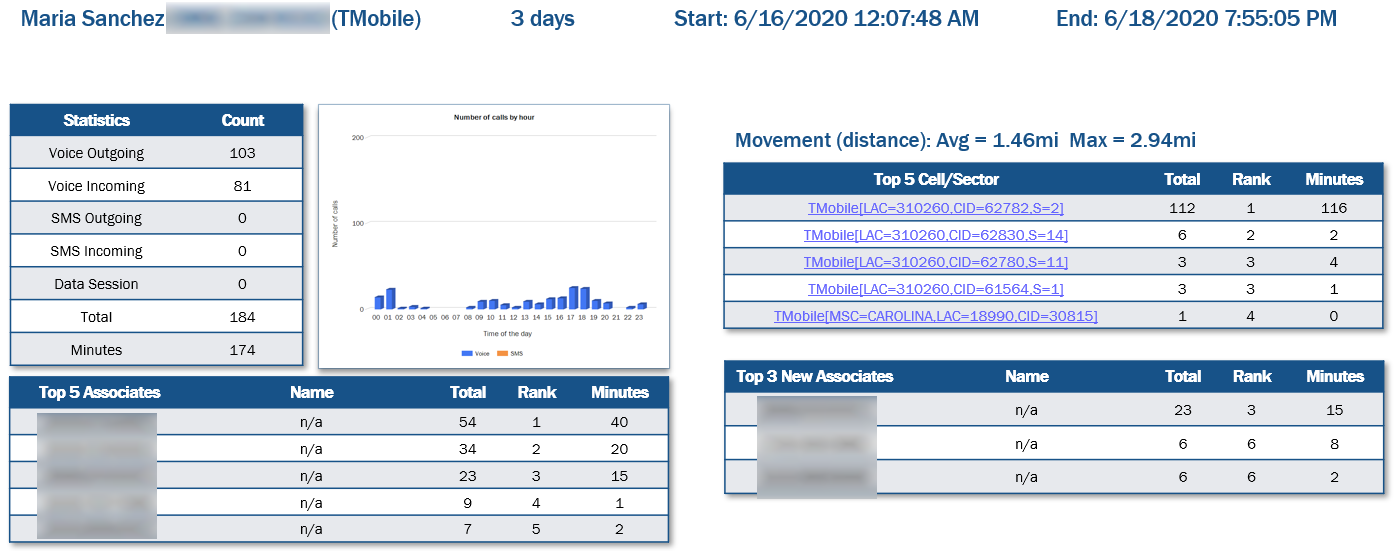
This section of the IQ packet is designed to highlight the target's activities during the selected time period. It also reveals any new associations. The packet includes: a summary of the number of calls, a graph of the number of calls by hour, the sectors used, the GPS locations, top five associates, and new associates during the time period.
You can select whether or not to use data from other cases in this IQ packet using Include X-Case analysis.
This section of the IQ packet is designed to be used with the OSS-SRN Express Portal.
It highlights the target's activities and communications during the selected time period. The packet includes: a summary of the number of calls, a graph of the number of calls by hour, the sectors used, the first and last sectors used, and the most frequent numbers.
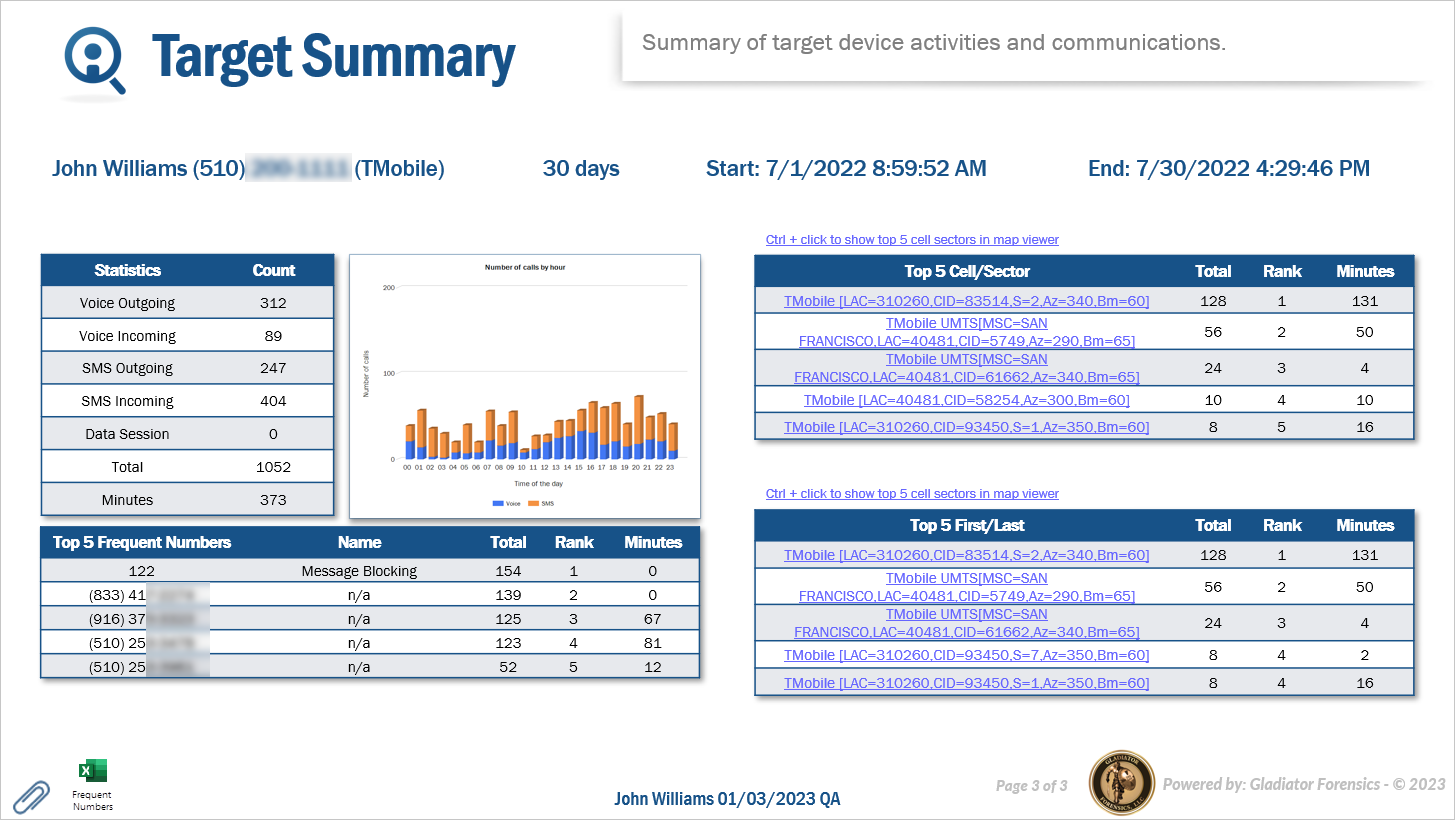
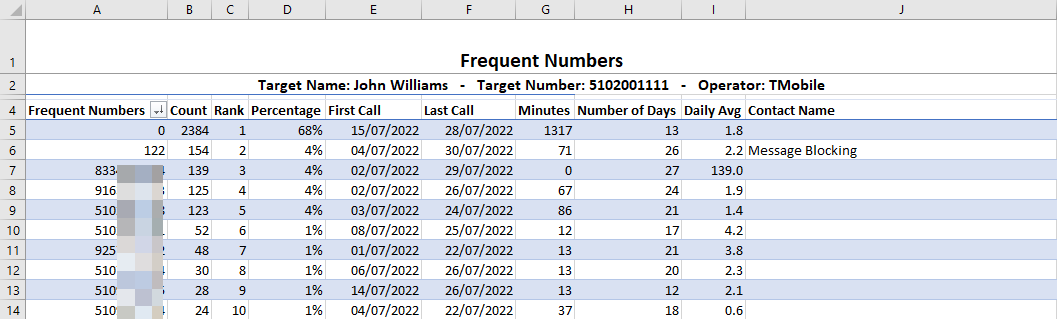
If you selected "Microsoft Excel" as an Output then this IQ packet section also provides a Microsoft Excel attachment that allows you to analyze the frequent number data further if required. The following graphic provides an example of the Microsoft Excel attachment.
This section of the IQ packet is designed to be used with the OSS-SRN Express Portal.
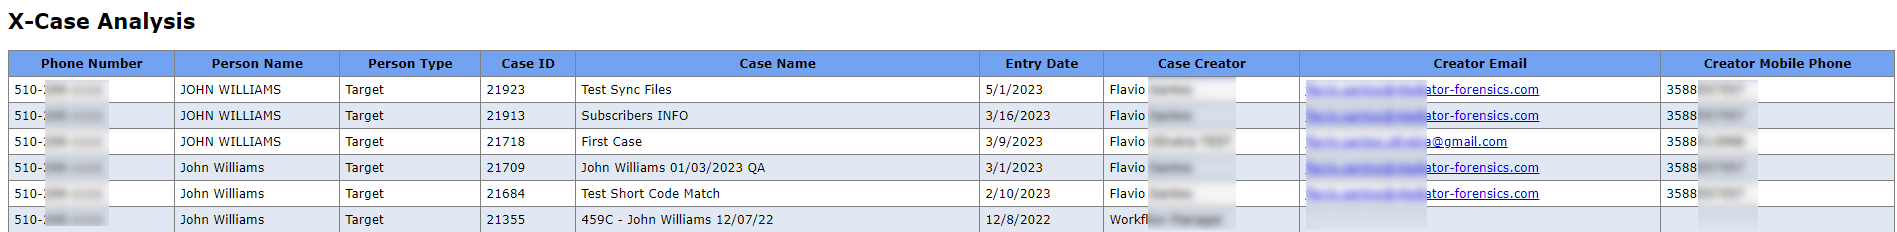
It provides the output for the OSS-SRN Express Portal's X-Case Analysis. It contains:
-
the target or associate phone number from your case.
-
if known, the name associated with the phone number in the matched case.
-
the person type in the matched case, either a Target or Associate. A Target is a person entered into the matched case. An Associate means the phone number was located in the matched case but within the phone record of a target person.
-
the matched case's case id , case name and case creation date. The case creation date is useful as one with a similar date may be more important, or if the date is older you can determine if the phone belonged to the same person.
-
the name, email address and phone number of the person who created the matched case.
-
White list matches. The White list is a database managed in OSS-ESPA where common identifiers such as hotel, motels, rental car companies, schools, credit card companies, banks, FFL dealers, jail numbers, probation and parole numbers are stored. If there is a match to the White List then these results are listed. This can provide you with useful leads to follow up on, for example a hotel phone number could indicate where a person is currently sleeping, or an airline number could provide the details of a booked flight.