Viewing a phone's last and most frequent events
The G-Scout App provides you with the details of a phone's last and most frequent events including:
-
the last towers used
-
the most frequently used towers
-
last GPS pings
-
last associates the phone was in contact with
-
the most frequent associates
You can view a phone's last and most frequent events using three methods, depending on whether you are monitoring all phones or are monitoring phones from a specific case or mission.
-
To view a phone's last and most frequent events when you are monitoring all phones:


-
To view a phone's last and most frequent events when you are monitoring a specific case:

-
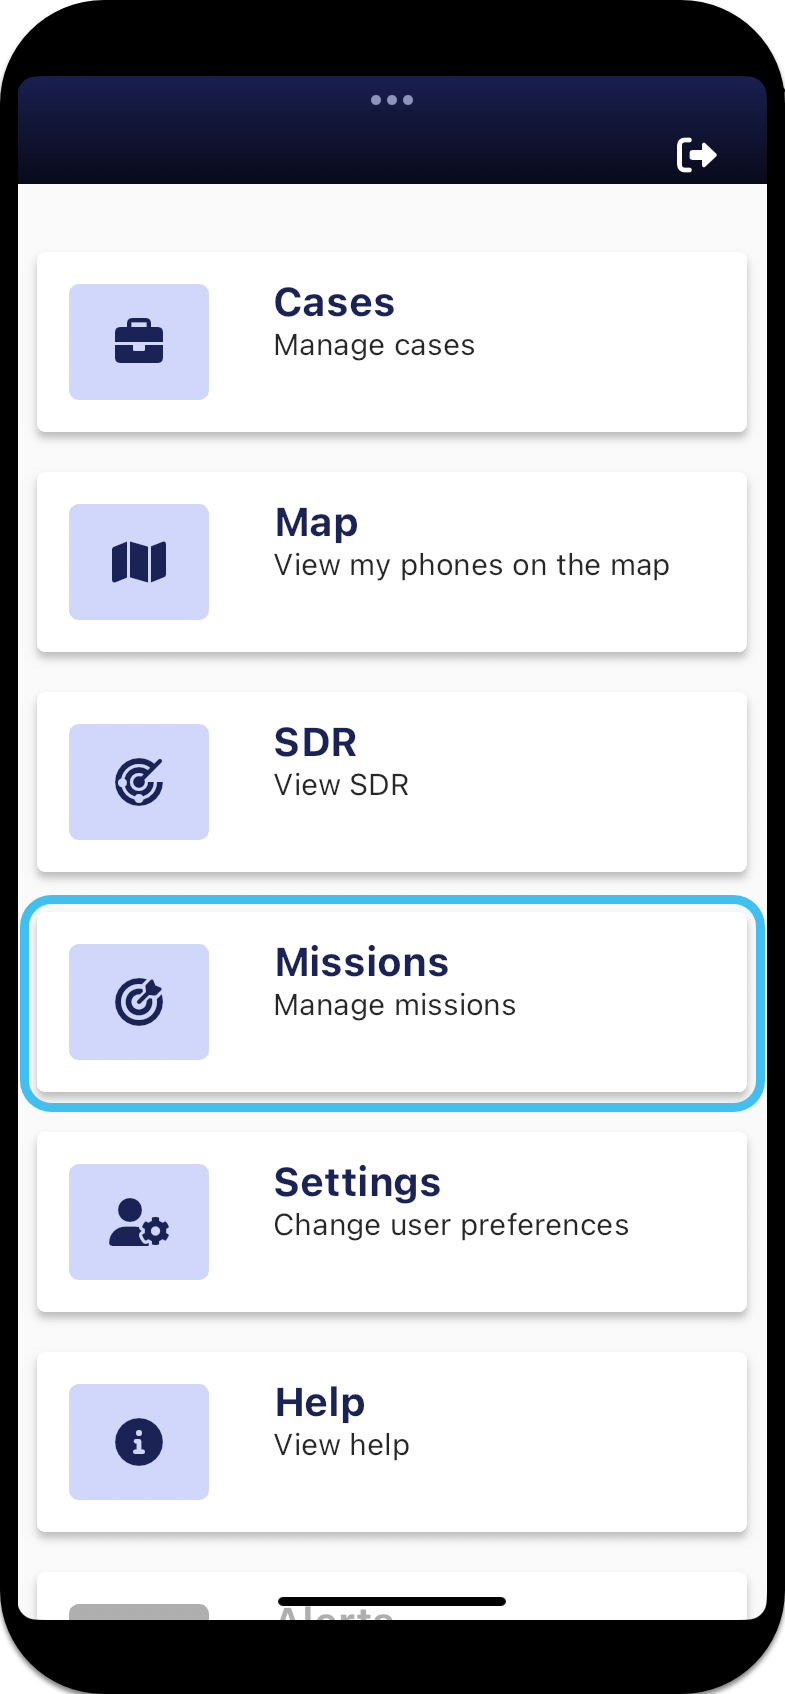
To view a phone's last and most frequent events when you are on a mission:

-
Firstly, open the Events panel. You can open the Events panel using three methods, depending on whether you are monitoring all phones or are monitoring phones from a specific case or mission. If you are monitoring:
-
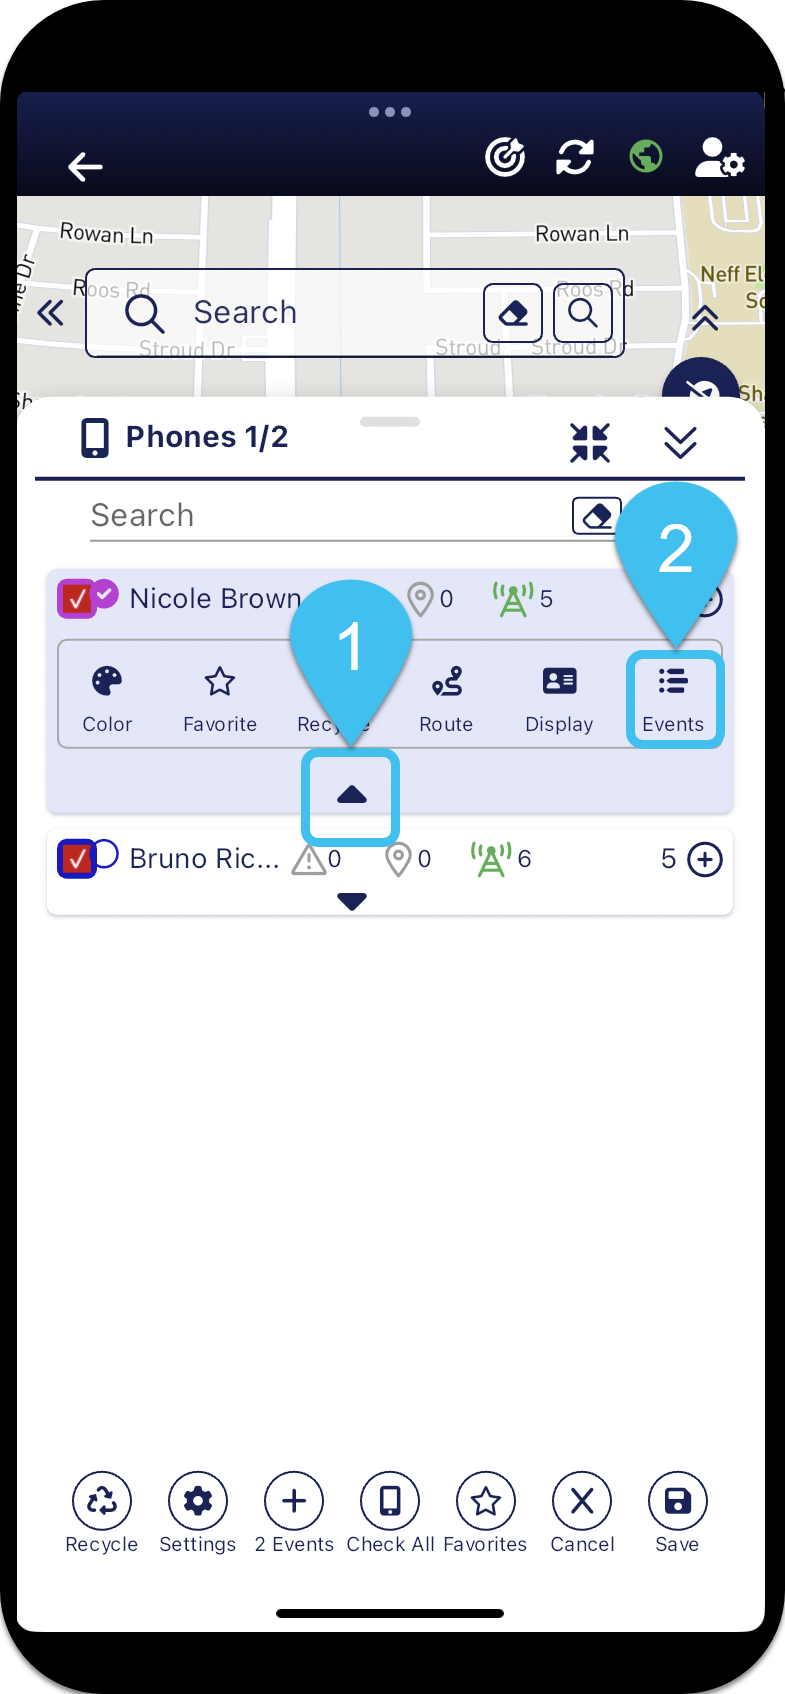
all the phones, then:
-
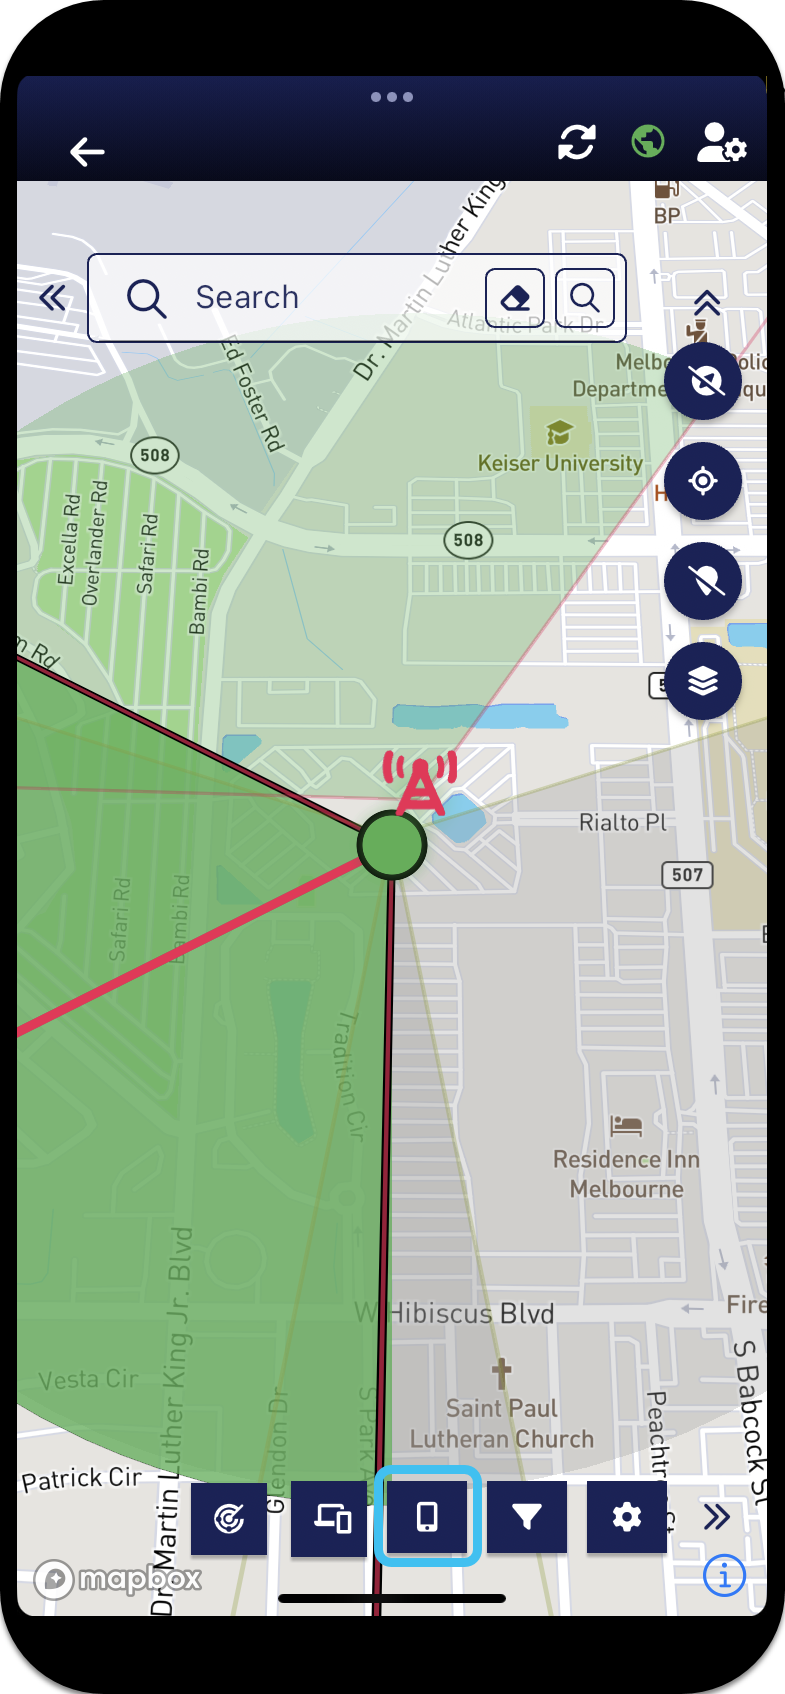
On the bottom of the screen, tap
 . The Phones panel opens.
-
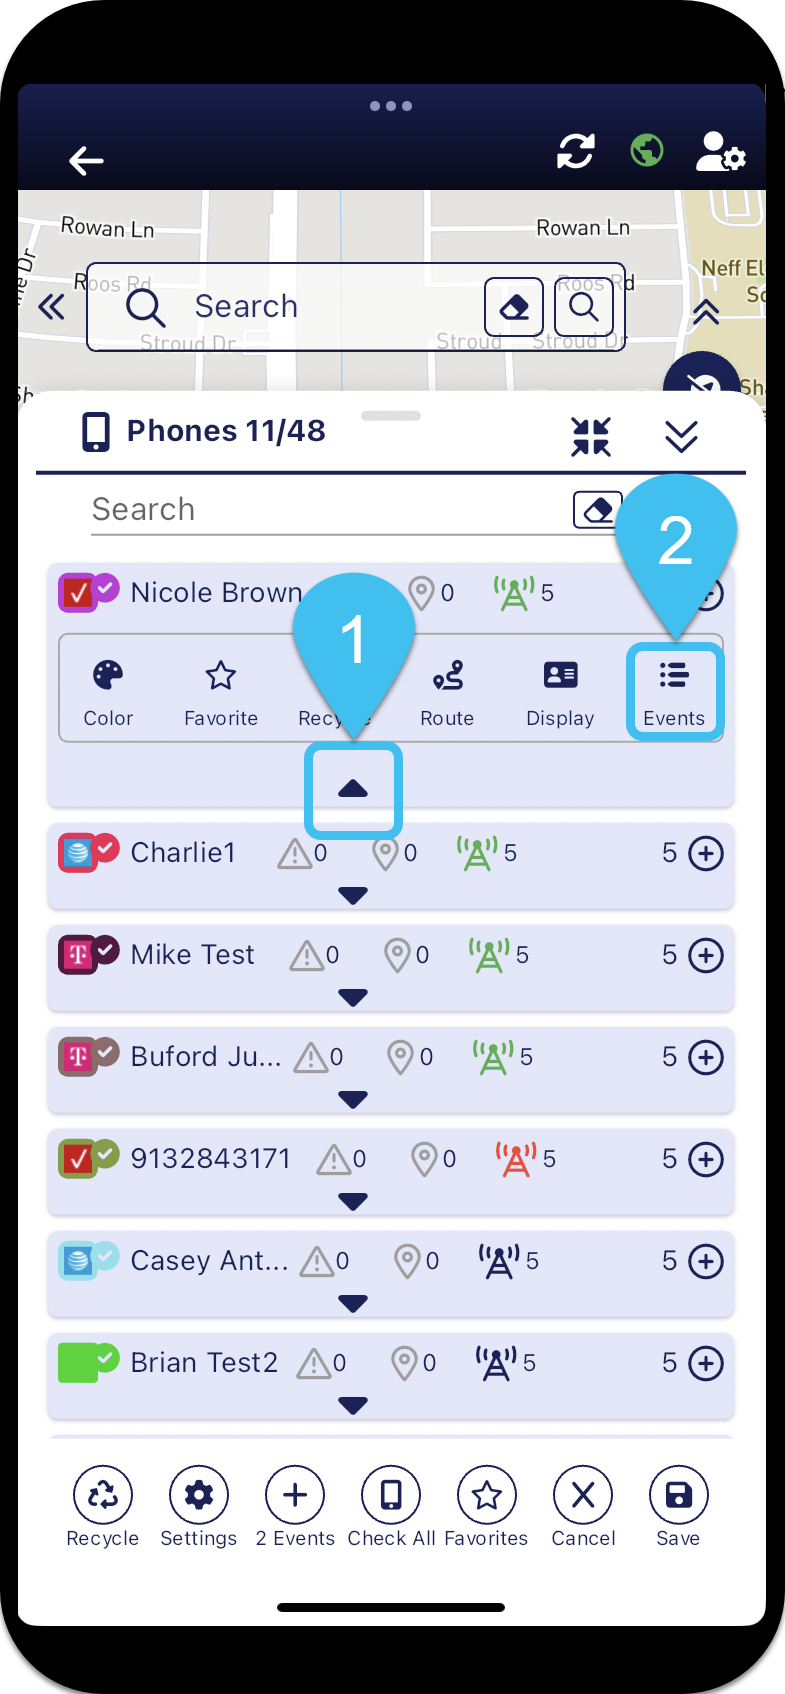
On the phone's row tap
 , then tap
  .
. 
The phone's Events panel opens.

-
-
only the phones within a specific case, then:
-
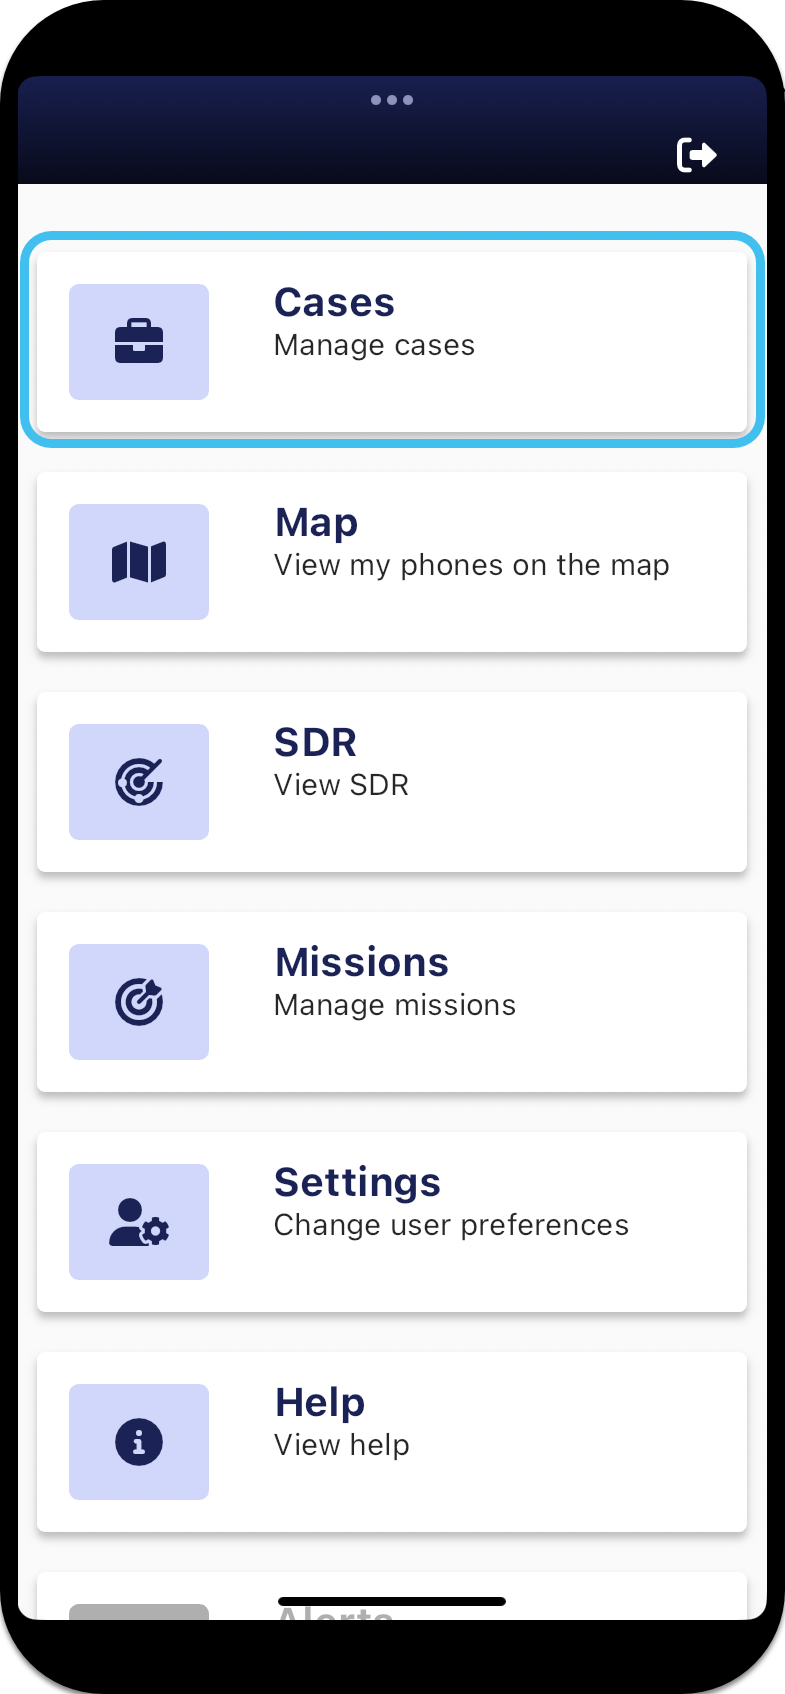
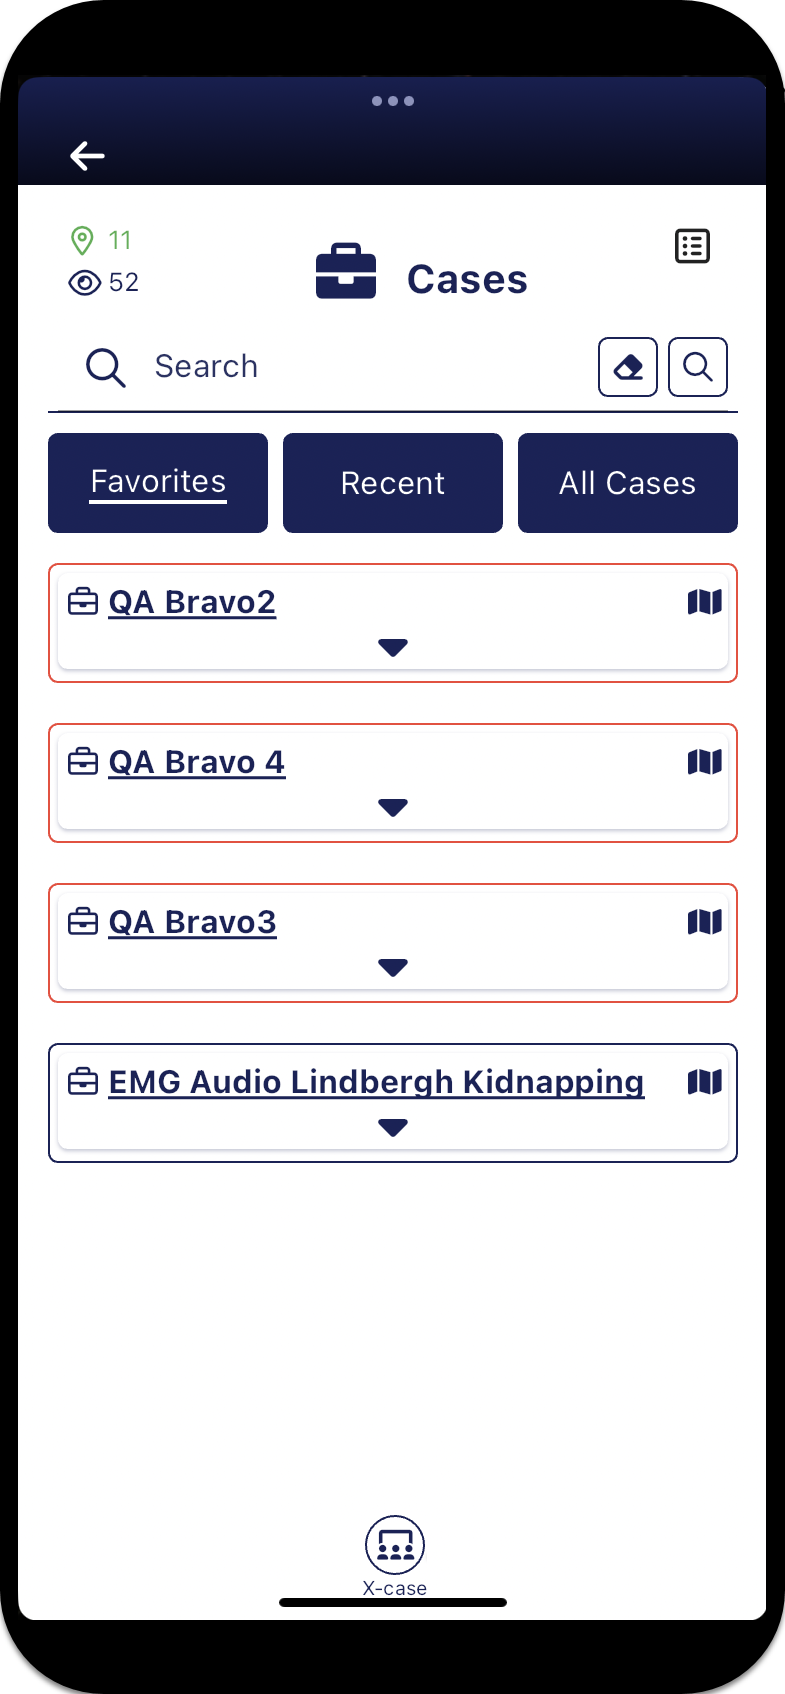
From the Home screen tap Cases.

The Cases screen opens.

-
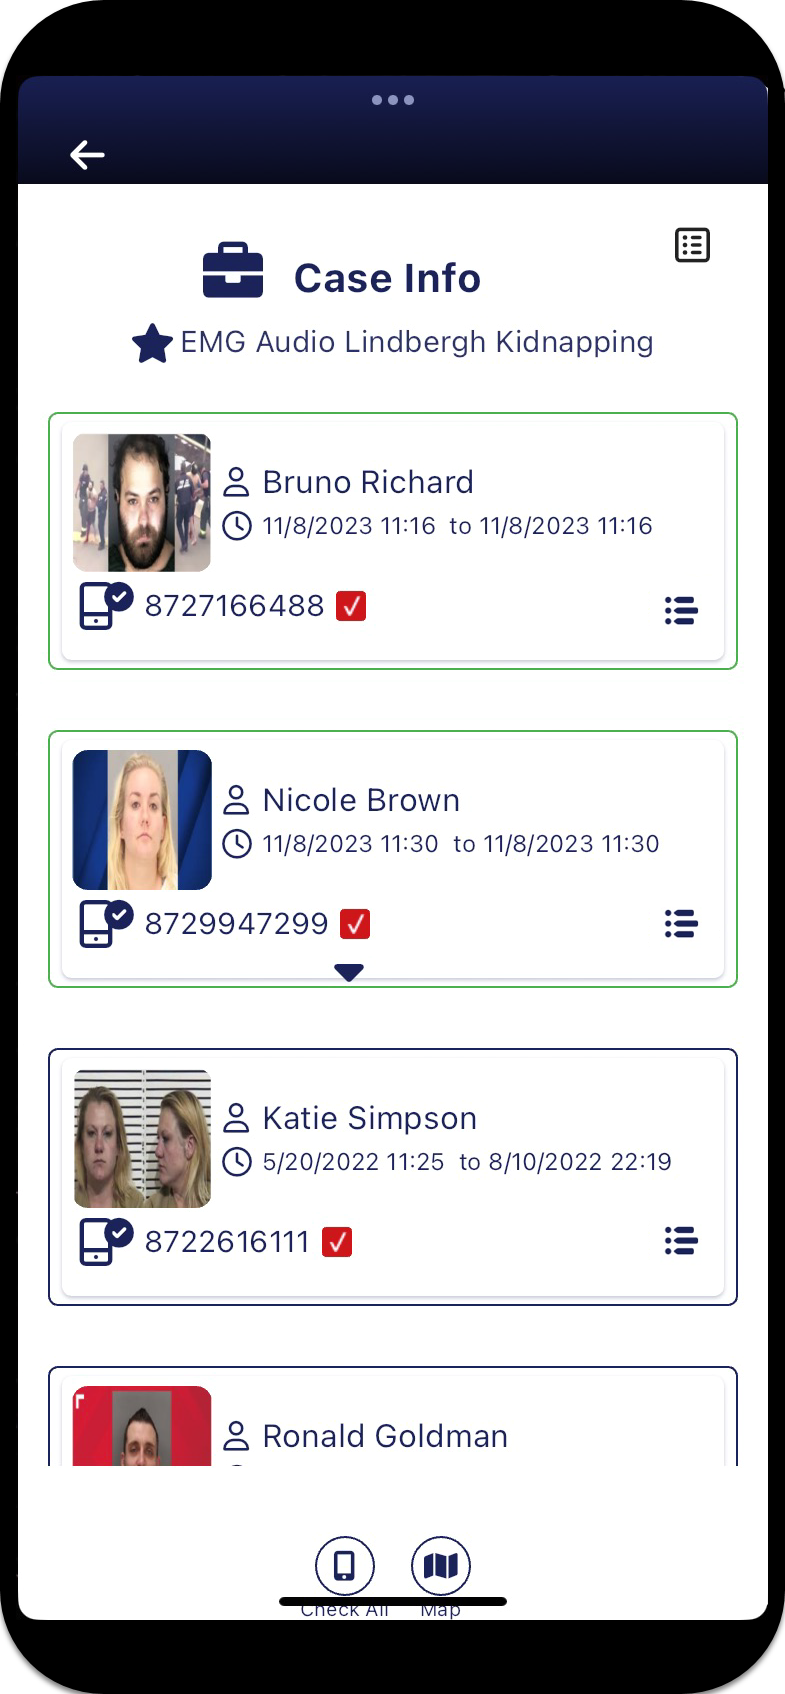
Tap the case name.
The Case Info screen opens.

-
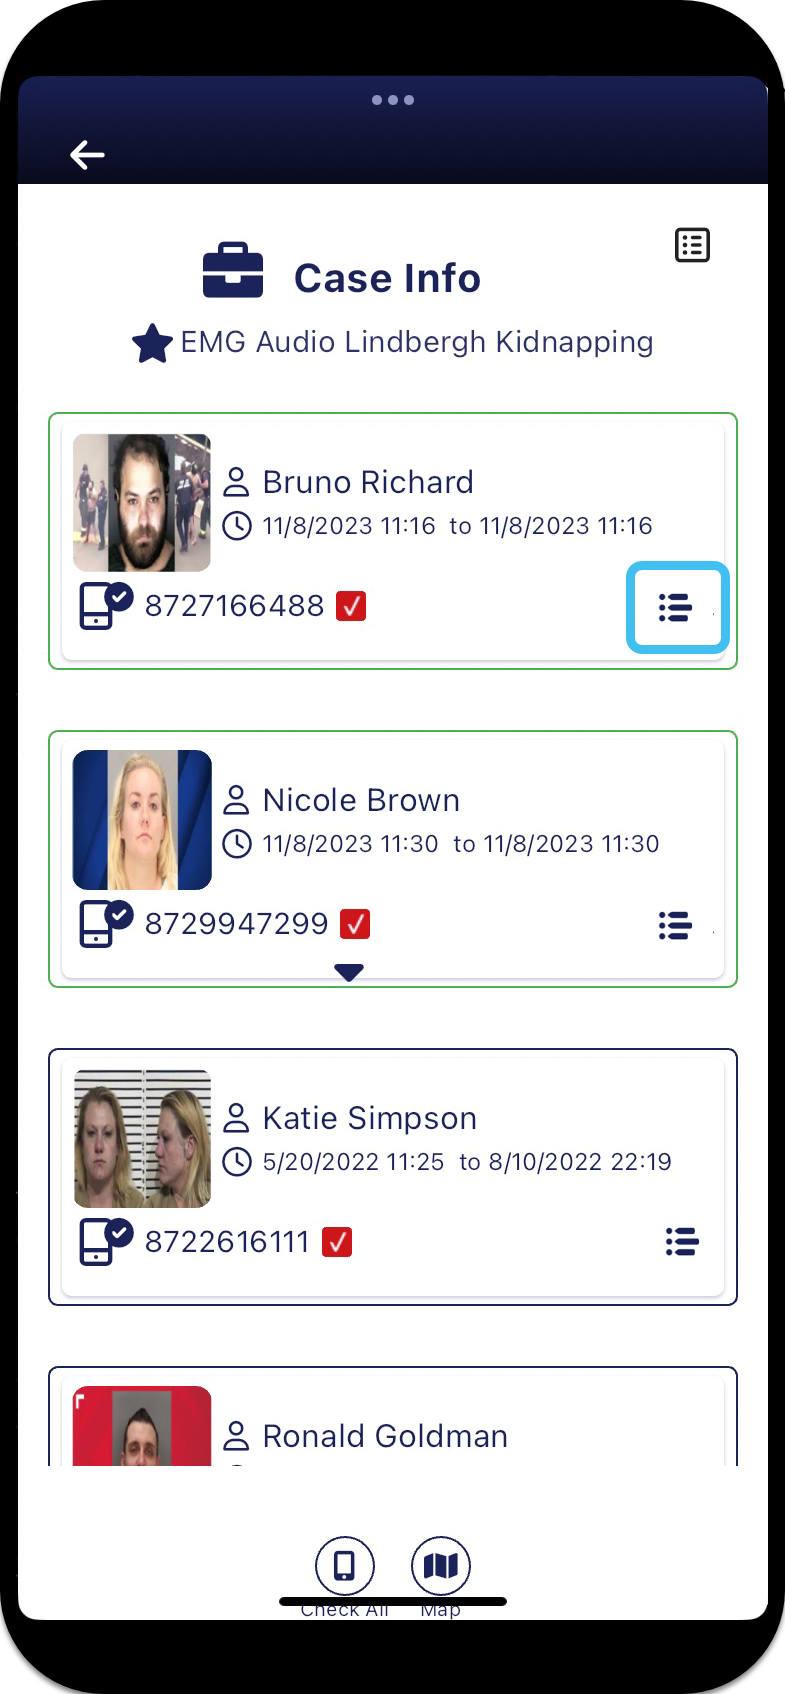
Tap
for the phone whose events you want to view. 
The phone's Events panel opens.

-
-
only the phones within a specific mission, then:
-
From the Home screen tap Missions.

The Missions screen opens.
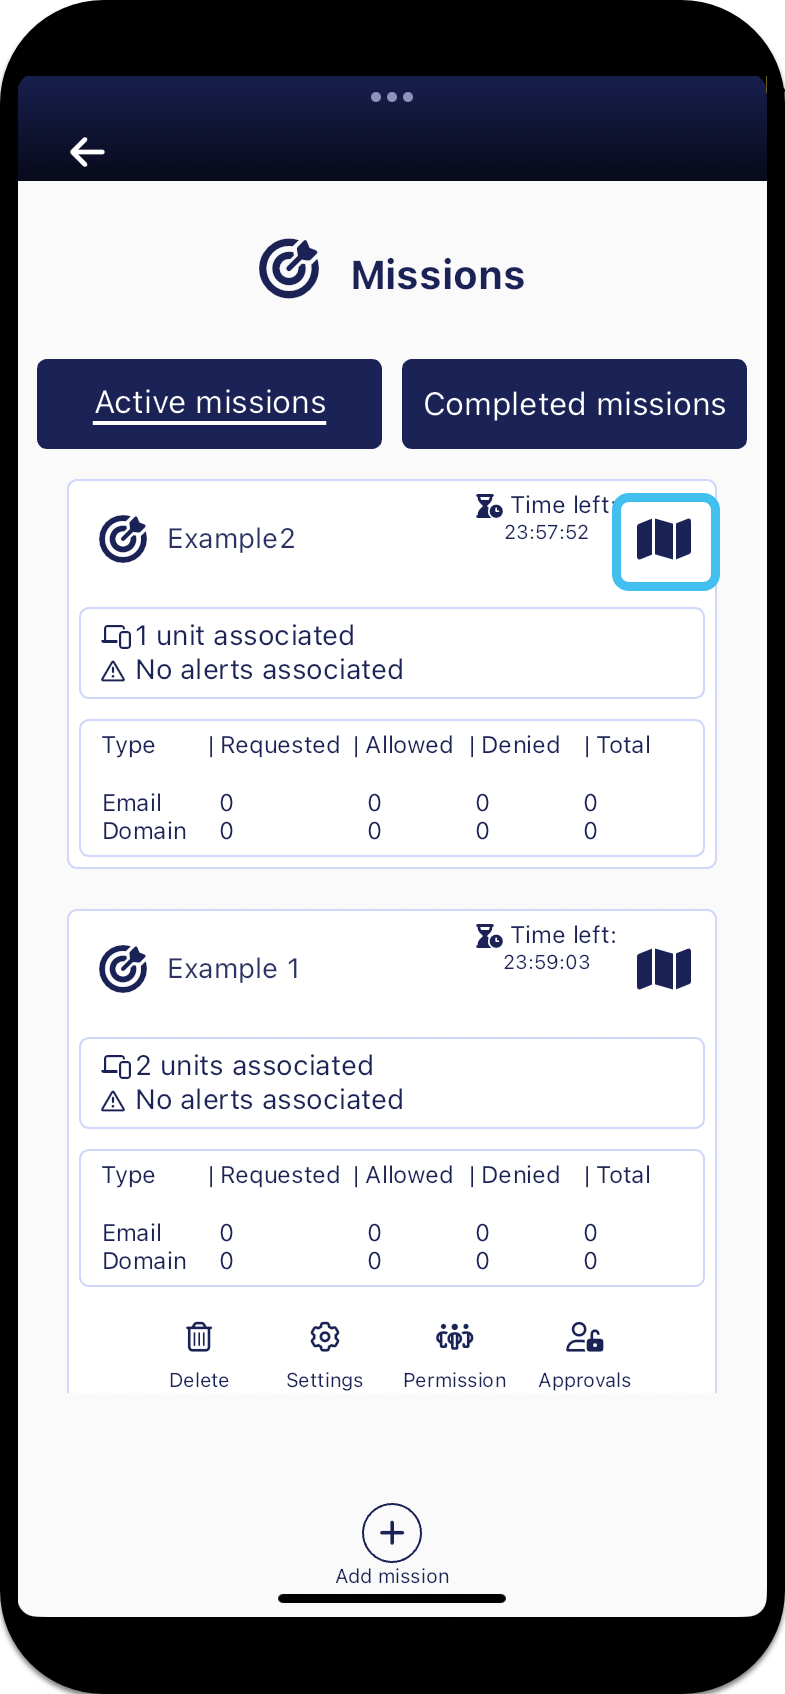
-
For the mission of interest, tap
 .
. 
The Sentinel mission map screen opens.
-
On the phone's row tap
, then tap . 
The phone's Events panel opens.

-
-
-
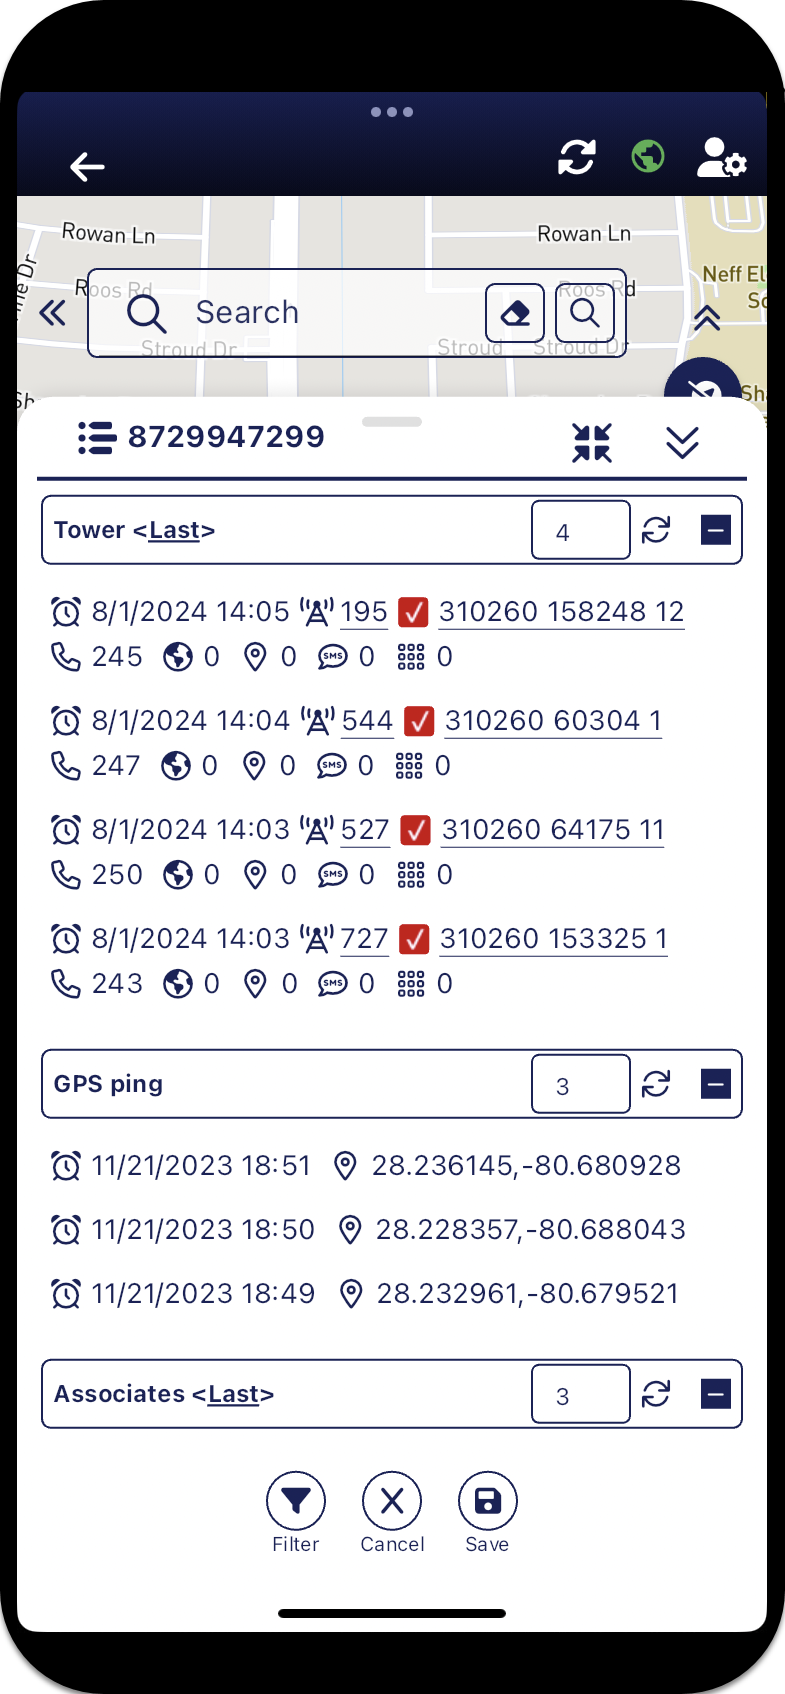
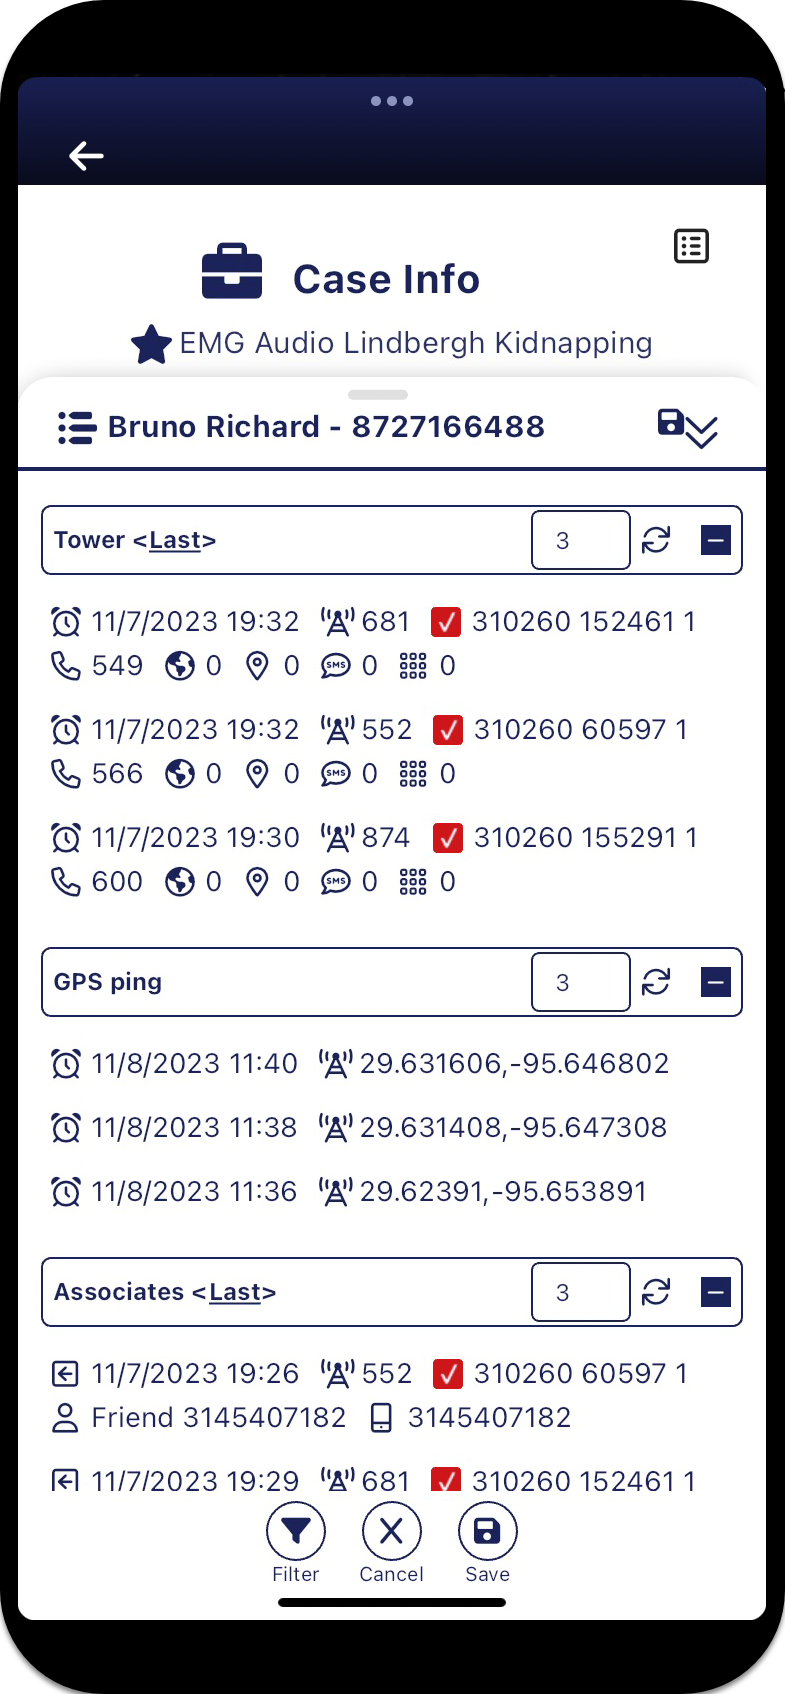
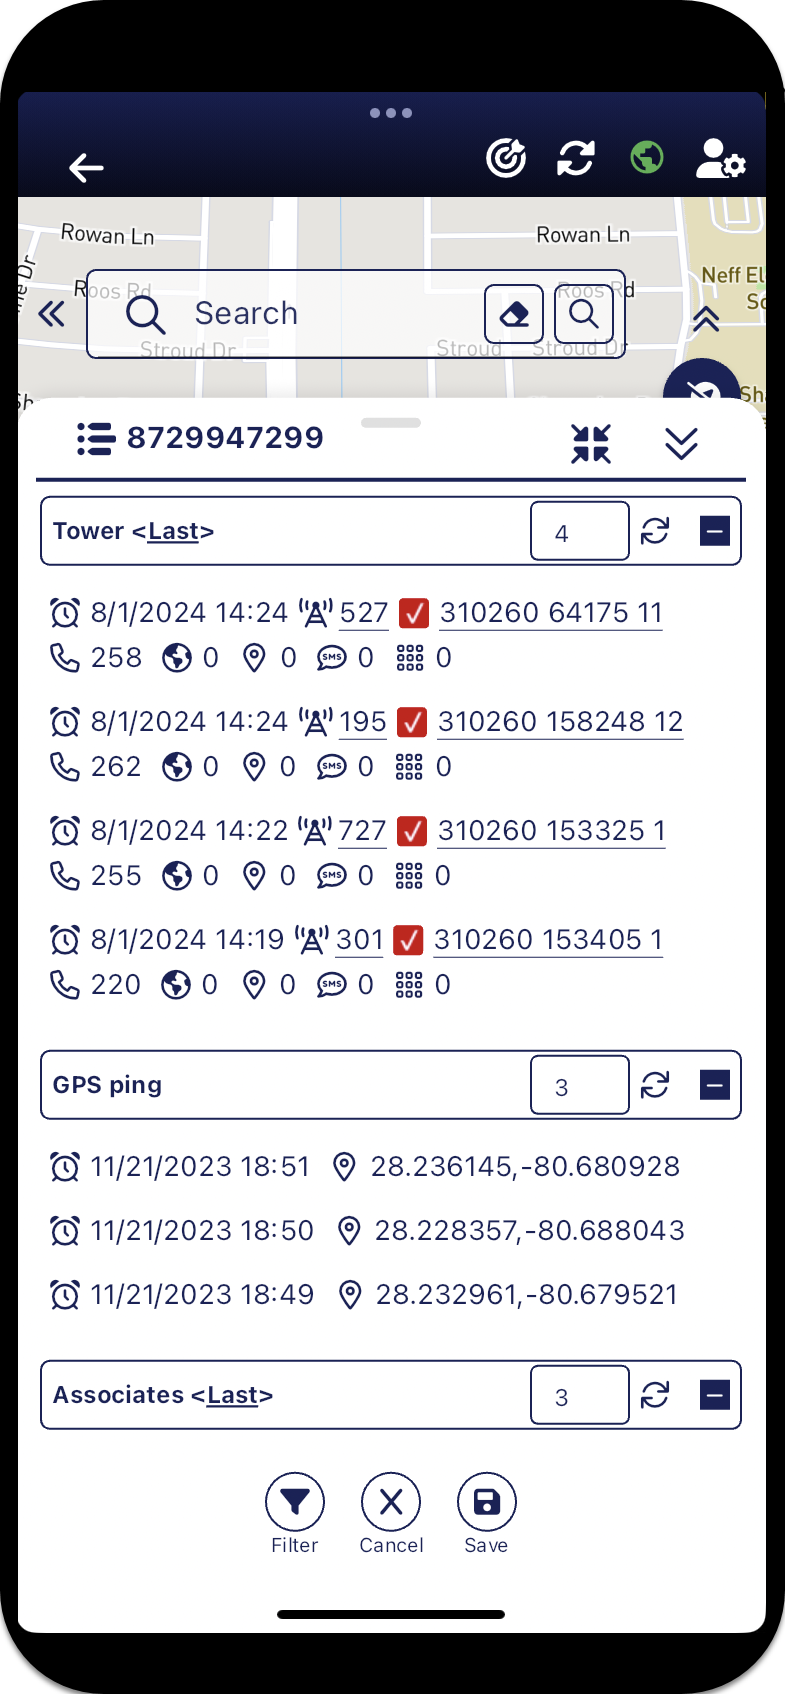
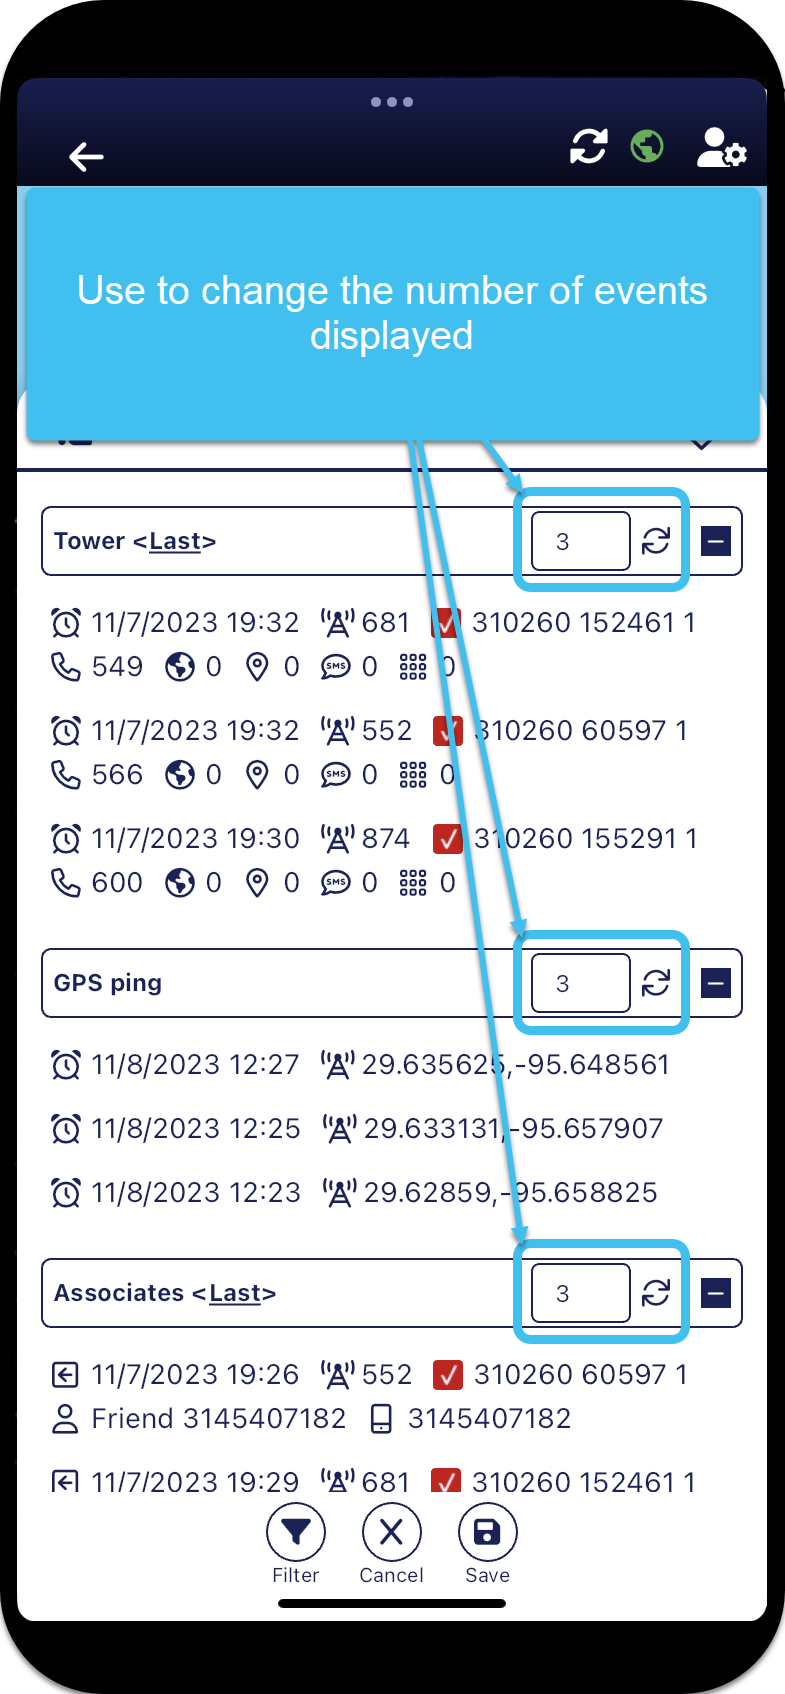
By default the panel displays the last 3 events for the last towers, GPS ping and last associates. If you want to view:
-
more or less results enter the required number, then tap
 .
. 
-
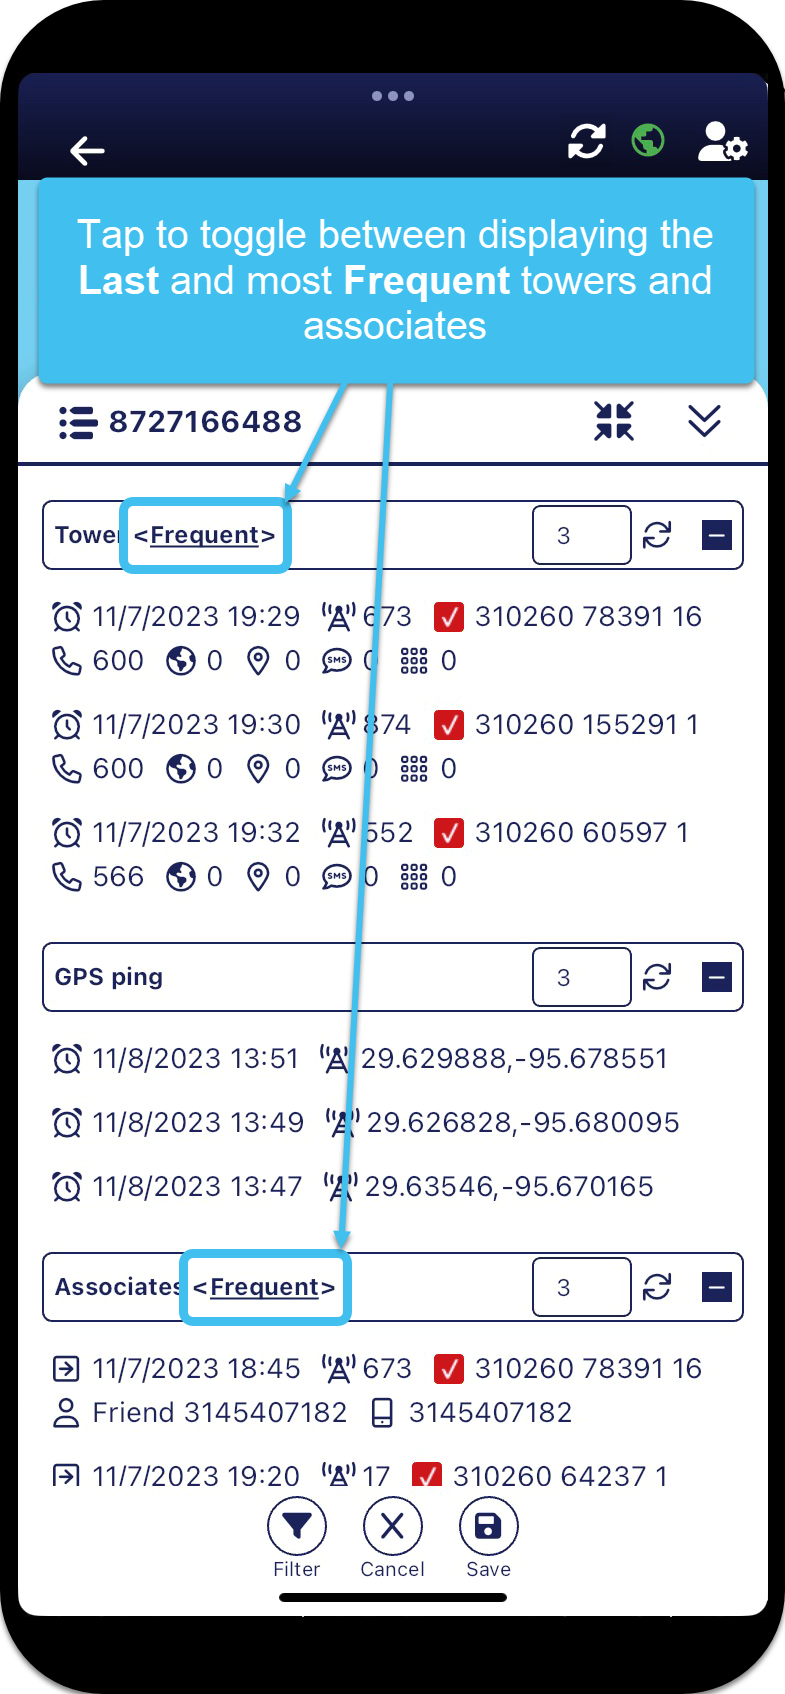
the most frequent towers or the most frequent associates, rather than the last, tap <Last> to toggle to <Frequent>.

-
-
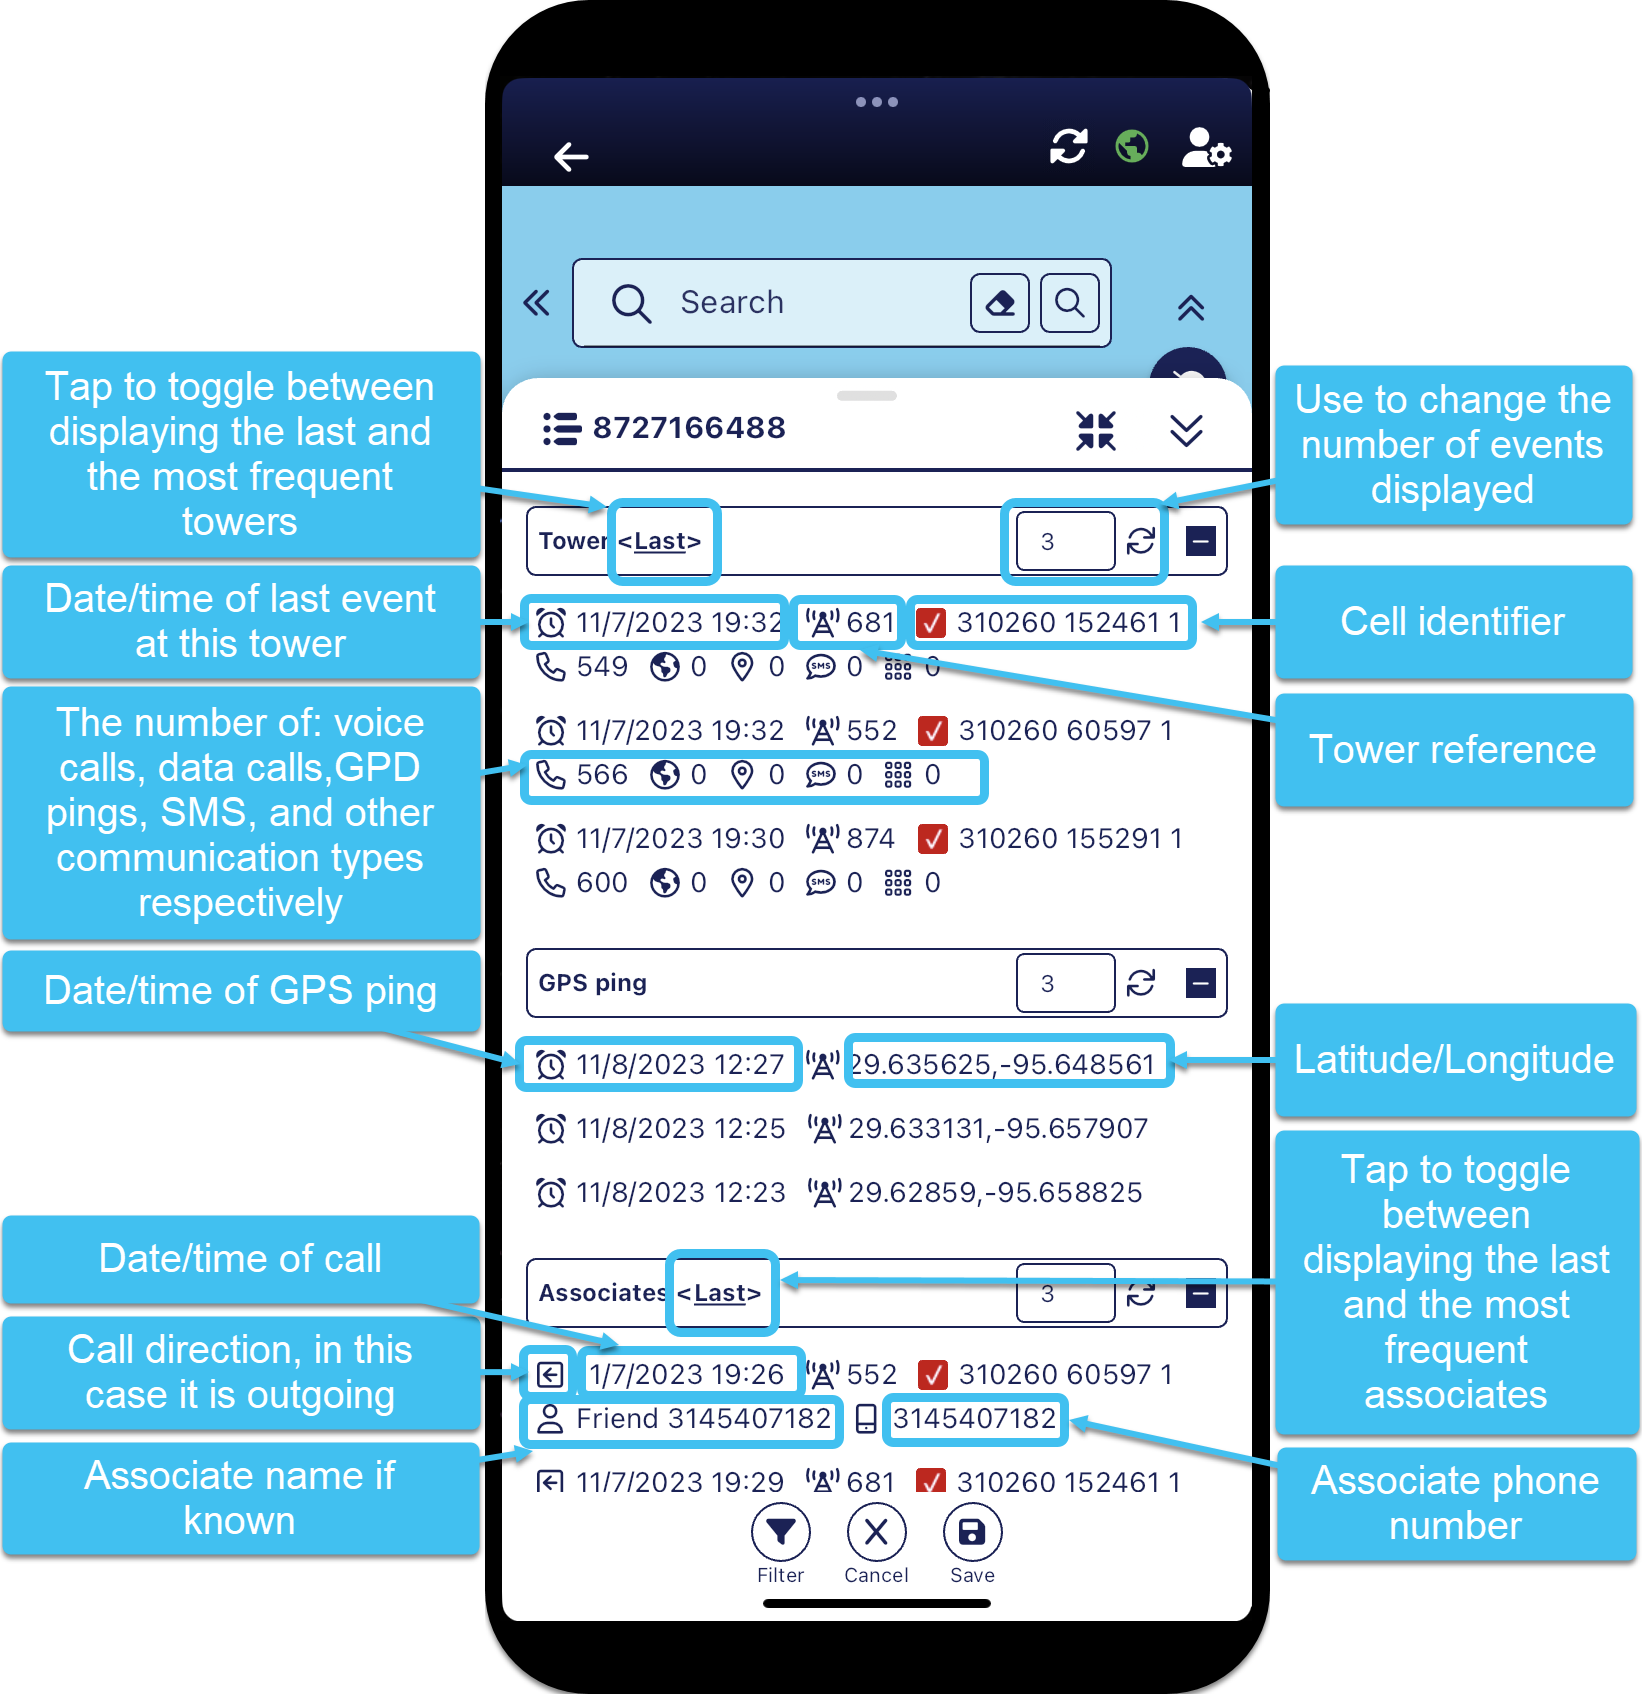
The following graphic explains the details displayed on the Events panel.

-
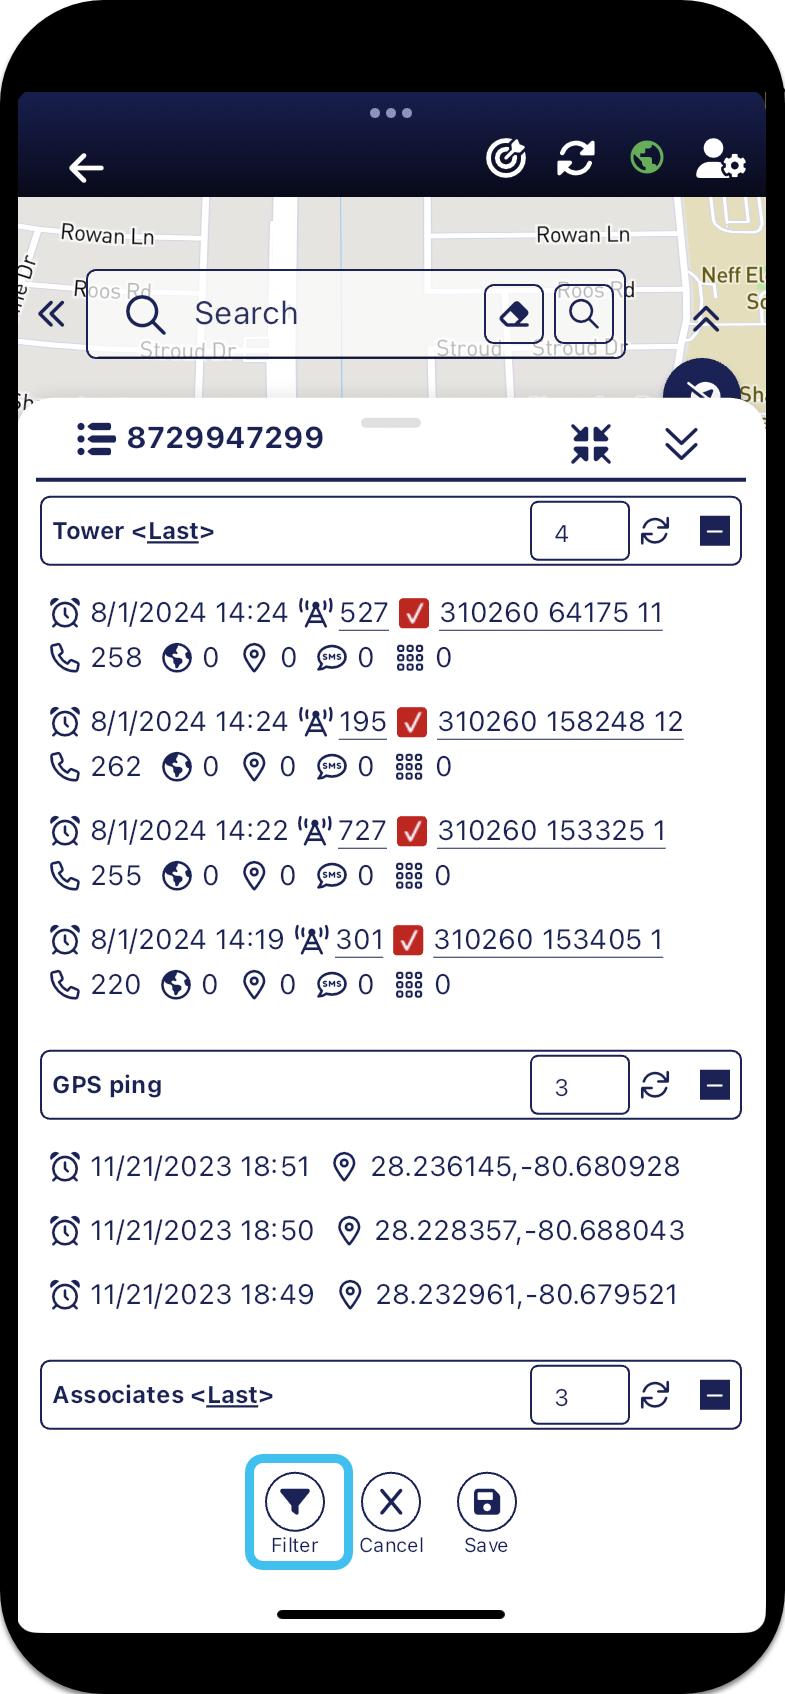
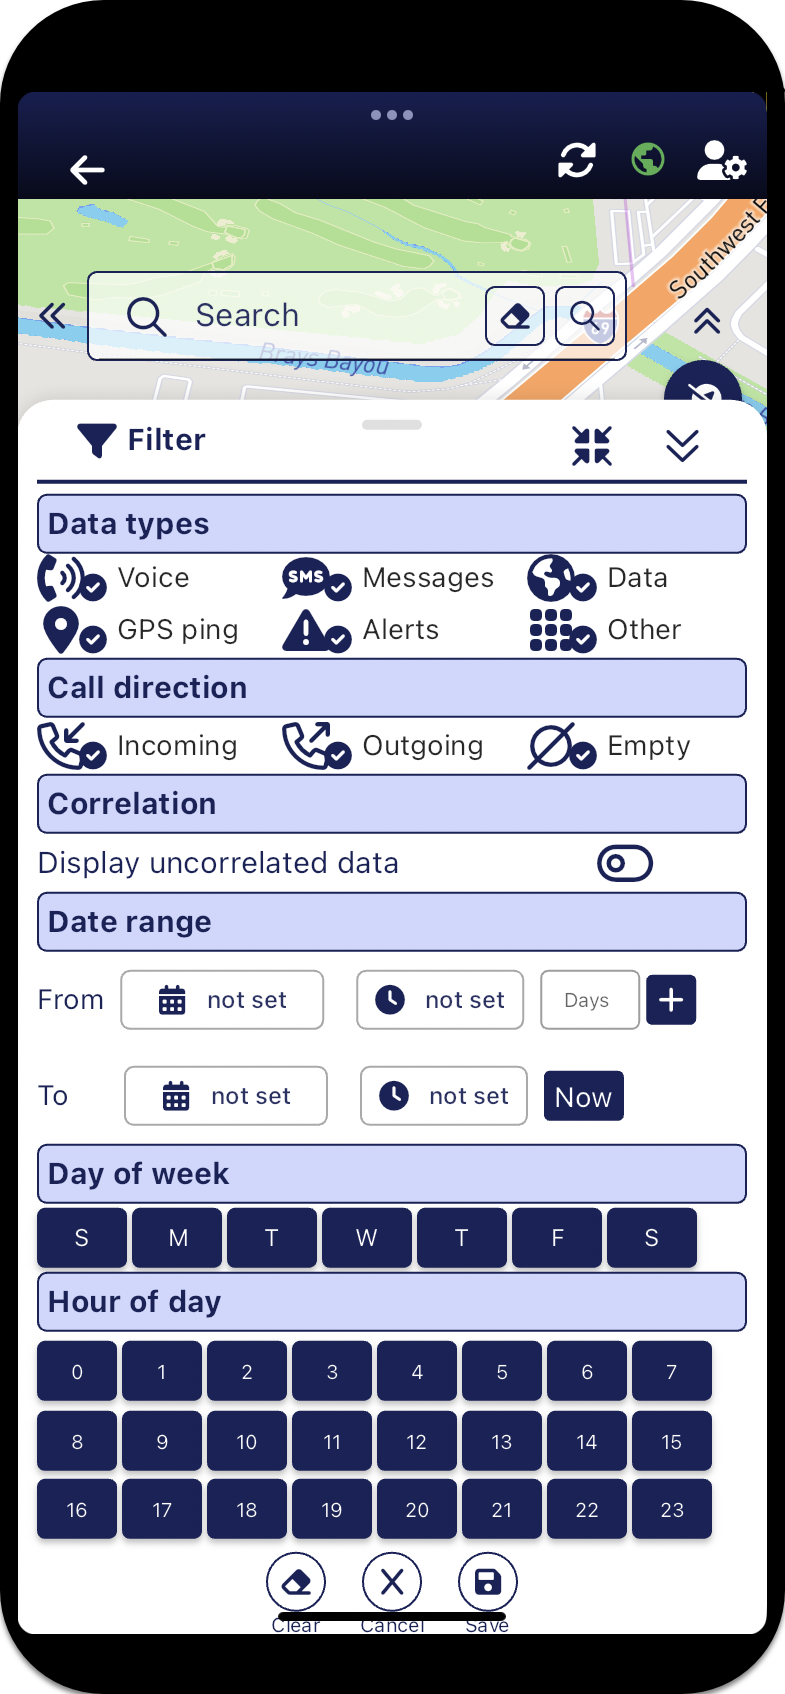
To filter the events that are displayed by data types, call direction, correlation and date/time tap
 . Note, when a filter is applied the icon displays as
  .
.
The Filter panel opens.

-
In Data types, select the check-boxes for the event types you want displayed. Other includes all other communication signals from the operator which indicate the phone is actively communicating with the tower such as the phone registering with the tower. This type of data is included on the map as a PRTT event
 .
. -
In Call direction, select the check-boxes for the calls you want displayed based on the call direction.
-
In Correlation enable the switch if you also want to include uncorrelated data on the Events panel. Although the location of this data is unknown it does provide you with the knowledge that the phone is active and communicating.
-
Use the Date range, Day of week and Hours of day to specify the data you want displayed.
-